

Abstract
Using a combined sample of adolescent twins, biological siblings, and adoptive siblings, we estimated and compared the differential shared-environmentality for high cognitive ability and the shared-environmental variance for the full range of ability during adolescence. Estimates obtained via multiple methods were in the neighborhood of 0.20, and suggest a modest effect of the shared environment on both high and full-range ability. We then examined the association of ability with three measures of the family environment in a subsample of adoptive siblings: parental occupational status, parental education, and disruptive life events. Only parental education showed significant (albeit modest) association with ability in both the biological and adoptive samples. We discuss these results in terms of the need for cognitive-development research to combine genetically sensitive designs and modern statistical methods with broad, thorough environmental measurement.
Background
The Shared Environment and Cognitive Ability
It is well established that IQ is substantially heritable (Bouchard & McGue, 1981; Devlin, Daniels, & Roeder, 1997; Bouchard & McGue, 2003; Deary, Spinath, & Bates, 2006), with heritability estimates typically ranging from 50 to 70%. Moreover, heritability of IQ increases with age, while shared-environmental variance shrinks to near-zero (McGue, Bouchard, Iacono, & Lykken, 1993; Bouchard & McGue, 2003). Specifically, even if shared-environmental effects do not persist into adulthood, their effects on cognitive ability appear to be appreciable in childhood, especially in early childhood. IQ does not emerge as a stable trait until around age five years, when the influence of heredity also begins to emerge (Jensen, 1980; Wilson, 1983). Early childhood may therefore be a developmental period when the environment is particularly influential and interventions are most likely to be successful (e.g., Heckman, 2006). Consequently, even if shared-environmental influences on cognitive ability vanish with age, they may still be developmentally relevant in directing children along different developmental pathways toward different outcomes in non-cognitive domains.
Which specific aspects of the shared environment account for its influence on the cognitive ability of children? Developmental psychology’s attempts to address this question have historically focused on characteristics of intact, biological families that correlate with the cognitive ability of the children in those families (e.g., Baumrind, 1993; Scarr, 1997). Of course, the “shared environment” of behavior genetics should not be equated with the “family environment” as it is commonly conceptualized in the social sciences, because the shared environment includes those factors from beyond the bounds of the family which contribute to sibling similarity (e.g., schools and neighborhoods). More importantly, research using intact, biological families confounds the influence of heredity and shared environment. That the association between family characteristics and child outcomes is substantially mediated by heredity can be seen by comparing the magnitude of these effects in biological versus adoptive families (Scarr & Weinberg, 1978). On the other hand, behavior-genetic research has largely neglected the question of which specific environmental factors contribute to a trait, even though genetically-informative designs are well suited to addressing this issue.
“Family-level” variables such as household income or parental level of education are attractive shared-environmental factors to examine in twin and adoption studies, because any nongenetic influence they have will contribute to between- and not within-family variance. The shared-environmental effect of family-level variables has been examined in a few studies using genetically informative designs. Using data from a sample of adoptive adolescent and biological adolescent offspring, Neiss and Rowe (2000) found that approximately 3.6% of variance in adolescent verbal IQ was attributable to the influence of parental education, acting through the shared environment. In a sample of preschool-age twins, Petrill, Pike, Price, and Plomin (2004) found that a composite measure of family “Chaos” (Confusion, Hubbub, and Order Scale—CHAOS; Matheny, Wachs, Ludwig, & Philips, 1995) and family socioeconomic status (SES) accounted for about 5% of total variance in cognitive functioning, and about 10% of the effect of the shared environment. In a subsequent analysis with the same twin sample, Pike, Iervolino, Eley, Price, & Plomin (2006) examined the association of eight different classes of environmental risk with cognitive outcomes and confirmed SES and chaos as the two strongest predictors.
The Shared Environment and High Cognitive Ability
Another interesting question is whether or not the shared-environmental contribution to IQ variance differs in magnitude for high IQ relative to the full range of ability. In a sample of twins aged six to twelve, Detterman, Thompson, and Plomin (1990) found that, with decreasing ability, shared-environmentality decreased while heritability increased. On the other hand, Cherny, Cardon, Fulker, & DeFries (1992) found no differential heritability or differential shared-environmentality across ability levels. However, the Detterman et al. sample may have oversampled at the extremes of the ability distribution, whereas Cherny et al. used a more representative sample that might not afford sufficient power to detect differential shared-environmentality. Also, the Cherny et al. sample consisted of young children (twins assessed at one year of age, with subsamples being re-assessed at ages two and three), before IQ has developed into a relatively stable trait. Thus, the possibility that high cognitive ability may be differentially shared-environmental, relative to the full range of ability, cannot be ruled out. Interestingly, using twins from the same longitudinal study as did Cherny et al., Petrill et al. (1998) found substantial differential heritability for high IQ in early childhood, though estimates of differential shared-environmentality were not statistically significant.
Studies of gifted children have observed distinguishing characteristics of the families and homes of high-ability youngsters. In Lewis Terman’s well-known study of gifted children, both fathers and mothers of gifted offspring were more educated than average (Holahan & Sears,1995). These mothers were more likely to be employed than were women in the U.S. general population, and almost half of these mothers, and fully half of the fathers, were employed in occupations placed into the two highest occupational-status classes by the U.S. Census Bureau. In the prospective Fullerton Longitudinal Study (A. W. Gottfried, A. E. Gottfried, Bathurst, & Guerin, 1994), family variables that discriminated gifted from non-gifted participants included family socioeconomic status and parental education, parental involvement and aspiration regarding children’s academics, and the amount of cultural and intellectual activity encouraged within the family. Despite the thoroughness of the assessments carried out in this study, however, it is not genetically informative. Consequently, it is impossible to determine whether its results stem from genuine environmental effects or from passive gene-environment correlation (Scarr & McCartney, 1983). It is unfortunate that no major longitudinal study of gifted twins or adoptees has ever been carried out.
The present research attempts to address some of the limitations in research on the origins of high ability by using a sample of twins and adoptees to answer the following questions. First, is there shared-environmental influence on high cognitive ability in adolescence? Second, if so, is the extent of shared-environmental influence on ability different for the high-ability population, compared to the general population? Third, are there specific, measurable family-level variables that contribute to the development of high ability? These questions were addressed in two studies, the first using twins, adoptees, and biologically related adolescent siblings to estimate the heritability and shared-environmentality of ability. The second study was based on the adoptive and biological siblings used in the first study, and was designed to explore the association between ability and measures of the family environment.
Study 1
Methods
Sample
The sample consisted of twins from the Minnesota Twin Family Study (“MTFS”; Iacono, Carlson, Taylor, Elkins, & McGue, 1999; Iacono & McGue, 2002) and siblings from the Sibling Interaction and Behavioral Study (“SIBS”; McGue et al. 2007). MTFS is a longitudinal study of a community-based sample of same-sex twins (N = 3779, including five sets of triplets), born between 1972 and 1994 in the State of Minnesota, and their parents. SIBS is an adoption study of sibling pairs (N = 1232) and their parents; its community-based sample includes families where both siblings are adopted, where both are biologically related to the parents, or where one is adopted and one is biologically related. Per the SIBS inclusion criteria, any sibling in the sample who was adopted into the family will not be biologically related to his or her co-sibling. All data used in the present report were collected during the intake assessments of each study. The MTFS sample comprises two cohorts, an eleven-year-old cohort (10-13 years old at intake; mean age = 11.78) and a seventeen-year-old cohort (16-18 years old at intake; mean age = 17.48). The age range of the siblings at intake was 10-19 for the younger siblings, and 12-20 for the older. For adopted siblings, the mean age at placement was 4.7 months (SD = 3.4 months). The characteristics of these two samples are summarized in Table I. Written informed assent or consent was obtained from all participants, with parents providing written consent for their minor children.
Table I.
Descriptive Characteristics of the Twin and Sibling Samples.
| Minnesota Twin Family Study | Sibling Interaction and Behavior Study | |||||
|---|---|---|---|---|---|---|
| Younger Twin Cohort | Older Twin Cohort | |||||
| MZ | DZ | MZ | DZ | Biological | Adopted | |
| N | 1570 | 942 | 822 | 430 | 540 | 692 |
| Female (%) | 49.81 | 53.08 | 54.01 | 53.49 | 54.07 | 55.35 |
| Age (yrs) | ||||||
| M | 11.77 | 11.80 | 17.45 | 17.52 | 14.91 | 14.94 |
| SD | 0.45 | 0.41 | 0.47 | 0.44 | 1.81 | 2.01 |
| Ethnicity (%) | ||||||
| White | 95.47 | 93.56 | 98.78 | 99.06 | 95.56 | 21.10 |
| Asian | 0.26 | 0 | 0 | 0 | 0 | 66.76 |
| Other | 4.27 | 6.44 | 1.22 | 0.94 | 4.44 | 12.14 |
| IQ | ||||||
| M | 103.23 | 103.89 | 99.94 | 99.38 | 108.08 | 106.57 |
| SD | 13.62 | 13.84 | 14.27 | 13.65 | 13.33 | 14.13 |
| High Ability(%) | 2.57 | 4.06 | 3.90 | 3.27 | 5.78 | 5.54 |
Note: The Ns for twin subsamples do not include fifteen participants with missing zygosity data.
Measurements
Twin zygosity was assessed using three indicators: a standard, parent-completed zygosity questionnaire, staff judgment of physical similarity, and an algorithm that uses various anthropometric measures. When these three estimates did not agree, zygosity was determined by analysis of a panel of genetic markers.
Participants’ cognitive ability was assessed at intake, using a short form of the Wechsler Adult Intelligence Scale-Revised (WAIS-R) for participants age 16 or older, or of the Wechsler Intelligence Scale for Children-Revised (WISC-R) for those younger than 16. The short-form consisted of two Verbal subtests (Information and Vocabulary) and two Performance subtests (Block Design and Picture Arrangement). Full-scale IQ was determined by prorating the scaled scores for these four subtests.
The sample (N = 4962) consisted of MTFS twin pairs and SIBS sibling pairs where both members of the pair had a valid intake Full-Scale IQ (FSIQ). FSIQs ranged from 50 to 156 (mean = 103.5, SD = 14.1). We operationally defined high cognitive ability as having FSIQ of 130 or greater. On this basis, we identified 193 (3.9% of the total) high-ability participants, hereinafter designated the high-ability subsample.
Data Analysis
This study involved three separate analyses: (1) biometric model-fitting of high ability, treated as a dichotomous variable; (2) a linear regression model using the high-ability subsample and their co-siblings, which does not require dichotomization; and (3) a linear regression model providing unbiased estimates of the biometric variance components of the full range of IQ. We first calculated four tetrachoric twin/sibling correlations: adoptive siblings, biological non-twin siblings, dizygotic twins, and monozygotic twins. Subsequently, we fit biometric models of high cognitive ability by analyzing the raw contingency tables in Mx (Neale, Boker, Xie, & Maes, 2003).
Dichotomizing a continuous variable typically leads to a loss of statistical power. DeFries-Fulker (DF) analysis can be applied to sibling samples wherein a selection criterion has been applied, without dichotomizing the continuous selection variable at the cutoff point. In such a sample, a participant selected for an extreme score on a quantitative trait is termed a “proband.” The sibling of a proband is termed a “co-sib.” The basic DF model (DeFries & Fulker, 1985) is given by the equation
| Equation (1) |
where C is the co-sib’s score, P is the proband’s score, R is the coefficient of relationship (0 for adoptive siblings, 0.5 for non-twin biological siblings and DZ twins, and 1 for MZ twins), B1 and B2 are regression coefficients, A is the regression constant, and e is the residual. When scores on the trait are suitably transformed, the basic DF model enables unbiased estimation of the differential heritability (hg2) and differential shared-environmentality (cg2) of being an extreme-score proband, via analysis of differential regression to the mean. As illustrated by DeFries and Fulker (1988) using twin data,
| Equation (2a) |
| Equation (2b) |
where C̄MZ and C̄DZ are the mean scores for MZ and DZ co-sibs, respectively, P̄MZ and P̄DZ are the mean scores for MZ and DZ probands, respectively, and μ is the mean of the general population (which must be estimated from a “full-range” sample). Thus, hg2 estimates the extent to which genetic factors contribute to being in the extreme-score proband sample, while cg2 estimates the corresponding shared-environmental contribution. Note that the DF model assumes the estimated kinship group means are the same. This was not the case in our full sample, as mean IQ varied significantly, albeit modestly, among the adoptive sibling (mean of 107.0, SD = 14.3, N = 808); DZ twin/biological non-twin sibling (mean of 104.7, SD = 13.8, N = 1780) and MZ twin (mean of 102.1, SD = 13.9, N = 2374) subsamples. However, these mean differences can be accounted for in a DF analysis by transforming the proband and co-sib scores by way of the following formula,
| Equation (3) |
where T is the transformed IQ score, X is the standardized IQ score, P̄g is the mean of probands from kinship group g, and μ̂g is the estimated mean of kinship group g in the general population (DeFries & Fulker, 1988; Petrill et al., 1998, provide a detailed example). After the transformation, the mean of the general population will equal zero, and the proband mean for each kinship group will equal one.
The inclusion of adoptive siblings in our sample affords a shortcut not available in twin samples. By extension from the derivation by DeFries and Fulker (1988):
| Equation (4) |
where the subscript A denotes adoptive. After transformation, the adoptive proband mean will equal 1.0, and the mean score of their co-siblings will provide a direct estimate of cg2.
In full-range samples, DF analysis can also provide unbiased estimates of biometric variance components via least-squares regression (Rodgers & McGue, 1994). The DF model with double-entered, full-range data is given by the formula
| Equation (5) |
where K1 is the trait score of one sibling, K2 is the trait score of the other, R is the coefficient of relationship, b0 is the regression constant, and b1, b2, and b3 are regression coefficients. Under the assumptions of the additive genetic model, it can be shown algebraically that b1 provides an unbiased estimate of c2, and b3 provides an unbiased estimate of h2 (Rodgers & McGue, 1994). Mean-centering both siblings’ scores enables further simplification (Rodgers & Kohler, 2005), as b0 and b2 become zero and drop out of the model, yielding:
| Equation (6) |
where b′1 estimates c2, and b′2 estimates h2.
Kohler and Rodgers (2001) confirmed the unbiasedness of this model using the generalized method of moments, which they used to derive asymptotic standard errors for the model’s parameter estimators as appropriate for the double-entered data structure. We calculated the standard errors for b′1 and b′1 following their procedure.
Finally, to address the question of whether or not high cognitive ability is differentially shared-environmental relative to the full range of ability, we compared c2 and cg2 with a simple t-test against a null value of zero. Because these two unbiased estimates were both calculated via similar statistical methods, they are suitable for direct comparison. Although the sample from which cg2 was calculated is a subsample of that from which c2 was calculated, they were calculated from two different models. Therefore, we assumed their covariance to be zero for purposes of conducting the t-test on their difference, which should result in a somewhat conservatively biased test.
Results
Table II gives estimates of the twin/sibling tetrachoric correlations and associated biometric parameters when high cognitive ability is treated as a categorical variable. The MZ tetrachoric correlation (r = 0.87) is substantially larger than both the DZ (r = 0.52) and biological sibling (r = 0.43) correlations, suggesting substantial heritable influences on high cognitive ability. Alternatively, the adoptive sibling correlation (r = 0.21) implicates a moderate shared-environmental influence. We fit five biometric models to the contingency tables for high IQ in Mx: an ACE model with unconstrained thresholds, an ACE model with thresholds constrained to be equal across groups, an AE model, a CE model, and an E-only model. The ACE model with unconstrained thresholds provided the best fit (χ2 = 5.86, df = 6, p = 0.44, AIC = -6.142), and yielded a c2 estimate of 0.17, (CI = 0, 0.42) and an a2 estimate of 0.70 (CI = 0.42, 0.93).
Table II.
Twin/sibling correlations and standardized variance component estimates in the full sample and when high ability is treated as a categorical variable.
| Twin/Sibling Correlations (95% CI) | Variance Component Estimates (95% CI) | |||||
|---|---|---|---|---|---|---|
| MZ | DZ | Biological Siblings | Adopted Siblings | a2 | c2 | |
| DF Analysis in Full Sample | .78 (.75, .80) | .52 (.46, .57) | .34 (.21, .46) | .16 (.07, .26) | .61 (.52, .69) | .18 (.11, .25) |
| Treating High-Ability as a Categorical Variable | .87 (.77, .94) | .52 (.26, .72) | .43 (-.05, .77) | .21 (-.14, .51) | .70 (.42, .93) | .17 (0, .42) |
Note: DF = DeFries-Fulker. Twin/sibling correlations when high-ability is treated as a categorical variable are tetrachoric correlations.
Table II also includes estimates of biometric parameter estimates from a DF analysis in the full sample. The DF analysis provided estimates of the heritability (h2 = 0.61; CI = 0.52, 0.69) and shared-environmentality (c2 = 0.18; CI = 0.11, 0.25) of IQ in the full range of ability. As with the model-fitting results from Mx, these results indicate a substantial genetic influence on cognitive ability plus a modest influence of the shared environment.
The DF analysis for the high-ability subsample uses differential regression towards the mean to estimate between group heritability and shared-environmentality. Figure 1 plots the mean IQ of the high ability proband group along with the three co-sib means (i.e., MZ cotwins, DZ cotwins/biological siblings, and adoptive siblings) against the background distribution of IQ in the full sample. Consistent with the existence of genetic contributions to high ability, the MZ co-sib mean regresses less towards the population mean than do the means for the other two groups. Consistent with shared-environmental contributions to high ability, the adopted co-sib mean exceeds the population mean. DF analysis yielded an estimate of differential shared-environmentality (cg2) equal to 0.24 (CI = 0.11, 0.38) and an estimate of differential heritability (hg2) equal to 0.57 (CI = 0.43, 0.71). The estimate of cg2 is comparable in magnitude both to the estimate of shared-environmentality for high ability as categorical phenotype (c2 = 0.17) and that from DF analysis of the full sample (c2 = 0.18). The confidence interval for cg2 contains the value of c2 as estimated from DF analysis. As might be expected, the t-test on the difference of these estimates, computed as shown in Equation (7), was not significant.
Figure 1. IQ Distribution in the full sample in Study 1.
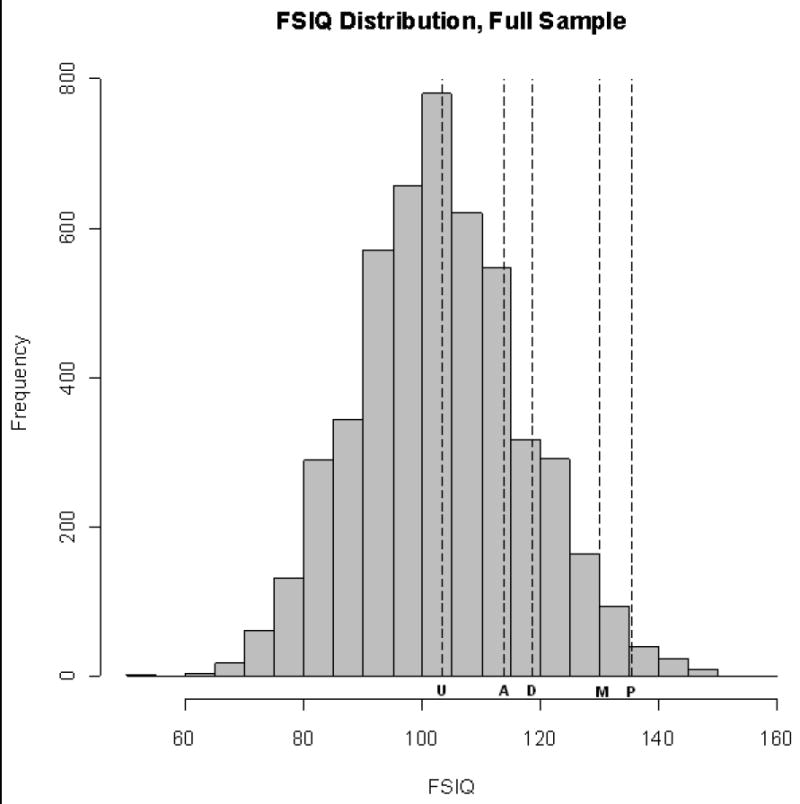
Note: The dashed lines denote the relative position of the full sample mean (U), the proband mean (P), and the co-sib means for the three kinship groups in the high-ability subsample: adoptive siblings (A), DZ twins and biological siblings (D), and MZ twins (M).
| Equation (7) |
The three estimates of shared-environmentality are each approximately 0.20. Because we did not find a significant difference between cg2 and c2, we conclude that there is a modest shared-environmental influence of a similar magnitude for both high and full-range cognitive ability in our sample.
Discussion of Study 1
Study 1 used a large sample of twin, adopted, and non-adopted siblings to determine whether there are shared-environmental influences on high cognitive ability and whether the magnitude of that influence differed from the magnitude of shared-environmental influences on IQ throughout its normal range. Our analyses yielded two alternative estimates of shared-environmentality for high ability: (1) from a biometric analysis of a categorical indicator of high ability (c2 =.17); and (2) from a DF analysis in a subsample selected for high ability (cg2 = 0.24). An augmented DF analysis of the full sample estimated shared-environmentality for the full range of ability (c2 = 0.18). These three estimates are clearly numerically consistent and indicate that existence of a shared-environmental influence on high cognitive ability whose magnitude is moderate and comparable to the effect of shared environment throughout the full range of IQ. Study 2 used an adoption design in an attempt to identify the specific factors that underlie the shared-environmental influence on high cognitive ability.
Study 2
Our remaining research question is: are there specific, measurable family-level variables that contribute to the development of high cognitive ability? While the shared-environmental influence on both full-range and high ability in our sample do not differ in magnitude, it is nonetheless possible that particular environmental variables might have disproportionately more or less influence on the etiology of high ability, relative to the full range. Therefore, we chose to focus Study 2 on whether any family-level variables measured in the SIBS study are associated with cognitive ability. Because SIBS is an adoption study, it enables us to examine the effect of family-level environmental variables on IQ, free of confounding genetic influence. We chose to examine three variables that are easily defensible as being “family-level,” and which might potentially mediate the influence of the shared environment: parental occupational status, parental education, and disruptive life events.
Methods
Sample
The sample used in Study 2 (N = 1222) consisted of all SIBS participants who were included in Study 1’s full sample. As Table I shows, the SIBS sample is similar to the MTFS samples in terms of gender ratio and age distribution, but its ethnic composition is quite different (53.8% Caucasian, 37.6% Asian, 8.5% other). Though not significantly different from each other, the Caucasian mean (107.59, SD = 13.65) and the Asian mean (108.05, SD = 13.93) FSIQ were both significantly greater than the mean for “other” (i.e., neither Asian nor Caucasian) participants (101.36, SD = 12.90). FSIQ scores in Study 2’s sample ranged from 61 to 146 (mean = 107.23, SD = 13.80).
Environmental Measures
Parental Education Level and Occupational Status
During recruitment (i.e., prior to the intake assessment), parent occupational status and education level were determined from a phone interview of the mother in each family, completed prior to the family’s visit. During this interview, mothers reported on the original biological or adoptive parents (i.e., the parents to whom the child was born or placed for adoption), and any stepparents. Data were also collected concerning all children in the family, including dates of birth and, in the case of adoptees, ages at placement in the family. Occupational status was coded on the Hollingshead scale (Hollingshead, 1957). Education level was coded on a seven-point scale, ranging from less than high school (1) to “professional” (7). For the purposes of the present study, the occupations of individuals who were homemakers, institutionalized, or recorded as “no occupation” were coded as missing. We reverse-coded the Hollingshead-scaled variable, so that higher values indicate greater occupational status, producing a scale ranging from 1 to 7, where 1 corresponded to occupations such as “street cleaner” or “laborer,” and 7 to occupations such as “bank president” or “physician.”
We defined “family-level” occupational status as the higher score of the two original adoptive or biological parents (i.e., not stepparents). In families where there was only one valid value for parental occupational status value, we used that value. In families with no valid values for parental occupational status, we coded the family-level value as missing; there were fourteen such families in the sample. We decided to use only the original parents’ data because these would have been the parents with whom the siblings would have lived during the earliest portions of their childhoods.
We calculated parental education level by averaging the education scores of the original adoptive or biological parents. There were seven families for which parental education level was based on the score of one parent; no families were missing data for both parents.
Life Events
During the intake assessment, each parent completed a structured life-events interview. For each life-event item, the parent reported whether or not the event ever occurred in their lifetime, and if it did, their age at the last occurrence. On the basis of an earlier analysis using SIBS data (Bemmels, Burt, Iacono, Legrand, & McGue, 2007) and item content, we identified a set of twenty-five items we termed “independent, family-level” life events indicative of environmental instability in the siblings’ lives. The content of these items is summarized in the Appendix. Here, “independent” denotes “likely to be independent of the children’s behavior.” The “independence” of the events is an important consideration, as children can experience certain life events as a result (at least in part) of their genetically influenced behavior (e.g., being suspended from school). Assessing such “dependent” events does not provide “clean” information about the children’s environment.
For an event to be counted as “family-level,” it should not contribute to within-family variance, that is, it should be constant with respect to both siblings in a pair. We used the mothers’ life-events interview to determine offspring exposure to family-wide events, i.e., events affecting the entire family because they affected the mother and/or father as well as the children. Specifically, an event was coded as positive if the mother reported it had occurred at least once during the lifetime of her younger participating child (in which case it would necessarily also have occurred during the lifetime of her older participating child). If the younger sibling were adopted, his or her “effective” lifetime would begin at placement with the adoptive family. Mothers’ reports were supplemented by the life-event reports made by fathers in the case of events that applied specifically to the father.
We counted responses from each parent only if that parent was one of the original adoptive or biological parents identified in the pre-intake phone interview. The family-level life-events score (a total score meant to represent the instability of the family environment) was the sum of positively coded events, using eighteen items from the mother’s report and seven items from the father’s report. If the original father was not assessed at intake, as was the case for 72 families, this total was calculated instead using the expected value of the father’s sum conditional on the mother’s sum, as calculated from the rest of the sample. If the original mother was not assessed at intake, as was the case for nine families, the value of this total was designated as missing.
Data Analysis and Results
All three environmental variables are rather skewed. As might be expected for an adoption sample, most of the families are clustered toward the higher end of the two SES scales, leaving a relative dearth of families at the lower end. This is consistent with a previous report using SIBS data (McGue et al., 2007), which found a high mean and a lower variance of SES among parents who adopted children, relative to parents with only biological children. However, McGue et al. also found that this range restriction of SES did not create a downward bias in estimates of like-sex sibling correlations for IQ. The distribution of life-events scores is somewhat positively skewed, with most families experiencing a few of the events probed by the items we selected.
Descriptive statistics for the three family-level variables of interest are given in Table III. Also given in the table are estimates of the relationship between each of the three candidate environmental variables and IQ in the adoptive and non-adoptive samples. The influence of each environmental measure was assessed in terms of its correlation coefficient with offspring IQ. We also regressed high cognitive ability status on each environmental measure and report the corresponding odds ratio (OR) from the logistic regression analysis. Finally, we estimated the regression of offspring IQ onto each environmental variable using mixed-effect linear models that controlled for sibling-pair clustering and demographic covariates (sex and ethnicity). These estimated coefficients are also reported in Table III.
Table III.
Family-level variables’ descriptive statistics and association with FSIQ, in adoptive and biological SIBS participants.
| Number of Participants | Adopted 686 | Bio 536 | |
|---|---|---|---|
| Parental Occupation | M | 5.75 | 5.23 |
| SD | 1.24 | 1.48 | |
| b | 0.57 | 1.45* | |
| r | 0.05 | 0.16* | |
| OR | 1.16 | 1.13 | |
| Parental Education | M | 5.10 | 4.63 |
| SD | 1.12 | 1.27 | |
| b | 1.05* | 2.56* | |
| r | 0.09* | 0.24* | |
| OR | 1.11 | 1.79* | |
| Family Life Events | M | 2.94 | 3.42 |
| SD | 2.20 | 2.64 | |
| b | -0.22 | -0.24 | |
| r | -0.04 | -0.07 | |
| OR | 0.87 | 1.00 | |
Significant at p < 0.05.
Note: b = estimated partial regression of FSIQ onto family variable, r = Pearson correlation of FSIQ with family variable, OR = odds ratio for high-ability status per unit change in family variable. Parental Occupational scale ranges 1-7, Parental Education scale ranges 1-7, Family Life Events scale ranges 0-14 in the sample, out of 25 items.
In the non-adoptive sample, both parental education and occupation were significantly but moderately associated with IQ, assessed either quantitatively or as an indicator of high-ability status. There were no significant associations with family life events. In contrast, in the adoptive sample only parent education was associated with offspring IQ. As expected, there is some evidence, in terms of both mean difference and lower variance, of restriction of range in the three environmental variables in the adoptive as compared to non-adoptive samples. Restriction of range attenuates the correlation but not the associated regression coefficient (McGue et al., 2007). Consequently, the modest size of the regression coefficient estimates in the adoptive sample suggests that the environmental measures are minimally environmentally associated with offspring IQ. For example, the estimate of the regression coefficient for parent IQ in the adoptive families indicates that average offspring IQ increased only 1.05 points for every unit increase in mid-parental education level (where one unit would be the difference between the scale values for, e.g., less than high school and high school graduate, or between some college and bachelor’s degree). Figure 2 clearly illustrates the significant effects identified in Table III for parental education and occupational status among biological offspring.
Figure 2. Barplots depicting mean FSIQ for adoptive (lighter bars) and biological (darker bars) offspring, at each level of the three environmental variables: occupational status (2a), parental education (2b), life events (2c).
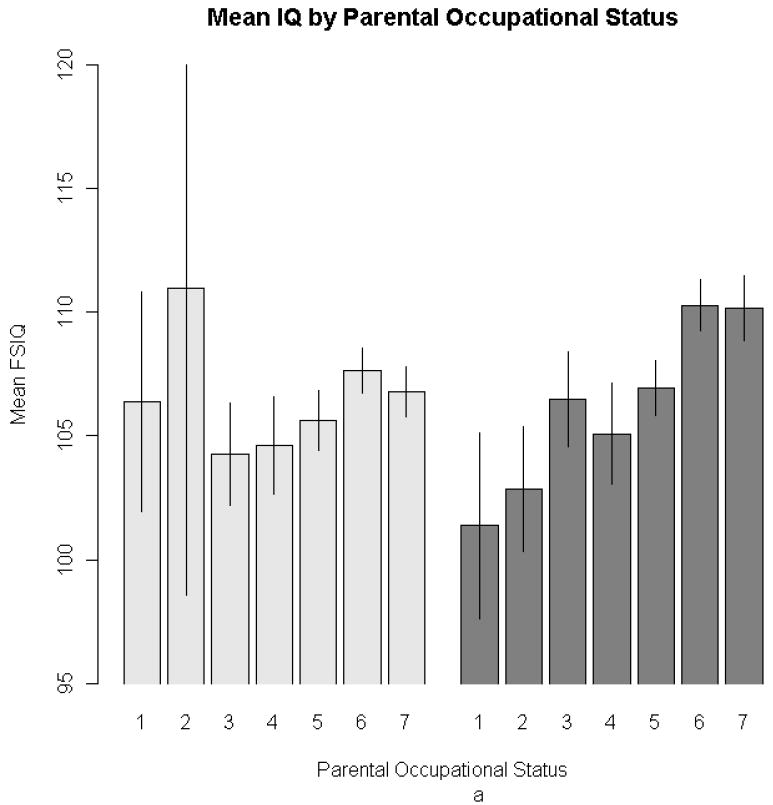
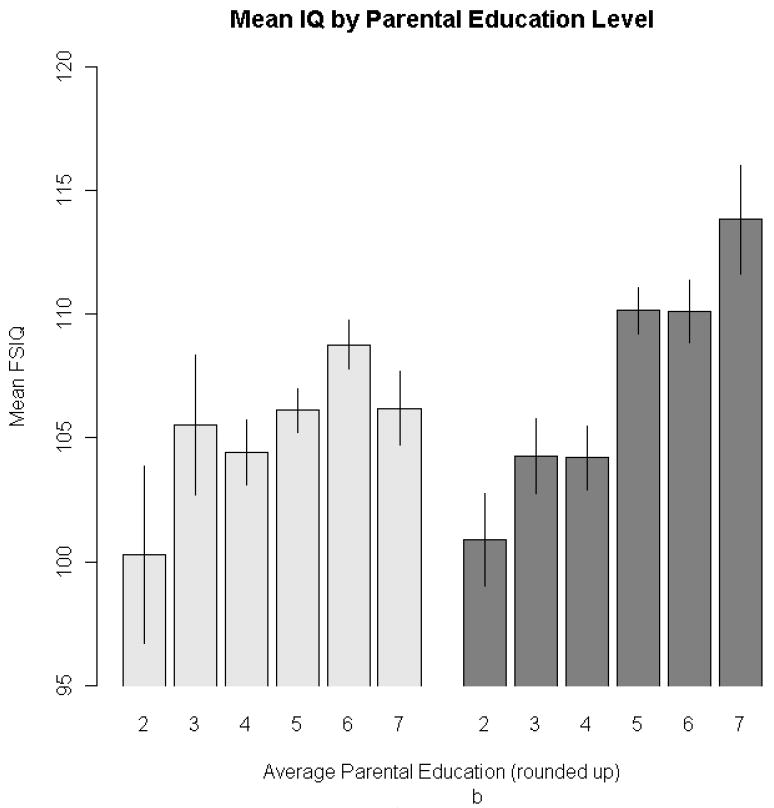
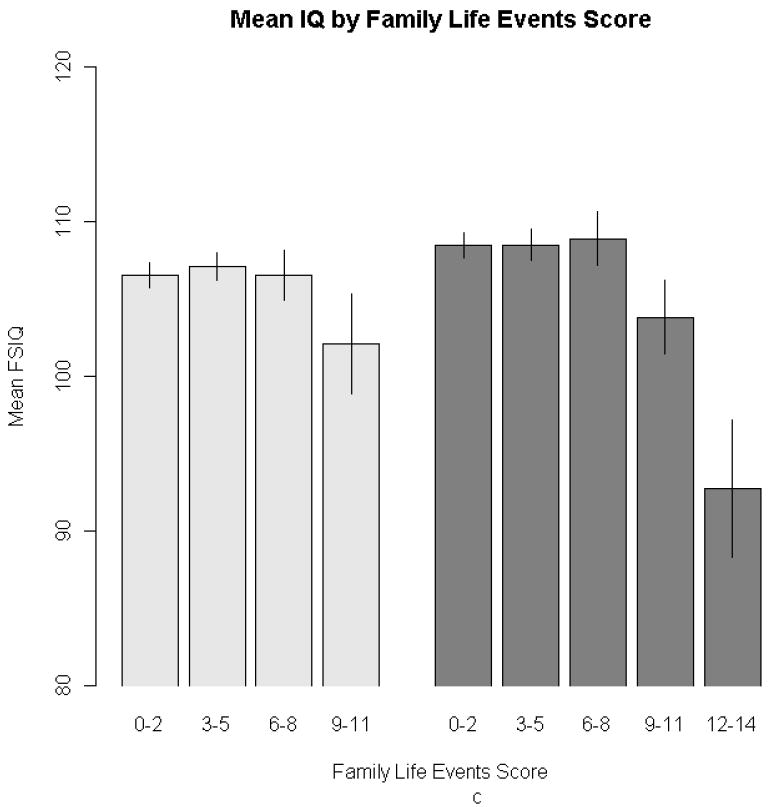
Note: For ease of presentation, family life-events scores were grouped into three-point intervals. There were life-events scores in the biological subsample that were greater than 11, the maximum in the adoptive subsample. Error bars represent ± 1 SE.
The Pearson correlation between parental education and adopted offspring IQ is 0.09 (Table III), and after partialling out sex and ethnicity from both variables, the correlation remains statistically significant at 0.08. Thus, approximately 1% of the total variance in adoptee IQ is attributable to parental education. Adoptee data also enables straightforward calculation of the proportion of shared-environmental variance attributable to parental education. Assuming that parental education influences offspring IQ entirely by way of the latent shared environment “C,” as depicted in Figure 3, the path coefficient leading from parental education to C can be calculated from the correlation of the two observed variables (r = 0.08) and the shared-environmentality of IQ from Table II (c2 = 0.18). The square of this path coefficient represents the amount of variance in C that is attributable to parental education. As shown in Figure 3, approximately 4% of the shared-environmental variance in IQ is attributable to parental education.
Figure 3.
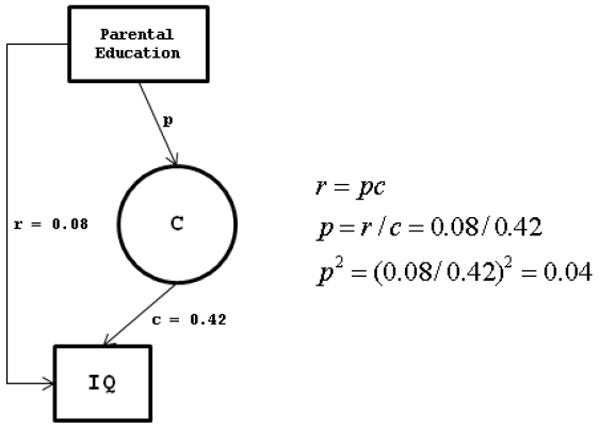
Diagram depicting mediation of parental education by latent shared environment. As shown in equations, approximately 4% of the shared-environmental variance is accounted for parental education.
General Discussion
In Study 1, we estimated the shared-environmentality of both high and full-range cognitive ability via analyses of contingency tables and via DF analysis, a linear regression procedure. On the whole, these results indicate a modest effect of the shared environment on both high and full-range cognitive ability, accounting for approximately 20% of trait variance within an adolescent sample.
In Study 2, we used a sample of adoptive and biological siblings to examine the association of IQ with three measures of the family environment: parental occupational status, parental education level, and disruptive life events. The use of an adoption sample enabled us to directly estimate the main effects of these environmental variables, independent of the confounding influence of heredity. Of these three variables, only parental education showed clear association with IQ in both sibling subsamples though demographic covariates (sex and ethnicity; results not shown) had significant effects as well.
Estimates of shared-environmentality can be biased upward (and heritability estimates downward) by assortative mating and by selective placement of adoptees. The spousal correlation for FSIQ among MTFS and SIBS parents is 0.34 To put this value in perspective, a spousal correlation of this magnitude would cause heritability to be underestimated by more than 25% in a simple biometric model of twin data (given a set of “worst-case” assumptions)2. However, assortative mating would commensurately inflate the estimate of c2, which does not appear to have occurred in our data. The adopted-sibling correlation for FSIQ, which can be interpreted as a direct estimate of shared-environmental variance unaffected by assortative mating, is quite close in magnitude to the c2 estimate from DF analysis of the full sample. Nonetheless, this reasoning presumes that there is no selective placement of adoptees. Selective placement refers to the placement of genetically related children into similar adopting families. A majority (more than two-thirds) of our adopted sample were adopted internationally, and we and the adoption agencies lack data about the ability level of those in their biological families. It is therefore a limitation of our study that we cannot refute the possibility of selective placement effects, either by design or by chance, in our sample.
Our shared-environmentality estimate of approximately 20% is within the bounds of what would be expected for a sample with this age range, based on prior reviews (McGue et al., 1993; Bouchard & McGue, 2003). Shared-environmental variance in IQ declines with age, so a sample of children would be preferable to our sample of adolescents in a study of the shared environment. Even so, data from the present sample showed significant shared-environmental influence in both DF analyses. The 20% figure is also reminiscent of the results obtained in the Hawaii Family Study of Cognition (Vandenberg & Kuse, 1981), wherein 0.20 was the approximate upper bound for the R2 from a regression of cognitive ability scores onto forty-four “environmental” variables (some of which variables, Vandenberg & Kuse acknowledge, “may reflect genetic attributes of the parents” [p. 10]). But, the design of that study did not enable any estimation of the relative effects of genetics versus environment.
In contrast, twin and adoption studies enable estimation of the effects of specific environmental variables against a background of latent heredity and shared environment. Studies of this sort suggest that the effect of the shared environment can be mediated by parental SES and household chaos (Petrill et al., 2004; Pike et al., 2006) or by parental educational attainment (Neiss & Rowe, 2000), though these variables account for small portions of the shared-environmental and total variance. Similarly, we report a small effect of parental education on the IQs of adopted adolescents, but negative results for parental occupational status and disruptive life events among these adoptees.
Our negative results for life events may be due to our use of dichotomous scores for each of the life-events items. Though SIBS parents report the number of instances a particular event has occurred, we cannot infer how many of those instances occurred during the siblings’ lifetimes.1 Another limitation is our use of only three measures of the shared environment. While the three measures are defensible as “family-level,” there are almost certain to be factors beyond the bounds of the family that contribute to sibling similarity (such as neighborhoods, schools, peers, etc.). Likewise, intra-family variables are not necessarily facets of the shared environment (for example, each sibling can have a very different relationship with the same parent). Future research regarding environmental effects on cognitive ability will be best served by genetically sensitive designs that combine large samples, sophisticated methodology, and a variety of environmental measures.
Acknowledgments
This work was supported by U.S. Public Health Service grants # DA005147, AA009367, DA13240, AA11886, and MH66140, and by grant # 13575 from the John Templeton Foundation (“The Genetics of High Cognitive Abilities”).
The authors give their special thanks to Brian M. Hicks for his assistance in the analysis of the life-events and parental-psychopathology data.
Appendix: Life Events Item Content
Items from mother’s life events interview:
Divorce.
Former spouse remarrying.
Death of spouse.
Separation from spouse due to conflict.
Separation from spouse due to necessity.
Arguing a lot with spouse.
Treatment for emotional problem.
Treatment for alcohol/drugs.
Suicide attempt.
Fired / laid off.
Financial problems.
Bankruptcy.
Public assistance (welfare, etc.).
Public assistance cut off.
Arrested or jailed.
Moving 50+ miles.
Serious/chronic illness.
Hospitalization.
Items from father’s life events interview:
-
19
Treatment for emotional problems.
-
20
Treatment for alcohol/drugs.
-
21
Suicide attempt.
-
22
Fired / laid off.
-
23
Arrested or jailed.
-
24
Serious/chronic illness.
-
25
Hospitalization.
Footnotes
However, one interesting aspect of our life-events results is the marked decline in ability for biological offspring at the upper life-events extreme (scores greater than eleven, which occurred for only two families). This suggests that a sufficiently disruptive environment can detrimentally affect cognitive ability, or alternately, that instability-producing behavior in parents and IQ decrements in their natural children may stem from common genetic factors. There were no adoptees with family life-events scores of this magnitude, so the effect of extreme environmental instability, independent of heredity, cannot be estimated. In general, adoptive samples do not represent the negative extremes of family environments, so results from adoption studies cannot rule out the possibility that exceptionally unfavorable environments can produce exceptionally unfavorable effects.
Let us assume a high heritability coefficient for adult IQ (0.8). Let us also assume that spouses select mates for psychometric IQ per se, and that the phenotypic spousal correlation perfectly induces the spousal genetic correlation. The latter two assumptions are generally not true, but they simplify the model, and enable a “worst-case” estimate of the biometric bias induced by assortative mating. Under these assumptions, the assortative mating coefficient will be, , or 0.27. The expected additive-genetic correlation for DZ twins will therefore be 0.5 × (1 + 0.27), or 0.64. If we attempt to compute the Falconer estimate of narrow-sense heritability in twin data (a2 = 2(rMZ − rDZ), which typically assumes no assortative mating) using rDZ = 0.64a2 + c2, we discover that the Falconer estimate only yields 0.72a2, an underestimate of over 25%. The “missing” variance will be consumed by the Falconer shared-environmentality estimate (c2 = 2rDZ − rMZ).
On the suggestion of an anonymous referee, we conducted post-hoc analyses to investigate whether parental psychopathology predicted offspring IQ. We examined composite indicators of two of the primary phenotypes of interest in SIBS, substance abuse and behavioral disinhibition. As an indicator of substance abuse, we used scores on the first principal component extracted from measures of nicotine dependence (e.g., symptom count, per-day frequency of use), heavy alcohol consumption (e.g., frequency of drinking, largest number of drinks in one day), alcohol abuse and dependence (e.g., withdrawal and tolerance, interference with social and occupational functioning), illicit drug abuse and dependence (e.g., symptom count, number of different drugs used), and frequency of illicit drug use. As an indicator of behavioral disinhibition, we used scores on the first principal component extracted from measures such as lifetime symptom counts for conduct disorder, relevant life-events (e.g., trouble with the law, early age of first intercourse), a reverse-scored socialization scale, and personality scales measuring aggression and low constraint. For each family, we summed original parents’ scores on the substance abuse measure and on the behavioral disinhibition measure. We then estimated the regression of offspring IQ onto each of these, using mixed-effect linear models that controlled for sibling-pair clustering, sex, and ethnicity. The coefficient for the behavioral disinhibition variable was significant neither among biological (b = -1.59, SE = 1.41) nor adopted (b = -1.84, SE = 1.54) participants. Despite suggestive results for the substance abuse variable among biological participants (b = -1.99, SE = 1.08), its coefficient was significant in neither that subsample nor among adoptees (b = -0.69, SE = 1.33).
The original publication is available at http://www.springerlink.com/content/?k=10.1007%2fs10519-009-9265-0.
Reference List
- Baumrind D. The average expectable environment is not good enough: A response to Scarr. Child Development. 1993;64:1299–1317. [PubMed] [Google Scholar]
- Bouchard TJ, McGue M. Familial studies of intelligence: A review. Science, New Series. 1981;212(4498):1055–1059. doi: 10.1126/science.7195071. [DOI] [PubMed] [Google Scholar]
- Bouchard TJ, McGue M. Genetic and environmental influences on human psychological differences. Journal of Neurobiology. 2003;54:4–45. doi: 10.1002/neu.10160. [DOI] [PubMed] [Google Scholar]
- Bemmels HR, Burt SA, Legrand LN, Iacono WG, McGue M. The heritability of life events: An adolescent twin and adoption study. Twin Research and Human Genetics. 2008;11(3):257–265. doi: 10.1375/twin.11.3.257. [DOI] [PubMed] [Google Scholar]
- Cherny SS, Cardon LR, Fulker DW, DeFries JC. Differential heritability across levels of cognitive ability. Behavior Genetics. 1992;22(2):153–162. doi: 10.1007/BF01066994. [DOI] [PubMed] [Google Scholar]
- Deary IJ, Spinath FM, Bates TC. Genetics of intelligence. European Journal of Human Genetics. 2006;14:690–700. doi: 10.1038/sj.ejhg.5201588. [DOI] [PubMed] [Google Scholar]
- DeFries JC, Fulker DW. Multiple regression analysis of twin data. Behavior Genetics. 1985;15(5):467–473. doi: 10.1007/BF01066239. [DOI] [PubMed] [Google Scholar]
- DeFries JC, Fulker DW. Multiple regression analysis of twin data: Etiology of deviant scores versus individual differences. Acta Geneticae Medicae et Gemellologiae. 1988;37:205–216. doi: 10.1017/s0001566000003810. [DOI] [PubMed] [Google Scholar]
- Detterman DK, Thompson LA, Plomin R. Differences in heritability across groups differing in ability. Behavior Genetics. 1990;20(3):369–384. doi: 10.1007/BF01065564. [DOI] [PubMed] [Google Scholar]
- Devlin B, Daniels M, Roeder K. The heritability of IQ. Nature. 1997;388:468–471. doi: 10.1038/41319. [DOI] [PubMed] [Google Scholar]
- Gottfried AW, Gottfried AE, Bathurst K, Guerin DW. Gifted IQ: Early Developmental Aspects: The Fullerton Longitudinal Study. New York: Plenum Press; 1994. [Google Scholar]
- Heckman JJ. Skill formation and the economics of investing in disadvantaged children. Science. 2006;312:1900–1902. doi: 10.1126/science.1128898. [DOI] [PubMed] [Google Scholar]
- Hollingshead AB. Two Factor Index of Social Position. New Haven, CN: August B. Hollingshead; 1957. [Google Scholar]
- Holahan CK, Sears RK. The Gifted Group in Later Maturity. Stanford: Stanford University Press; 1995. [Google Scholar]
- Iacono WG, Carlson SR, Taylor J, Elkins IJ, McGue M. Behavioral disinhibition and the development of substance-use disorders: Findings from the Minnesota Twin Family Study. Development and Psychopathology. 1999;11:869–900. doi: 10.1017/s0954579499002369. [DOI] [PubMed] [Google Scholar]
- Iacono WG, McGue M. Minnesota Twin Family Study. Twin Research. 2002;5(5):482–487. doi: 10.1375/136905202320906327. [DOI] [PubMed] [Google Scholar]
- Jensen AR. Bias in Mental Testing. New York: The Free Press; 1980. [Google Scholar]
- Kohler HP, Rodgers JL. DF-analyses of heritability with double-entry twin data: Asymptotic standard errors and efficient estimation. Behavior Genetics. 2001;31(2):179–191. doi: 10.1023/a:1010253411274. [DOI] [PubMed] [Google Scholar]
- Matheny AP, Wachs TD, Ludwig JL, Philips K. Bringing order out of chaos: Psychometric characteristics of the confusion, hubbub, and order scale. Journal of Applied Developmental Psychology. 1995;16:429–444. [Google Scholar]
- McGue M, Bouchard TJ, Iacono WG, Lykken DT. Behavioral genetics of cognitive ability: A life-span perspective. In: Plomin R, McClearn GE, editors. Nature, nurture and psychology. Washington: American Psychological Association; 1993. pp. 59–76. [Google Scholar]
- McGue M, Keyes M, Sharma A, Elkins I, Legrand L, Johnson W, et al. The environments of adopted and non-adopted youth: Evidence on range restriction from the Sibling Interaction and Behavior Study (SIBS) Behavior Genetics. 2007;37:449–462. doi: 10.1007/s10519-007-9142-7. [DOI] [PubMed] [Google Scholar]
- Neale MC, Boker SM, Xie G, Maes HH. Mx: Statistical Modeling. 6. Richmond, VA: VCU, Department of Psychiatry; 2003. [Google Scholar]
- Neiss M, Rowe DC. Parental education and child’s verbal IQ in adoptive and biological families in the National Longitudinal Study of Adolescent Health. Behavior Genetics. 2000;30(6):487–495. doi: 10.1023/a:1010254918997. [DOI] [PubMed] [Google Scholar]
- Petrill SA, Pike A, Price T, Plomin R. Chaos in the home and socioeconomic status are associated with cognitive development in early childhood: Environmental mediators identified in a genetic design. Intelligence. 2004;32:445–460. [Google Scholar]
- Petrill SA, Saudino K, Cherny SS, Emde RN, Fulker DW, et al. Exploring the genetic and environmental etiology of high general cognitive ability in fourteen- to thirty-six-month-old twins. Child Development. 1998;69(1):68–74. [PubMed] [Google Scholar]
- Pike A, Iervolino AC, Eley TC, Price TS, Plomin R. Environmental risk and young children’s cognitive and behavioral development. International Journal of Behavioral Development. 2006;30(1):55–66. [Google Scholar]
- Rodgers JL, Kohler HP. Reformulating and simplifying the DF analysis model. Behavior Genetics. 2005;35(2):211–217. doi: 10.1007/s10519-004-1020-y. [DOI] [PubMed] [Google Scholar]
- Rodgers JL, McGue M. A simple algebraic demonstration of the validity of Defries-Fulker analysis in unselected samples with multiple kinship levels. Behavior Genetics. 1994;24(3):259–262. doi: 10.1007/BF01067192. [DOI] [PubMed] [Google Scholar]
- Scarr S. Behavior-genetic and socialization theories of intelligence: Truce and reconciliation. In: Sternberg RJ, Grigorenko E, editors. Intelligence, Heredity, and Environment. New York: Cambridge University Press; 1997. pp. 3–41. [Google Scholar]
- Scarr S, McCartney K. How people make their own environments: A theory of genotype → environment effects. Child Development. 1983;54:424–443. doi: 10.1111/j.1467-8624.1983.tb03884.x. [DOI] [PubMed] [Google Scholar]
- Scarr S, Weinberg RA. The influence of “family background” on intellectual attainment. American Sociological Review. 1978;43(5):674–692. [Google Scholar]
- Vandenberg SG, Kuse AR. In search of the missing environmental variance in cognitive ability. In: Gedda L, Parisi P, Nance WE, editors. Twin Research 3: Intelligence, Personality, and Development. New York: Alan R. Liss, Inc; 1981. pp. 9–16. [PubMed] [Google Scholar]
- Wilson RS. The Louisville Twin Study: Developmental synchronies in behavior. Child Development. 1983;54:298–316. [PubMed] [Google Scholar]