

Abstract
Silicone oil, which is used as a lubricant or coating in devices such as syringes, needles and pharmaceutical containers, has been implicated in aggregation and particulation of proteins and antibodies. Aggregation of therapeutic protein products induced by silicone oil can pose a challenge to their development and commercialization. To systematically characterize the role of silicone oil on protein aggregation, the effects of agitation, temperature, pH and ionic strength on silicone oil-induced loss of monomeric anti-streptavidin IgG 1 antibody were examined. Additionally, the influences of excipients polysorbate20 and sucrose on protein aggregation were investigated. In the absence of agitation, protein absorbed to silicone oil with approximately monolayer coverage, however silicone oil did not stimulate aggregation during isothermal incubation unless samples were also agitated. A synergistic stimulation of aggregation by a combination of agitation and silicone oil was observed. Solution conditions which reduced colloidal stability of the antibody, as assessed by determination of osmotic second virial coefficients, accelerated aggregation during agitation with silicone oil. Polysorbate20 completely inhibited silicone oil-induced monomer loss during agitation. A formulation strategy optimizing colloidal stability of the antibody as well as incorporation of surfactants such as polysorbate20 is proposed to reduce silicone oil-induced aggregation of therapeutic protein products.
Keywords: Protein aggregation, anti-streptavidin IgG1, silicone oil, agitation
Introduction
Under solution conditions where protein stability appears to be optimized to minimize protein aggregation in bulk solution, aggregates and particles can form.1 Although these aggregated species may constitute only a minute fraction of the total protein population, their presence can render a product clinically unacceptable due to potential for immune response in the patient.2 Foreign materials, such as microparticles of glass from product containers1, may serve as heterogeneous nuclei for protein aggregation and particle formation. Other foreign materials that can be present as microparticles in protein formulations include stainless steel and silicone from filling pumps, rubber from stoppers and silicone oil from pre-filled syringes. Recently, the potential for silicone oil to induce aggregation and particle formation has been of great concern in the industry because of efforts to develop therapeutic protein products in prefilled syringes.3–5
Many packaging components for parenteral products (e.g., glass syringes, vial stoppers) require the use of some form of lubrication for their functionality and to enable processing.6 The low surface tension of silicone oil (20–25 mJ/m2) provides it with good wetting properties, allowing the oil to spread readily on most solid surfaces.7 Silicone oil is applied to cartridges and barrels of plastic and glass syringes to facilitate smooth and easy movement of plungers within the barrels. Silicone oil is applied to exterior surfaces of hypodermic needles to reduce the frictional drag and pain when the needles pass through the tissue.6
Contamination of therapeutic protein formulations with silicone oil was first reported over two decades ago following observation of elevated blood glucose levels in patients who were administered “cloudy” insulin from plastic syringes.8 Analysis of the insulin formulations revealed that silicone oil was causing protein particle formation.3,9,10 Despite these early reports, studies of protein aggregation induced by silicone oil have appeared infrequently in literature. Most recently, Jones et al.,5 showed that silicone oil at a concentration of 0.5% (w/v) induced aggregation of four model proteins (ribonuclease A, lysozyme, bovine serum albumin and concanavalin A) during incubation at elevated temperature. However, there have not been published reports on silicone oil effects on aggregation of monoclonal antibodies, although hundreds of new antibodies are in various stages of development as therapeutic agents.11–13
An inherent challenge for characterization of the effects of silicone oil on protein aggregation directly in prefilled syringes is the difficulties in reproducibly forming aggregates and particles and in detecting them. For example, in some unpublished cases, substantial particle formation has been noted immediately after syringe filling, whereas in other cases particles and aggregates have not been detected until after shipping and/or months of storage. When aggregation occurs during shipping, the potential contribution of agitation in combination with silicone oil must be taken into account. This is an important consideration because agitation alone is often sufficient to induce protein aggregation.14–16 However, to date there has not been a published study addressing the combined effects of the silicone oil and agitation on protein aggregation or on the effects of pharmaceutical excipients on silicone oil-induced aggregation of antibodies.
To address these issues, the current study employed an “accelerated degradation” strategy in which 1.5% w/v silicone oil emulsion was mixed with a monoclonal antibody formulation, and loss of monomeric protein from solution was measured during isothermal incubation, with and without agitation at 350 rpm. The extent of agitation (350 rpm) and the concentration of silicone oil (1.5% w/v or 15 mg) used in the study were higher than what products may typically experience. The selection of these parameters was to provide an accelerated condition and monitor aggregation within a reasonable time-frame.
In addition, the effect of excipients polysorbate 20 and sucrose on silicone oil- and agitation induced aggregation of the antibody in solution was examined using a concentration of 0.01% w/v polysorbate 20 and 0.3 M sucrose. Protein aggregation is governed by both conformational and colloidal stability of the molecule.17 To understand if silicone oil induced antibody aggregation showed similar dependence, the stability of the antibody under solution conditions of varying pH and ionic strength were investigated. The experiments used anti-streptavidin (anti-SA) IgG1 as a model monoclonal antibody.
Materials and Methods
Materials
Purified monoclonal antibody anti-SA IgG1 (purity > 97%, MW 142.2 KDa) was provided by Amgen Inc (Thousand Oaks, CA). The antibody was obtained at a stock concentration of 23.3 mg/mL in 10 mM sodium acetate and 5 % sorbitol, at pH 5.0. Silicone oil, medical grade (Dow Corning 360 fluid, 1000 cSt) was obtained from Dow Corning (Midland, MI). Sucrose was purchased from Pfanstiehl Laboratories (Waukegan IL). Polysorbate 20 was obtained from Croda (Croda Inc., UK). All other chemicals used were of reagent grade or higher.
Methods
Silicone oil emulsions
A stock silicone oil emulsion was prepared at a concentration of 2.0 % w/v by sonication (VWR 50T Ultrasonic system) for 15 min in an ice-water bath in each of the following formulations: 10 mM sodium acetate, pH 5.0 (A5 buffer); A5 buffer + 0.01% polysorbate 20; A5 buffer + 0.3 M sucrose; A5 buffer + 150 mM NaCl (A5NaCl buffer); 10 mM sodium phosphate, pH 7.4 (phosphate buffer); 10 mM sodium phosphate + 150 mM NaCl, pH 7.4 (PBS). The oil droplet size distribution of each emulsion was measured using a Nano ZS liquid particle system analyzer (Malvern Instruments Inc., MA).
Estimation of anti-SA IgG1 adsorbed to silicone oil droplets
To assess the initial amount of antibody adsorbed to silicone oil droplets, a filtration technique was used as described by Gabrielson.18 Anti-SA IgG1 (23.3 mg/mL) was dialyzed into the above formulations, and the antibody concentration in dialyzed samples was determined using an Agilent-8453 UV-visible spectrophotometer and an extinction coefficient of 1.58 (mL−1.mg−1.cm−1). Each formulation of the antibody was mixed with a 2.0 % w/v silicone oil emulsion prepared in the same formulation to obtain a final antibody concentration of 1.0 mg/mL and silicone oil concentration of 1.5 %. One mL samples were then transferred to 1.0 mL tuberculin syringes (BD Medical, NJ). The syringes were placed vertically (with the Luer fitting down) in a rack and allowed to stand for 5 minutes. This allowed sufficient upward movement of the oil droplets so that a small volume (~200 μl) of the sample at the bottom of the syringe could be filtered through a 0.02 μm syringe filter (Whatman Anotop 10) without excessive blockage by larger oil droplets. Previous studies have shown that this approach provides essentially complete rejection of silicone oil in the filtrate. 18
A separate syringe and filter was used for each sample replicate for each formulation tested. Control antibody formulations without silicone oil were prepared and treated identically. Protein concentration in the unfiltered samples and in the filtrate was measured using a Nanodrop ND 1000 spectrophotometer (Wilmington, DE). A buffer scan was acquired prior to the collection of protein spectra. The antibody samples were scanned directly without additional dilution and the protein concentration in each sample was calculated using absorbance at 280 nm. In samples containing silicone oil, the difference in antibody concentration between the filtrate and unfiltered sample in each solution reflects the amount of anti-SA IgG1 in association with silicone oil immediately upon mixing plus any loss of protein due to the filtration step.18 For control samples, the difference in these values indicate the amount of antibody lost specifically during filtration step. Therefore, the difference in protein levels in the filtrate for samples containing silicone oil and their respective control samples provides an estimate of the amount of protein in association with silicone oil.
An estimate of the mass of antibody needed to provide monolayer coverage of silicone oil droplets in the emulsion was calculated. Based on an average particle diameter of 5.0 μm (determined with the Malvern Zetasizer) and 200–230 million droplets per ml (determined with a Coulter counter) in a 1.5 % emulsion, the total silicone oil surface area in 1 ml of this emulsion was calculated. The average radius of the antibody was estimated to be 6.0 nm using a Malvern liquid particle system analyzer. From this radius, the cross-sectional area contribution from the antibody molecule was calculated. The random sequential adsorption (RSA) model 19 which predicts that the fractional surface occupancy at monolayer coverage is approximately 0.55 was used to calculate the available surface area for interaction of the antibody with silicone oil.
Effects of agitation, temperature, buffer and excipients on antibody monitored using incubation experiments
To determine the effects of formulation conditions on silicone oil- and agitation-induced aggregation of anti-SA IgG1, the antibody was incubated at 4 or 37°C for four weeks in the following formulations: A5 buffer, A5NaCl, phosphate buffer and PBS buffer. Anti-SA IgG1 (23.3 mg/mL) was initially dialyzed into the above solutions. The final antibody concentration in dialyzed samples was measured using UV-visible spectrophotometer. For formulations containing silicone oil, antibody in each formulation was mixed with appropriate volume of silicone oil emulsion (prepared in the same buffer) to a final protein concentration of 1 mg/mL and silicone oil concentration of 1.5 % w/v.
During preliminary experiments (data not shown), and in the current assessment of aggregation, maximum stability of the antibody against aggregation during agitation was observed in A5 buffer (data not shown). In an attempt to further improve protein stability against aggregation, A5 buffer was used. Anti-SA IgG1 (23.3 mg/mL) was dialyzed into A5 buffer containing 0.3 M sucrose. For the formulations containing surfactant after dialysis of the antibody in A5 buffer, freshly prepared 1.0% polysorbate 20 was added to the sample to a final polysorbate 20 concentration of 0.01%. Antibody concentration in the dialyzed samples was measured using UV absorbance at 280 nm. As described above, for antibody solutions containing silicone oil, the antibody in a given solution was mixed with appropriate volumes of silicone oil emulsion in the same formulation to a final protein concentration of 1 mg/mL and silicone oil concentration of 1.5 % w/v.
A 1.0 mL sample aliquot from each formulation was placed in a 3 cc glass vial providing approximately 2 mL of headspace. A separate vial was prepared for each of the triplicate samples analyzed at each time point. The samples were incubated without agitation or with agitation at 350 RPM in an orbital shaker (VWR DS 500). At each time point tested, the entire vial contents were transferred to polypropylene Eppendorf tubes and centrifuged for 20 min at 13000 × g. An aliquot (25.0 μl) of the supernatant was injected onto the SE-HPLC column (TSK-GEL G3000SWXL) and eluted in a mobile-phase consisting of 100 mM sodium phosphate and 300 mM sodium chloride (pH 7.0) at 0.6 mL/min. Absorbance at 280 nm was monitored and the level of soluble protein retained in the supernatant was quantified as previously described.20,21 The two species resolved by SEC were monomeric and dimeric anti-SA IgG1. Their individual masses were verified by online light scattering coupled with SEC analysis (data not shown). Unincubated samples that contained 2–2.5 % dimer was used a control.
Evaluation of secondary and tertiary structure of the protein
Secondary and tertiary structures of anti-SA IgG1 were studied using Jasco-810 spectropolarimeter. Secondary structure of the antibody in buffer alone and in the presence of 1.5% silicone oil in different buffers was examined by far-UV (180 nm – 260 nm) circular dichroism (CD) spectroscopy in a 1 mm pathlength cell using an antibody concentration of 1 mg/mL. Tertiary structure was examined with near-UV CD spectroscopy, and data between 250 nm to 350 nm were collected for 1 mg/mL antibody in a 1 cm path-length cell. Spectra were acquired at a scan speed of 20 nm/min with a data spacing of 1 nm, response time of 16-secs and a bandwidth of 2 nm. The spectra were collected immediately after preparation of samples.
Secondary structure of the antibody in solution (concentration = 15 mg/mL) and in precipitates formed during incubation were examined by infrared (IR) spectroscopy.20,21 Samples with precipitates were centrifuged to pellet the insoluble aggregates. The supernatant was carefully removed to retain only the precipitated protein in an Eppendorf tube. Buffer was added to resuspend the precipitated material in the buffer, and the sample was centrifuged and the procedure repeated three times to remove soluble protein prior to acquisition of IR spectra of the precipitated protein samples. For analysis of the soluble protein and the precipitate, the spectrum was initially converted to the absorbance signal followed by subtraction of the corresponding buffer spectrum and processing as previously described.22,23
Effect of silicone oil on thermal stability of the antibody
The effect of 1.5% silicone oil on the thermal stability of the antibody was assessed using a Microcal™ capillary DSC (Microcal LLC, MA). Anti-SA IgG1 was present at a final antibody concentration of 1 mg/mL in the following formulations: A5, A5NaCl, phosphate and PBS buffer. About 500 μl of sample was added to each of the wells of a 96-well micro-titer plate along with matched reference buffer. Samples were automatically loaded into the DSC. Data were acquired during heating between 25°C – 90°C at 1°C/min. The samples were cooled to 25°C and rescanned to evaluate the reversibility of the unfolding transition. Data collected were analyzed by subtraction of signal for the buffer sample from that for the antibody solution. A baseline was then fitted to the trace using the Origin software provided with the instrument. Apparent Tm’s were reported from the endothermic peak maximum.
The effect of silicone oil on the thermal stability of anti-SA IgG1 (0.5mg/mL) was assessed by UV spectroscopy. Spectra for the protein in each formulation were acquired against the respective protein-free formulation over the temperature range 10–90°C at 2°C increments. Samples were equilibrated for 1.5 min at each temperature prior to the spectral acquisition. Aggregation of the antibody was monitored by the change in optical density at 350 nm in different formulations.
Determination of osmotic second virial coefficient
Osmotic second virial coefficients (B22) for anti-SA IgG1 were determined as previously described,17 using a Brookhaven light scattering system from Brookhaven Instrument Corporation, equipped with a vertically polarized solid-state laser (wavelength = 667 nm), a BI-200SM goniometer, and a BI9000AT correlator. Scattering intensity at 90°was measured and used to calculate B22. In addition, scattering intensities at angles, 60° and 120° were measured to verify isotropic scattering from the antibody. The stock solution of anti-SA IgG1 was dialyzed extensively for two days at 4°C into the following solutions: A5 buffer, pH 5.0; A5NaCl, pH 5.0; phosphate, pH 7.4; PBS pH 7.4. Dialyzed antibody was diluted to seven different concentrations in the range between 0.8 to 5.0 mg/mL. To minimize scattering from dust, glass cuvettes used in the measurements were triple rinsed with 0.02 μm-filtered ultra pure water. Toluene (the reference standard), buffers and antibody solutions were filtered into the cuvette using a 0.1 μm cellulose acetate filter prior to each measurement. Antibody concentration in the samples used for light scattering experiments was determined spectrophotometrically. The refractive index increment (dn/dc) for the antibody solutions relative to the buffer was determined in a differential refractometer (Wyatt, Optilab). The protein refractive index increment measured at 25 °C in different solutions was used in the calculation of B22 values.17
Results
Silicone oil droplet size in emulsions
The oil-droplet size in the 2.0 % w/v silicone oil emulsion was measured immediately after preparation in different formulations. The average droplet diameter in all formulations tested ranged between 4 and 6 μm. In pre-filled syringes, silicone oil droplets may slough off into solution to form micro droplets. At the concentration of silicone oil used in the study, the antibody is presumably exposed to the same size range of silicone oil micro droplets but in higher amounts to accelerate particle formation. The apparent polydispersity of the droplet size distribution increased with time, indicating the emulsions were unstable and showing phase separation (data not shown). The effects of the protein or excipients on the emulsion stability were not assessed in this study. However it has been shown previously that sucrose and polysorbate 20 significantly affect silicone oil emulsion stability.18 Sucrose increased silicone oil coalescence rates. In contrast, polysorbate 20 slowed the rate of silicone oil droplet association and stabilized the emulsions, providing larger surface area with which the antibody could potentially interact.18
Analysis of anti-SA adsorption to silicone oil droplets
Filtration experiments were performed to assess the initial level of antibody in association with silicone oil immediately after mixing the oil and protein solution.18 To determine if the protein adsorbed to the filter, the change in antibody concentration in control samples prepared and filtered without silicone oil was measured for each solution (Table 1). The changes in antibody concentration in samples prepared with silicone oil upon filtration are shown in Table 2. The observed differences in the mean values of these two sets of measurements were statistically significant (p<0.05 at 95% confidence interval) in all solutions except phosphate and A5Sucrose.
Table 1.
Concentration (mg/mL) of anti-SA in different formulation before and after filtration *
| Formulation | Concn. Unfiltered (mg/mL) | Concn. In Aqueous Filtrate (mg/mL) | Difference in Concn. pre and post filtration (mg/mL)** |
|---|---|---|---|
| A5 | 1.02 ± 0.04 | 1.02 ± 0.04 | 0.01 ± 0.01 |
| A5NaCL | 1.00 ± 0.01 | 0.94 ± 0.03 | 0.06 ± 0.02 |
| Phosphate | 0.99 ± 0.02 | 0.95 ± 0.05 | 0.04 ± 0.02 |
| PBS | 1.02 ± 0.01 | 0.98 ± 0.03 | 0.04 ± 0.02 |
| A5 polysorbate20 | 0.99 ± 0.02 | 0.98 ± 0.01 | 0.01± 0.01 |
| A5 sucrose | 1.04 ± 0.03 | 0.99 ± 0.04 | 0.03 ± 0.01 |
The mean ± SD was calculated from triplicate set of samples each replicate prepared using different syringes and filter.
The mean ± SD was calculated from differences in concentration measured for each replicate for a given solution.
Table 2.
Anti-streptavidin silicone oil association tested using filtration experiments*
| Formulation | Anti-body concn. before filtration (mg/mL) | Anti-body concn. In Aqueous Filtrate (mg/mL) | Difference in Concn. pre and post filtration (mg/mL)** | Mass of antibody adsorbed to silicone oil in 1 mL protein formulation (mg)*** |
|---|---|---|---|---|
| A5 | 0.98 ± 0.00 | 0.89 ± 0.04 | 0.10 ± 0.02 | 0.09 ± 0.004 |
| A5NaCL | 1.00 ± 0.01 | 0.89 ± 0.03 | 0.11 ± 0.01 | 0.05 ± 0.003 |
| Phosphate | 0.99 ± 0.01 | 0.88 ± 0.05 | 0.11 ± 0.02 | 0.07 ± 0.002 |
| PBS | 1.04 ± 0.01 | 0.97 ± 0.01 | 0.09 ± 0.01 | 0.05 ± 0.003 |
| A5 polysorbate20 | 1.04 ± 0.04 | 0.97 ± 0.06 | 0.05 ±0.01 | 0.04 ± 0.003 |
| A5 sucrose | 1.01 ± 0.02 | 0.97 ± 0.07 | 0.04 ±0.01 | 0.01 ± 0.002 |
The mean ± SD was calculated from triplicate set of samples each replicate prepared using different syringes and filter.
The mean ± SD was calculated from differences in concentration measured for each replicate for a given solution.
This mass was calculated after accounting for protein loss in control samples during filtration.
This result showed that immediately after mixing, there were antibody molecules adsorbed to silicone oil droplets in four of the solutions tested: A5, A5polysorbate 20, A5NaCl and PBS. Comparing results for A5 buffer to A5 buffer with sucrose (A5sucrose) or polysorbate 20 (A5, A5polysorbate 20) showed that both excipients reduced the amount of antibody associated with silicone oil microdroplets.
Based on the RSA model, approximately 25 μg/mL of the antibody would be sufficient to provide monolayer coverage of the silicone oil droplet surface in these formulations with 1.5% silicone oil. For the different solution conditions tested, except A5 sucrose, the amount of antibody adsorbed to the silicone oil droplets (Table 2) represented at least monolayer coverage of the oil droplet surface in the emulsion.
Initial assessment of agitation on silicone oil-induced loss of monomer
To assess the effects of agitation on loss of monomer in the presence of 1.5% silicone oil, the change in level of monomer was determined as a function of agitation rpm. After 5 days at 37°C, in the absence of agitation or at 200 rpm, monomer levels remained unchanged. However, at 350 and 450 rpm, a loss of monomer was observed and therefore 350 rpm was used in all subsequent agitation experiments (Fig. 1).
Figure 1.
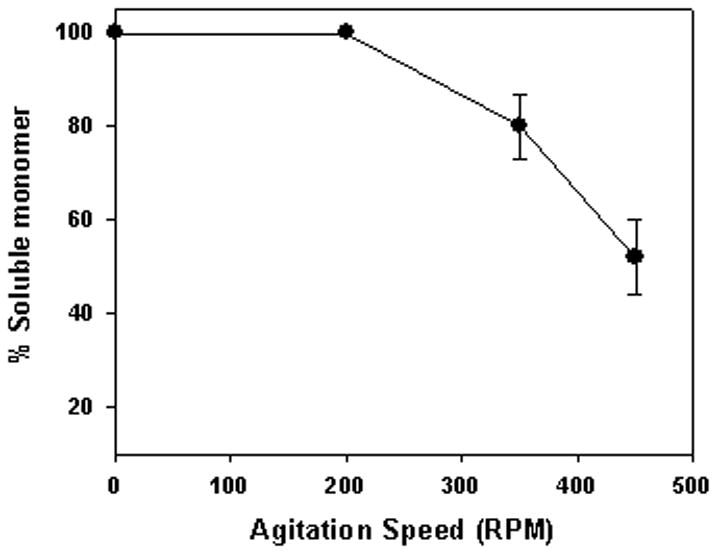
Effect of agitation on antibody aggregation in the presence of silicone oil. Shown in figure are unaggregated antibody levels after five days at 37°C in the presence of 1.5 % w/v silicone oil (A5 buffer) during agitation at different speeds. Data points are mean ± SD for triplicate samples.
Effect of pH, buffer and NaCl on agitation/silicone oil-induced aggregation
In the absence of agitation, during 4 weeks of incubation at both 4 and 37°C anti-SA IgG1 showed no monomer loss in any of the solutions tested, irrespective of the presence or absence of silicone oil (data not shown). The level of anti-SA IgG1 dimer present in the samples (approximately 2–3%) did not change during incubation (data not shown). Analysis with analytical ultracentrifugation confirmed that the two soluble species in samples were monomer and dimer (data not shown).
In A5 buffer without silicone oil, the monomer level did not decrease during incubation with agitation at either 4 or 37°C (Fig. 2A, C). However, in the presence of 1.5% silicone oil at 4 and 37°C, monomer levels in anti-SA IgG1, decreased as a function of time (Fig. 2B, D). At the end of a 4-week incubation period, only 40% monomer remained in solution. The earliest manifestation of aggregation during agitation was the appearance of small thread-like particles, and at later time points larger visible particles were present. Samples with large visible particles showed the least soluble protein from SEC analysis, suggesting that the visible particles contained protein, as confirmed by infrared spectroscopy (see below).
Figure 2.
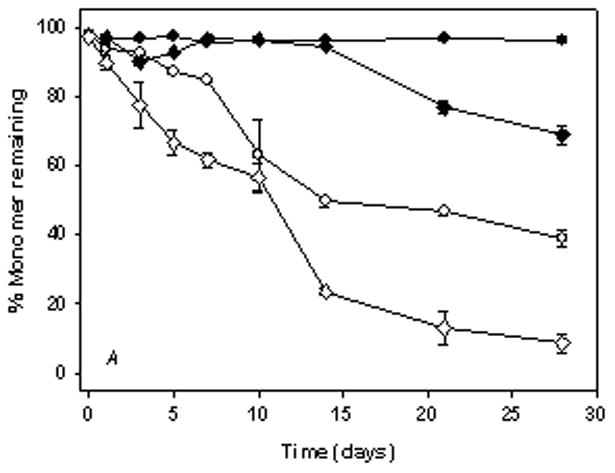

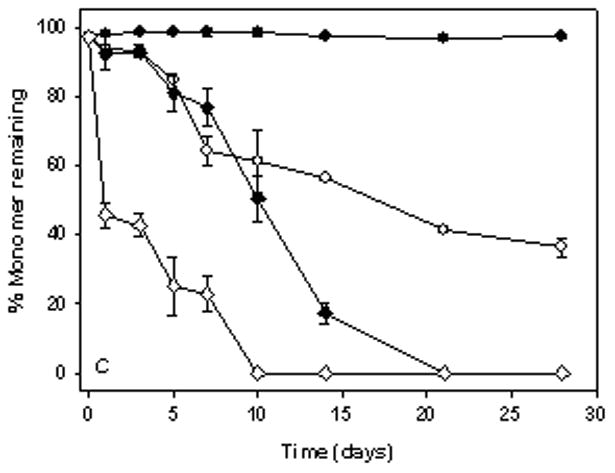

% Monomer remaining in anti-SA IgG1 samples during agitation at 350 rpm. Panels A & B represent anti-SA samples at 4°C. Panels C & D represent anti-SA samples at 37°C. (●, open symbol), anti-SA IgG1 in A5 buffer; (◆, open symbol), anti-SA IgG1 in A5NaCl; (■, open symbol), anti-SA in phosphate buffer; (▲, open symbol), anti-SA IgG1 in PBS. Closed symbols and open symbols represent samples in the absence and presence of silicone oil respectively. Data points in all panels represent mean ± SD for triplicate set of samples. For some time points shown, error bars are smaller than the symbols provided. Monomer loss was not observed during static incubation in all formulations (data not shown).
In A5NaCl buffer without silicone oil, the protein aggregated during incubation with agitation at 4°C, with about 70% monomer remaining after 4 weeks of incubation (Fig. 2A, C). During agitation in the presence of 1.5% silicone oil, the rate of loss of monomer increased substantially, resulting in almost complete loss at the end of the 4-week study (Fig. 2B). At 37°C during incubation with agitation in A5NaCl, the extent of monomer loss was substantially increased relative to that noted at 4°C both in buffer alone and in the presence of silicone oil and showed complete loss of monomer by the end of the study (Fig. 2C, D).
At both 4 and 37°C, agitation of samples incubated in phosphate buffer (pH 7.4) and PBS (pH 7.4) caused a substantial increase in monomer loss compared to results observed in A5 and A5NaCl buffer (Fig. 2). In phosphate buffer and PBS, 1.5% silicone oil further accelerated the extent of monomer loss during incubation with agitation at both 4 and 37°C.
Effect of polysorbate 20 and sucrose on agitation/silicone oil-induced aggregation
In the absence of agitation, during 4 weeks of incubation at both 4 and 37°C, there was complete recovery of monomeric antibody in A5 buffer alone, A5 buffer with 0.01% polysorbate 20 or A5 buffer with 0.3M sucrose, in the presence and absence of 1.5% silicone oil (data not shown). During incubation with agitation at 4 and 37°C, in A5 buffer containing polysorbate 20 the monomer level remained unchanged, both in the absence or presence of silicone oil (Fig. 3). In A5 buffer with 0.3M sucrose, monomer loss was not observed during incubation with agitation in the absence of silicone oil (Fig. 3). With 1.5% silicone oil, 0.3M sucrose partially inhibited loss in monomeric antibody during incubation with agitation.
Figure 3.

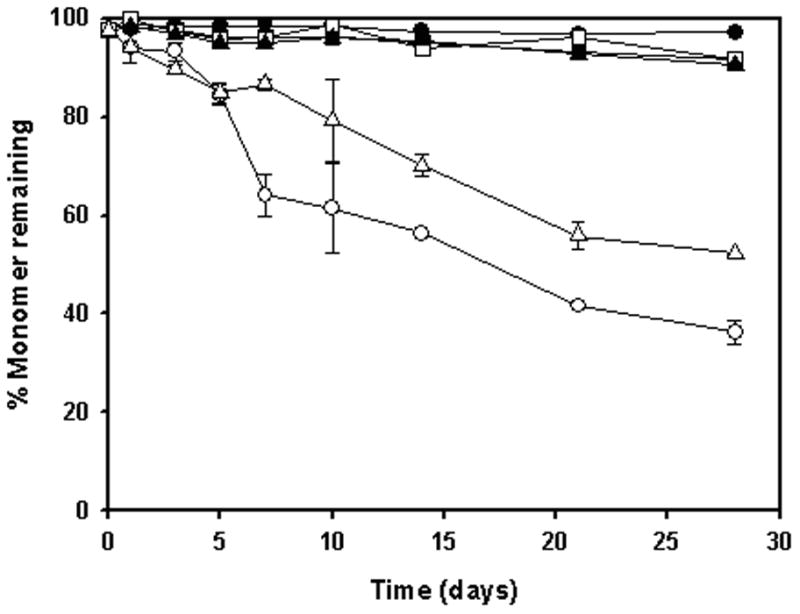
% Monomer remaining during incubation of anti-SA IgG1 with silicone oil in A5 buffer in the presence of excipients 0.01% polysorbate 20 and 0.3 M sucrose. Samples were agitated at 350 rpm. Panels A & B represent samples at 4°C & 37°C respectively. (●, open symbol) anti-SA IgG1; (■, open symbol), anti-SA IgG1 + polysorbate 20; (▲, open symbol), anti-SA IgG1 + sucrose. Closed symbols and open symbols represent samples in the absence and presence of silicone oil respectively. Data points are mean ± SD for triplicate samples. For some time points shown, error bars are smaller than the symbols provided. Monomer loss was not observed during static incubation in all formulations (data not shown).
Effect of silicone oil on the secondary and tertiary structures of anti-SA IgG1
The secondary structure of anti-SA IgG1 in the four buffers (A5, A5NaCl, phosphate and PBS) was examined by far UV circular dichroism (CD) at 4 and 37°C, in the absence or presence of 1.5% silicone oil (Fig. 4). Substantial differences in the far-UV CD spectra were not observed. To corroborate this result, the secondary structure of the antibody in the four buffers, with and without 1.5% silicone oil was studied with infrared spectroscopy. There were no detectable differences in the spectra for the protein under the different conditions (data not shown). These results were expected considering that only a small fraction (i.e., less than about 10%) of the antibody molecules in solution would be adsorbed with the silicone oil droplets (Table 2), making any silicone oil-induced structural change due to adsorption difficult to measure.
Figure 4.


Secondary structure of anti-SA as monitored by far UV-CD in the presence or absence of 1.5% silicone oil under the following solution conditions: (●), A5 buffer, pH 5.0; (■), A5NaCL, pH 5.0; (▲), phosphate, pH 7.4; (◆), PBS pH 7.4. Open symbols were without silicone oil; closed symbols were with silicone oil. For each solution condition, the spectrum shown is an average of two spectra acquired for the protein.
The effect of 1.5% silicone oil on tertiary structure of anti-SA IgG1 was studied with near-UV CD spectroscopy (Fig. 5). In all four buffers studied, the spectrum for the protein in the presence of 1.5% silicone oil showed slightly lower ellipticity than that for the spectrum of protein in the respective buffer without silicone oil. This minor spectral change was noted at both 4 and 37°C. Because only a small fraction (ca. 10%) of the protein molecules were adsorbed to the silicone oil droplets, these results suggest perturbation of the tertiary structure of the protein molecules absorbed at the oil-water interface.
Figure 5.
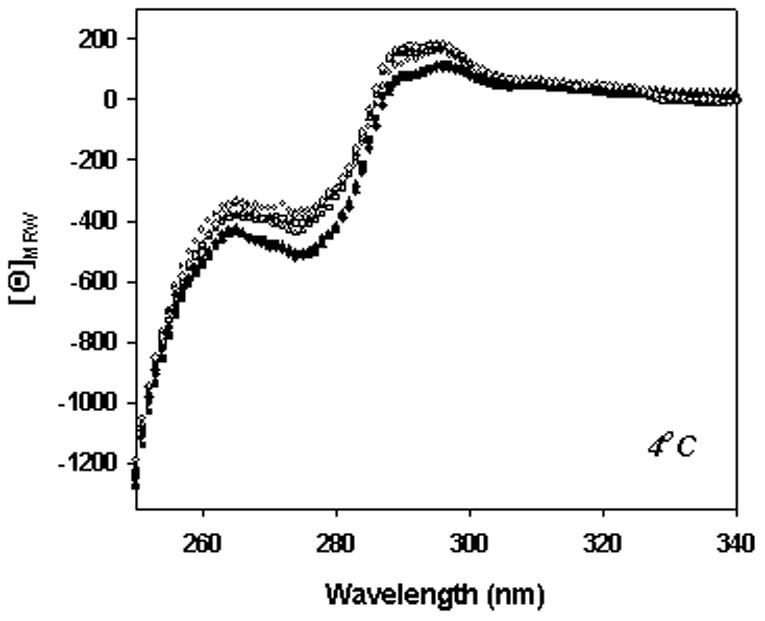

Tertiary structure of anti-SA as monitored using near UV-CD in the presence or absence of 1.5% silicone oil under the following solution conditions: (●), A5, pH 5.0; (■), A5NaCL, pH 5.0; (▲), phosphate, pH 7.4; (◆), PBS, pH 7.4. Open symbols were without silicone oil; closed symbols were with silicone oil. For each solution condition, the spectrum shown is an average of two spectra acquired for the protein.
Secondary structure of the protein in insoluble precipitates formed during agitation
The secondary structure of the antibody in precipitates formed in various buffers during agitation, with and without 1.5% silicone oil, was studied by infrared spectroscopy. Representative spectra of native and precipitated anti-SA IgG1 are shown in Fig. 6. The precipitate spectra shown were collected after 4 week incubation in each formulation. Under native conditions, the antibody contained predominantly intramolecular β-sheet structure as indicated by the intense infrared band at 1638 cm−1.22 The structure of the antibody in precipitates exhibited perturbed secondary structure as shown by the band at ca. 1618 cm−1, characteristic of intermolecular β-sheet (Fig. 6).22 Structure of the precipitated antibody was perturbed to the same extent over time following analysis of samples from 1, 2, 3 or 4 week incubation in the presence or absence of silicone oil (data not shown). The extent of perturbation of antibody structure in precipitates was temperature dependent; a greater degree of structural perturbation was noted at 37°C relative to 4°C (Fig. 6). Furthermore at 37°C, the structure of the antibody in aggregate formed during agitation without silicone oil was similar to antibody aggregate during incubation with silicone oil i.e. significant decrease in native protein band intensity at 1638 cm−1 and formation of intermolecular β-sheet at ~ 1618 cm−1. The large extent of structural perturbation noted at 37°C made it difficult to distinguish any effect formulation condition may have on aggregate structure.
Figure 6.
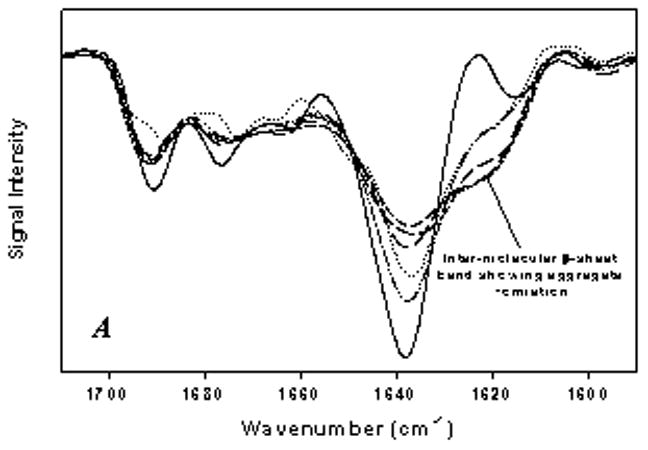

Second derivative IR spectra of anti-SA IgG1 in aggregates during agitation. A) Aggregate formed during incubation in A5 and A5NaCL buffers: dash-dot-dot, anti-SA + silicone oil in A5 buffer at 4°C; long dashes, anti-SA + silicone oil in A5 buffer at 37°C; medium dashes, anti-SA in A5NaCL buffer at 37°C; dotted, anti-SA + silicone oil in A5NaCL buffer at 4°C; small dashes, anti-SA + silicone oil in A5NaCL buffer at 37°C. B) Aggregate formed during incubation in phosphate buffer (the aggregate structure was similar in PBS buffer): dotted line, anti-SA 4°C; small dashes, anti-SA + silicone oil 4°C; medium dashes, anti-SA 37°C; dash-dot-dot, anti-SA + silicone oil 37°C. Solid line in both panels represent liquid anti-SA control sample.
Following 4°C incubation, the structure of the antibody in precipitate showed at least partial retention of the native β-sheet structure as evidenced by the band for the native protein at 1638 cm−1. At 4°C, aggregate induced during agitation of the antibody with silicone oil showed some differences from the aggregates induced when antibody was agitated without silicone oil. The extent of structural perturbation at 4°C was more pronounced when anti-SA was agitated with silicone oil than in the absence of silicone oil (Fig. 6). It should be noted that aggregation was not observed when antibody (no silicone oil) was agitated in A5 or A5NaCl buffer at 4°C, hence data not shown in figure.
Effect of solution conditions on osmotic second virial coefficient (B22)
The rate of loss of monomeric antibody during agitation was strongly influenced by pH and buffer type. Previous work by Chi et al., 17 demonstrated that the energetics of intermolecular interactions, which collectively determine the protein’s colloidal stability, can modulate protein aggregation rates in solution. To obtain insight into the role of colloidal stability on anti-SA aggregation, osmotic second virial coefficients (B22) values for the antibody were determined in the different buffer systems at 25 and 37°C (Tables 3 and 4). From the refractive index (RI) increment calculated for the antibody in each solution condition, mass averaged molecular weights were extrapolated from the static light scattering data (Tables 3 and 4). In most cases, the estimated molecular weights calculated were close to the expected monomeric molecular weight of the antibody (142,159 Da). Light scattering measurements to estimate B22 values could not be carried out at 4°C due to problems with water condensation on the sample cells, which contributed to the light scattering. Also, because of light scattering from droplets, B22 values could not be determined in the presence of silicone oil.
Table 3.
Summary of results from static light scattering experiments to estimate the B22-values at 25°C
| Solution Condition | pH | Refractive Index increment dn/dc (mL/g) | B22 × 104 (cm3 mol/g2) | Extrapolated Molecular Weight (KDa) |
|---|---|---|---|---|
| A5 | 5.0 | 0.186 | −0.7 ± 0.4 | 136.0 ± 6.0 |
| A5NaCl | 5.0 | 0.196 | −1.3 ± 0.1 | 147.0 ± 4.0 |
| Phosphate | 7.4 | 0.188 | −1.8 ± 0.2 | 139.0 ± 4.0 |
| PBS | 7.4 | 0.197 | −1.9 ± 0.9 | 148.0 ± 7.0 |
The standard deviation provided were calculated for duplicate set of samples
Table 4.
Summary of results from static light scattering experiments to estimate the B22-values at 37°C*
| Solution Condition | pH | Refractive Index increment dn/dc** (mL/g) | B22 × 104 (cm3mol/g2) | Extrapolated Molecular Weight (KDa) |
|---|---|---|---|---|
| A5 | 5.0 | 0.186 | −1.4 ± 0.3 | 146.0 ± 5.0 |
| A5NaCl | 5.0 | 0.196 | −2.5 ± 0.4 | 128.0 ± 5.0 |
| Phosphate | 7.4 | 0.188 | −2.9 ± 0.2 | 123.0 ± 9.0 |
| PBS | 7.4 | 0.197 | −2.3 ± 0.7 | 135.0 ± 6.0 |
The standard deviation provided were calculated for duplicate set of samples
The refractive indices were the values estimated at 25°C
Positive values of B22 indicate repulsive interaction between protein molecules in solution and negative B22 values represent attractive interactions between antibody molecules.24 B22 values for anti-SA IgG1 obtained in all four buffers were negative indicating that protein-protein interactions were attractive. At 37°C, the B22 values for the protein in each buffer were slightly more negative than the respective value determined at 25°C. Increasing ionic strength and incubation at a solution pH close to the pI (8.7) of the antibody resulted in increased anti-SA monomer loss during agitation with and without silicone oil, and corresponding B22 values for the antibody in phosphate/PBS buffers at pH 7.4 were slightly more negative than that measured in A5 at pH 5.0. The addition of 150 mM NaCl at pH 5.0 (A5 buffer) modestly decreased B22. In solutions where the antibody was colloidally least stable, an increased rate of aggregation during agitation, was observed (Fig. 2) in the absence and presence of 1.5% silicone oil. This suggests that the colloidal stability of the antibody is an important factor in modulating silicone oil and agitation induced aggregation of anti-SA.
Effect of silicone oil on the thermal stability of anti-SA IgG1
To assess the effects of silicone oil on the thermal stability of anti-SA IgG1, apparent Tm values for the protein in different formulations were measured by DSC. There were three distinct endothermic events recorded for the protein under most of the solution conditions. Under all conditions tested by DSC, thermal unfolding was irreversible presumably due to aggregation of the antibody. Therefore the calculated values of Tm’s were only the apparent Tm of the antibody in a given solution condition (Table 5). Although there were some minor differences in Tm values for the protein in different solution conditions, there was no observed correlation of apparent Tm values with the rate of monomer loss during the incubation experiments (Figs. 2 and 3, Table 5). Also, no significant effect of silicone oil on the apparent Tm’s was observed. This was not unexpected since only < 10% of the protein was adsorbed to silicone oil.
Table 5.
Apparent melting temperatures (Tm) for anti-SA obtained from DSC thermal scans in different formulations
| Formulation | pH | Tm1 (°C) | Tm2 (°C) | Tm3 (°C) |
|---|---|---|---|---|
| A5 | 5.0 | 69.6 ± 0.1 | 75.3 ± 0.4 | 82.7 ± 0.1 |
| A5, 1.5% Silicone Oil | 5.0 | 69.4 ± 0.1 | 75.2 ± 0.2 | 82.0 ± 0.1 |
| A5, 0.01% polysorbate 20 | 5.0 | 70.1 ± 0.2 | ----- | 82.3 ± 0.4 |
| A5, 0.01% polysorbate 20, 1.5% silicone oil | 5.0 | 70.2 ± 0.3 | ----- | 82.1 ± 0.3 |
| A5, 0.3 M sucrose | 5.0 | 71.3 ± 0.1 | ----- | 83.6 ± 0.5 |
| A5, 0.3 M sucrose, 1.5% silicone oil | 5.0 | 71.3 ± 0.4 | ----- | 83.7 ± 0.6 |
| A5NaCl | 5.0 | 66.6 ± 0.5 | 74.4 ± 0.4 | 81.1 ± 0.2 |
| A5NaCl, 1.5% Silicone Oil | 5.0 | 66.1 ± 0.1 | 73.9 ± 0.1 | 80.6 ± 0.1 |
| Phosphate | 7.4 | 72.3 ± 0.3 | 77.9 ± 0.1 | 82.4 ± 0.3 |
| Phosphate, 1.5% Silicone Oil | 7.4 | 72.3 ± 0.3 | ----- | 80.3 ± 0.3 |
| PBS | 7.4 | 71.3 ± 0.1 | 77.1 ± 0.1 | 82.1 ± 0.1 |
| PBS, 1.5% Silicone Oil | 7.4 | 71.2 ± 0.2 | 77.2 ± 0.1 | 82.2 ± 0.2 |
The standard deviation provided were calculated for duplicate set of samples
The turbidity (OD350) was monitored to assess the effects of silicone oil on heating-induced aggregation of anti-SA IgG (Fig. 7)., Higher OD values were measured during heating in A5 buffer with NaCl, phosphate buffer and PBS relative to results in A5 buffer; consistent with the more rapid loss of monomer noted in these buffers during the isothermal incubation studies. However, for all solutions tested, the temperature at which the initial increase in optical density was observed was not affected by silicone oil. Additionally, the increase in turbidity with temperature also proceeded to the same extent in the presence or absence of silicone oil. Thus, silicone oil affects the rate of aggregation but did not affect the thermal stability of anti-SA IgG as assessed by turbidity.
Figure 7.


Comparison of the change in OD of anti-SA at 350 nm in different solution as monitored by UV-visible spectroscopy. A) anti-SA in A5 buffer with excipients polysorbate 20 and sucrose. (●), A5 buffer; (▼;), A5 buffer with 0.01% polysorbate 20; (●), A5 buffer with 0.3 M sucrose. B) anti-SA in A5NaCL: (●), A5 buffer; (■), A5NaCL buffer. C) anti- SA in phosphate buffer with and without NaCL: (▲), phosphate buffer; (◆); PBS buffer. Open and closed symbols represent samples with 1.5% and without silicone oil respectively.
Discussion
Silicone oil-induced aggregation in therapeutic protein formulations can pose a serious challenge to product development and commercialization. It has been suggested that problems associated with silicone oil-containing syringes may be overcome by replacement with silicone oil-free syringes or by substituting silicone oil with other substances.9 Unfortunately, the suggested replacements for silicone oil such as Teflon® may also cause problems. The hydrophobic surfaces of Teflon® have also been implicated in causing protein aggregation due to adsorption of protein molecules at the Teflon®-water interface.25 Therefore, although alternatives to silicone oil are being explored, work to understand how silicone oil induces protein aggregation is critical.
Synergistic effects of silicone oil and agitation in promoting anti-SA IgG aggregation
Agitation can induce protein aggregation during shipping or handling, due to protein adsorption and structural perturbation at the air-liquid interface.14 As demonstrated in the current study, silicone oil greatly enhanced the loss of soluble monomeric protein during agitation compared to agitation alone in A5 buffer. Furthermore, silicone oil greatly increased monomer loss during agitation in A5NaCl, phosphate and PBS buffers. The combination of agitation and silicone oil operated synergistically to stimulate loss of monomeric anti-SA IgG.
Liquid formulation processesing steps such as manufacturing, shipping and handling could repeatedly expose the protein to denaturing surfaces such as air-liquid and solid-liquid surfaces.16 Agitation increases the air-water interfacial area available for adsorption of proteins, leading to structural perturbations.16 In this study, agitation at low speeds did not cause aggregation in the presence of silicone oil in A5 buffer, but at higher agitation speeds monomer loss was accelerated in the presence of silicone oil. This is presumably due to the increased rate of air-water interface at higher rpm’s. Though shaking at 350 rpm may be an accelerated condition for an antibody formulation in vial, we consider this to effectively mimic the real world transport as it causes introduction of air bubble into solution in vial as found in pre-filled syringes.
The filtration experiments indicated that the absorption of the antibody to the oil-liquid interface led to at least monolayer coverage by the protein. Although the antibody samples showed only minor changes in near-UV CD spectra with silicone oil, it should be noted that the fraction of molecules in association with silicone oil is small. Hence, even if antibody molecules adsorbed to the oil-liquid interface had substantial tertiary structural perturbation, our ability to detect these perturbations would be offset by the much larger fraction of native protein molecules in the bulk solution.
Protein structure can be perturbed by adsorption to the air-water interface and according to the results of this study to the silicone oil-water interface. Thus, with both interfaces present the population of protein molecules with perturbed structure will be increased, relative to that in the presence of either interface alone. Agitation can affect transport of protein molecules and silicone oil droplets, as well as alter the air-water, silicone oil-water, silicone oil-air-water interfacial area present. Although it is not clear how these and other factors might work in concert to stimulate protein aggregation, it is practically important to consider the synergistic effects of agitation and silicone oil on protein aggregation during formulation development. The role of air-water interface and agitation in this process may also explain similar observations for protein drug product stored as well as transported in container closures involving silicone oil. Therefore, mere silicone oil spiking studies during formulation development may not adequately determine the sensitivity of the therapeutic protein to particle formation. Rather there is a need to do simulated or actual transport studies with vials/pre-filled syringes that involve the entrainment of air-interface within the solution to assess stability of formulation candidates in the presence of silicone oil.
Roles of conformational and colloidal stability
Anti-SA aggregation during agitation was strongly modulated by solution pH and NaCl and this effect was exaggerated in the presence of silicone oil. Across the four buffers tested, there were minor changes in the protein’s conformation and in apparent Tm values. There were measurable differences in colloidal stability of the protein in the different buffers, although all of them were negative and indicative of attractive intermolecular interactions24,26,27. The B22-values were most negative in formulations where the antibody was least stable during agitation, i.e. at pH close to the pI of the antibody and with increased ionic strength. Thus, it appears that an important factor governing aggregation rate under these experimental conditions is the energetics of intermolecular protein interactions. From a practical standpoint, these results show the importance of optimizing solution pH and ionic strength to reduce agitation- and silicone oil-induced protein aggregation.
Prior research by Jones et al. showed that silicone oil stimulated protein aggregation during incubation at 45°C, but did not measurably affect thermal transitions measured by CD spectroscopy. We also found that silicone oil did not affect the apparent Tm-values for the antibody under any of the solution conditions tested. Further, the Tm-values measured for the antibody showed no correlation to the rate of aggregation during isothermal incubation with silicone oil. These results argue against a global destabilization of the antibody by silicone oil and instead point to the important role in aggregation played by a small fraction of the protein population adsorbed to the oil-water interface.
Effects of excipients on aggregation
Polysorbate 20 completely inhibited silicone oil-induced loss of monomeric antibody during agitation in A5 buffer. There are several known mechanisms for protein stabilization by surfactants.16 Typically the predominant mechanism is competition with protein for adsorption to air-water interface.14, 15 In the current context, we speculate that at the concentration used (0.01%), polysorbate 20 may compete with the protein molecules for adsorption to both the oil-water, air-water and oil-air-water interfaces. Prevention of protein adsorption at these interfaces concomitantly prevents the putative structural perturbations at the interfaces, which in turn may be responsible for the observed decreased aggregation.
Sucrose is widely used as a stabilizer of the native protein conformation in aqueous solution and can minimize the population of structurally perturbed protein species in solution.28 As demonstrated sucrose only partially inhibited silicone oil-induced aggregation of the antibody during agitation. In at least one case we have observed increased protein aggregation in the presence of sucrose during agitation (Chou et al.; unpublished observation). Like other preferentially excluded co solutes, sucrose increases surface tension of water.29 The increased surface tension in the presence of sucrose could facilitate protein interaction with the air-water interface to foster aggregation during agitation. Furthermore, a recent study by Gabrielson et al., reported that sucrose enhanced the rate of silicone oil droplet coalescence and decreased oil-water interfacial area.18 Thus, with sucrose, both its effects on protein conformational stability and silicone oil emulsion stability may be responsible for inhibition of silicone oil-induced aggregation of anti-SA IgG1.
Acknowledgments
We are thankful to Dr. Songpon Deechongkit for help with the AUC and Branden Salinas for help with the light scattering experiments. This work was supported by grants from NIH (5R01 EB006006) and Amgen Inc.
Abbreviations
- Anti-SA
anti-streptavidin IgG1
- A5 Buffer
10 mM sodium acetate, pH 5.0
- A5NaCl
10 mM sodium acetate, 150 mM sodium chloride, pH 5.0
- Phosphate
10 mM sodium phosphate, pH 7.4
- PBS
10 mM sodium phosphate, 150 mM sodium chloride, pH 7.4
- SE-HPLC
size-exclusion high performance liquid chromatography
- CD
circular dichroism
- IR
infrared
References
- 1.Chi EY, Weickmann J, Carpenter JF, Manning MC, Randolph TW. Heterogeneous nucleation-controlled particulate formation of recombinant human platelet-activating factor acetylhydrolase in pharmaceutical formulation. Journal of pharmaceutical sciences. 2005;94(2):256–274. doi: 10.1002/jps.20237. [DOI] [PubMed] [Google Scholar]
- 2.Rosenberg AS. Effects of protein aggregates: an immunologic perspective. The AAPS journal. 2006;8(3):E501–507. doi: 10.1208/aapsj080359. [DOI] [PMC free article] [PubMed] [Google Scholar]
- 3.Baldwin RN. Contamination of insulin by silicone oil: a potential hazard of plastic insulin syringes. Diabet Med. 1988;5(8):789–790. doi: 10.1111/j.1464-5491.1988.tb01109.x. [DOI] [PubMed] [Google Scholar]
- 4.Chantelau E. Silicone oil contamination of insulin. Diabet Med. 1989;6(3):278. doi: 10.1111/j.1464-5491.1989.tb01162.x. [DOI] [PubMed] [Google Scholar]
- 5.Jones LS, Kaufmann A, Middaugh CR. Silicone oil induced aggregation of proteins. Journal of pharmaceutical sciences. 2005;94(4):918–927. doi: 10.1002/jps.20321. [DOI] [PubMed] [Google Scholar]
- 6.Smith EJea. Siliconization of parenteral packaging components. J Parenteral Sci Technology. 1988;42(S1–S13) [Google Scholar]
- 7.Rykke M, Rolla G. Effect of silicone oil on protein adsorption to hydroxyapatite in vitro and on pellicle formation in vivo. Scandinavian journal of dental research. 1990;98(5):401–411. doi: 10.1111/j.1600-0722.1990.tb00991.x. [DOI] [PubMed] [Google Scholar]
- 8.Chantelau EA, Berger M. Pollution of insulin with silicone oil, a hazard of disposable plastic syringes. Lancet. 1985;1(8443):1459. doi: 10.1016/s0140-6736(85)91892-6. [DOI] [PubMed] [Google Scholar]
- 9.Chantelau E, Berger M, Bohlken B. Silicone oil released from disposable insulin syringes. Diabetes care. 1986;9(6):672–673. doi: 10.2337/diacare.9.6.672. [DOI] [PubMed] [Google Scholar]
- 10.Bernstein RK. Clouding and deactivation of clear (regular) human insulin: association with silicone oil from disposable syringes? Diabetes care. 1987;10(6):786–787. doi: 10.2337/diacare.10.6.786. [DOI] [PubMed] [Google Scholar]
- 11.Baker M. Upping the ante on antibodies. Nature biotechnology. 2005;23(9):1065–1072. doi: 10.1038/nbt0905-1065. [DOI] [PubMed] [Google Scholar]
- 12.Reichert JM, Rosensweig CJ, Faden LB, Dewitz MC. Monoclonal antibody successes in the clinic. Nature biotechnology. 2005;23(9):1073–1078. doi: 10.1038/nbt0905-1073. [DOI] [PubMed] [Google Scholar]
- 13.Stockwin LH, Holmes S. Antibodies as therapeutic agents: vive la renaissance! Expert opinion on biological therapy. 2003;3(7):1133–1152. doi: 10.1517/14712598.3.7.1133. [DOI] [PubMed] [Google Scholar]
- 14.Bam NB, Cleland JL, Yang J, Manning MC, Carpenter JF, Kelley RF, Randolph TW. Tween protects recombinant human growth hormone against agitation-induced damage via hydrophobic interactions. Journal of pharmaceutical sciences. 1998;87(12):1554–1559. doi: 10.1021/js980175v. [DOI] [PubMed] [Google Scholar]
- 15.Kreilgaard L, Jones LS, Randolph TW, Frokjaer S, Flink JM, Manning MC, Carpenter JF. Effect of Tween 20 on freeze-thawing- and agitation-induced aggregation of recombinant human factor XIII. Journal of pharmaceutical sciences. 1998;87(12):1597–1603. doi: 10.1021/js980126i. [DOI] [PubMed] [Google Scholar]
- 16.Chou DK, Krishnamurthy R, Randolph TW, Carpenter JF, Manning MC. Effects of Tween 20 and Tween 80 on the stability of Albutropin during agitation. Journal of pharmaceutical sciences. 2005;94(6):1368–1381. doi: 10.1002/jps.20365. [DOI] [PubMed] [Google Scholar]
- 17.Chi EY, Krishnan S, Kendrick BS, Chang BS, Carpenter JF, Randolph TW. Roles of conformational stability and colloidal stability in the aggregation of recombinant human granulocyte colony-stimulating factor. Protein Sci. 2003;12(5):903–913. doi: 10.1110/ps.0235703. [DOI] [PMC free article] [PubMed] [Google Scholar]
- 18.Gabrielson J. Irreversible association of monoclonal antibody with silicone oil in aqueous formulation containing sucrose and surfactants. In Monoclonal antibody aggregation in therapeutic formulation: size & shape analysis. Ph.D Thesis. 2006:55–85. [Google Scholar]
- 19.Evans JW. Random and Sequential Cooperative Adsorption. Reviews of Modern Physics. 1993;65(4):1281–1329. [Google Scholar]
- 20.Krishnan S, Chi EY, Webb JN, Chang BS, Shan D, Goldenberg M, Manning MC, Randolph TW, Carpenter JF. Aggregation of granulocyte colony stimulating factor under physiological conditions: characterization and thermodynamic inhibition. Biochemistry. 2002;41(20):6422–6431. doi: 10.1021/bi012006m. [DOI] [PubMed] [Google Scholar]
- 21.Zhang Y, Roy S, Jones LS, Krishnan S, Kerwin BA, Chang BS, Manning MC, Randolph TW, Carpenter JF. Mechanism for benzyl alcohol-induced aggregation of recombinant human interleukin-1 receptor antagonist in aqueous solution. Journal of pharmaceutical sciences. 2004;93(12):3076–3089. doi: 10.1002/jps.20219. [DOI] [PubMed] [Google Scholar]
- 22.Dong A, Huang P, Caughey WS. Protein secondary structures in water from second-derivative amide I infrared spectra. Biochemistry. 1990;29(13):3303–3308. doi: 10.1021/bi00465a022. [DOI] [PubMed] [Google Scholar]
- 23.Dong A, Caughey WS. Infrared methods for study of hemoglobin reactions and structures. Methods in enzymology. 1994;232:139–175. doi: 10.1016/0076-6879(94)32047-0. [DOI] [PubMed] [Google Scholar]
- 24.George A, Wilson WW. Predicting protein crystallization from a dilute solution property. Acta crystallographica. 1994;50(Pt 4):361–365. doi: 10.1107/S0907444994001216. [DOI] [PubMed] [Google Scholar]
- 25.Sluzky V, Tamada JA, Klibanov AM, Langer R. Kinetics of insulin aggregation in aqueous solutions upon agitation in the presence of hydrophobic surfaces. Proceedings of the National Academy of Sciences of the United States of America. 1991;88(21):9377–9381. doi: 10.1073/pnas.88.21.9377. [DOI] [PMC free article] [PubMed] [Google Scholar]
- 26.Chi EY, Krishnan S, Randolph TW, Carpenter JF. Physical stability of proteins in aqueous solution: mechanism and driving forces in nonnative protein aggregation. Pharmaceutical research. 2003;20(9):1325–1336. doi: 10.1023/a:1025771421906. [DOI] [PubMed] [Google Scholar]
- 27.George ACY, Guo B, Arabshahi A, Cai Z, Wilson WW. Second virial coefficients as predictor in protein crystal growth. Methods in enzymology. 1997;276:100–110. doi: 10.1016/S0076-6879(97)76052-X. [DOI] [PubMed] [Google Scholar]
- 28.Kendrick BS, Chang BS, Arakawa T, Peterson B, Randolph TW, Manning MC, Carpenter JF. Preferential exclusion of sucrose from recombinant interleukin-1 receptor antagonist: role in restricted conformational mobility and compaction of native state. Proceedings of the National Academy of Sciences of the United States of America. 1997;94(22):11917–11922. doi: 10.1073/pnas.94.22.11917. [DOI] [PMC free article] [PubMed] [Google Scholar]
- 29.Lee JC, Timasheff SN. The stabilization of proteins by sucrose. The Journal of biological chemistry. 1981;256(14):7193–7201. [PubMed] [Google Scholar]