

Abstract
Mitochondrion-rich cells (MRCs), or ionocytes, play a central role in aquatic species, maintaining body fluid ionic homeostasis by actively taking up or excreting ions. Since their first description in 1932 in eel gills, extensive morphological and physiological analyses have yielded important insights into ionocyte structure and function, but understanding the developmental pathway specifying these cells remains an ongoing challenge. We previously succeeded in identifying a key transcription factor, Foxi3a, in zebrafish larvae by database mining. In the present study, we analyzed a zebrafish mutant, quadro (quo), deficient in foxi1 gene expression and found that foxi1 is essential for development of an MRC subpopulation rich in vacuolar-type H+-ATPase (vH-MRC). foxi1 acts upstream of Delta-Notch signaling that determines sporadic distribution of vH-MRC and regulates foxi3a expression. Through gain- and loss-of-function assays and cell transplantation experiments, we further clarified that (1) the expression level of foxi3a is maintained by a positive feedback loop between foxi3a and its downstream gene gcm2 and (2) Foxi3a functions cell-autonomously in the specification of vH-MRC. These observations provide a better understanding of the differentiation and distribution of the vH-MRC subtype.
Keywords: Mitochondria-rich cell, Foxi1, Foxi3a, Gcm2, Positive feedback loop, Zebrafish
Introduction
Animals are equipped with an efficient system to maintain body fluid homeostasis. In the case of freshwater fish, which are faced with a problem of passively gaining large quantities of water from aquatic environments and losing salt from their bodies, it is essential to eliminate excess water as dilute urine through the kidney and actively absorb salt from the environment through the gill to compensate for the salinity challenge. The latter process is carried out mainly by specialized cells called mitochondrion-rich cells (MRCs, also referred to as ionocytes or chloride cells), which are located in the gill and characterized by abundant mitochondria and ion transporters and extensive basolateral membrane infoldings that form a tubular system (Evans et al., 2005). In embryonic and larval stages where functional gills are not yet well developed, MRCs are present in the skin covering the yolk and its nearby regions (Ayson et al., 1994; Guggino, 1980; Hiroi et al., 1998; Hiroi et al., 1999; Hwang and Sun, 1989; Hwang et al., 1999; Kaneko et al., 2002; Varsamos et al., 2005). These extrabranchial MRCs are becoming attractive for osmoregulatory research since (1) they are easily accessible for manipulation and visualization and (2) their activities and developmental processes can be studied by knockdown experiments using antisense morpholino oligonucleotides (MOs) whose inhibitory effects are generally maintained until 4 days postfertilization (dpf); at this stage, gills are not formed and therefore the skin MRCs are the main site responsible for the active transport of ions.
Two types of MRCs have been identified in the skin of zebrafish larvae, which can be distinguished by their major types of ATPases that provide driving forces for ion transport: one is rich in Na,K-ATPase (NaK-MRC or NaR cell) and the other is rich in vacuolar-type H+-ATPase (vH-MRC or HR cell) (Lin et al., 2006) (Fig. 1A). vH-MRC is also rich in carbonic anhydrase 2 and considered to be involved in Na+ uptake (Esaki et al., 2007; Yan et al., 2007). In addition, vH-MRC contains an ammonia transporter, Rhcg1, suggesting its involvement in ammonia secretion (Nakada et al., 2007; Shih et al., 2008). The physiological function of NaK-MRC remains to be established except for a minor subpopulation that is involved in Ca2+ absorption (Pan et al., 2005). Both NaK-MRCs and vH-MRCs are sporadically distributed in the yolk sac and the yolk sac extension but NaK-MRC shows a wider distribution than vH-MRC, being expressed in the trunk region in addition to the yolk sac and its extension (Fig. 1A).
Fig. 1.
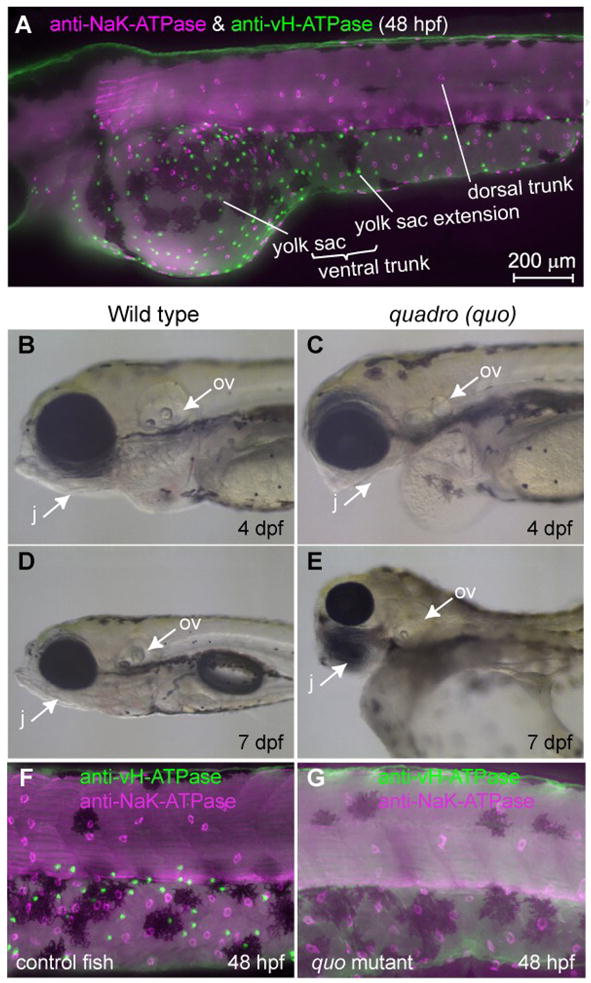
Distribution of two major types of MRC in the skin of zebrafish larvae and a mutant lacking one of them. (A) Double immunostaining of NaK-ATPase (magenta) and vH-ATPase (green) at 48 hpf, viewed from lateral side. (B-E) Phenotypes of quadro (quo) mutant. Defects are seen in otic and jaw development in quo mutant embryos (C, E). All panels show lateral views of live embryos with anterior to the left. j, jaw; ov, otic vesicle. (F, G) Double-immunostaining with anti-vH-ATPase and anti-NaK-ATPase antibody at 48 hpf of wild-type control (F) and quo mutant (G).
In parallel with the above-mentioned molecular, functional, and morphological characterization of fully developed MRCs, their developmental processes are also beginning to be elucidated. We showed that Foxi3a, a forkhead transcription factor, plays a key role in differentiation of vH-MRC (Esaki et al., 2007). Subsequently, Hsiao et al. (Hsiao et al., 2007) and Jänicke et al. (Janicke et al., 2007) have clarified that selection of precursor cells to become MRCs or keratinocytes is mediated by the Delta-Notch competitive lateral inhibition, where cells adopting a MRC fate inhibit their neighbors from adopting a similar fate. Namely, they demonstrated that (1) in a zebrafish mutant, mind bomb (mibta52b) (Itoh et al., 2003), which has a defect in Delta-Notch signaling, most of the precursor cells became MRCs expressing foxi3a and foxi3b, a close relative of foxi3a, and (2) introduction of a constitutively active form of Notch led to the keratinocyte fate. Their proposed model predicts that Bmp7 or a downstream as-yet-unidentified gene drives the expression of Delta/Jagged, a membrane-bound ligand that interacts with its receptor, Notch, in neighboring cells. Activation of Notch then leads to suppression of the default setting (MRC progenitor genes or proMRC genes) of epidermal stem cells. Through this cell-cell interaction, precursor cells compete to inhibit one another from adopting a MRC fate and eventually some cells acquire a high enough expression of proMRC genes to permit an MRC fate and the neighbors lose their capacity to differentiate into MRCs. These recent observations have established Foxi3 transcription factors as key players in the differentiation of MRCs, provided a molecular explanation for the sporadic distribution of MRCs among keratinocytes, and paved the way for more detailed investigations of the mechanism of differentiation of MRCs.
In the present study, we succeeded in identifying factors acting upstream and downstream of Foxi3a through (i) an analysis of a zebrafish mutant, quadro (quo), in which expression of foxi1 is strongly suppressed and (ii) database mining combined with gain- and loss-of-function assays. We further showed by cell transplantation experiments that foxi3a functions cell-autonomously in vH-MRC specification.
Materials and methods
Zebrafish culture
Zebrafish were maintained as described previously (Westerfield, 1995). The wild-type zebrafish TL line was generously provided by Dr. Atsushi Kawakami of our institute. Fertilized eggs were incubated in 1× freshwater (FW) [1× FW: 60 mg ocean salt (Rohtomarine) per 1 litter of distilled water] at 28.5°C unless otherwise mentioned. The animal protocols and procedures were approved by the Institutional Animal Care and Use Committee of Tokyo Institute of Technology.
Molecular cloning of zebrafish genes
Total RNA was extracted from whole bodies of zebrafish larvae at 48 hours post fertilization (hpf) using the RNeasy Lipid Tissue Kit and RNase-Free DNase Set (Qiagen) according to the manufacturer’s instruction. Single-stranded cDNA was synthesized from 1 μg of total RNA using Superscript III First-Strand Synthesis System (Invitrogen) with oligo(dT) primer. All primers to amplify cDNA fragment of each gene and the sizes of fragments are listed in Supplementary Table 1. Each of the cDNA fragments was cloned into pBluescript SK(−) phagemid vector (Stratagene) and sequenced.
RNA probe synthesis
The cloned plasmids, containing the following cDNA sequences, were linearized by restriction enzyme digestion: foxi3a, foxi3b, atp1a1a.2, atp6v1a, deltaC, gcm2, and foxi1. Using the linearized plasmid DNA as template, digoxigenin (DIG)-labeled antisense RNA probes were synthesized by in vitro transcription with T3 and T7 RNA polymerase (Stratagene) and DIG RNA labeling Mix (Roche).
Whole mount in situ hybridization
Whole mount in situ hybridization was performed as described with brief modifications (Thisse and Thisse, 1998). Briefly, zebrafish larvae were fixed with 4% paraformaldehyde (PFA) in phosphate-buffered saline (PBS: 137 mM NaCl, 27 mM KCl, 10 mM Na2HPO4, 2 mM KH2PO4, pH 7.4) containing 0.1% Tween 20 (PBT) at 4°C overnight and dehydrated in 100% methanol. The larvae were gradually rehydrated in series of methanol/PBT (75%, 50%, and 25%) and washed in PBT three times for 5 min. After being rinsed in PBT twice, larvae were re-fixed with 4% PFA in PBT for 20 min and washed with PBT for 5 min four times. For hybridization with DIG-labeled antisense RNA probes, larvae were first incubated in hybridization buffer (HyB: 50% formamide, 5× SSC (1× SSC: 150 mM NaCl, 15 mM sodium citrate, pH 7), 500 μg/ml yeast RNA, 50 μg/ml heparin, 0.1% Tween 20, pH 6.0) at 68°C for 5 h and then in hybridization buffer containing 1 μg/ml DIG-labeled antisense RNA probes at 68°C overnight. The hybridized samples were washed for 10 min each with 75% HyB/25% 2× SSCT (2× SSC with 0.1% Tween 20), 50% HyB/50% 2× SSCT, 25% HyB/75% 2× SSCT, and 2× SSCT, for 30 min with 0.2× SSCT twice at 68°C, and then for 5 min each with 75% 0.2× SSCT/25% PBT, 50% 0.2× SSCT/50% PBT, 25% 0.2× SSCT/75%PBT, and PBT at room temperature. Following incubation for 5 min in PBT-BSA (PBT containing 2 mg/ml bovine serum albumin), larval samples were incubated for 2 h in a blocking solution (PBT-BSA containing 10% sheep serum) and were immunoreacted overnight at 4°C with anti-DIG Fab fragment conjugated with alkaline phosphatase (Roche, diluted 1:4000 in the blocking solution).
In combination with immunohistochemistry (see below), the larvae were incubated with anti-DIG Fab and anti-dace H+-ATPase or Na,K-ATPase antibody (diluted 1: 500) simultaneously. After being washed six times for 15 min with PBT-BSA, samples were incubated for 2 h with donkey anti-rabbit IgG conjugated with Alexa Flour 488 (diluted 1:1000, Invitrogen), and then washed with PBT-BSA for 30 min five times and photographed as previously described (Esaki et al., 2007).
Following three washes for 5 min with alkaline phosphatase reaction buffer (AP buffer: 100 mM Tris-HCl, 50 mM MgCl2, 100 mM NaCl, 0.1% Tween 20, pH 9.5), samples were treated with nitro blue tetrazolium and 5-bromo-4-chloro-3-indolyl phosphate (BCIP/NBT Color Development Substrate, Promega) in AP buffer. Color was developed at room temperature from 30 min to overnight with changing the staining solution every 2 h. When satisfactory coloration was achieved, samples were briefly washed with PBT and fixed with 4% PFA in PBT at 4°C overnight. Finally, the samples were washed with PBT and photographed.
Antibody production
cDNA fragments encoding parts of the NH2 and COOH terminus of drFoxi3 (amino acid residues 2–100 and 216–344 for drFoxi3a and 2–114 and 230–374 for drFoxi3b; dr for Danio rerio) was subcloned into the EcoRI/XhoI site of the bacterial expression vector pGEX4T2 (GE Healthcare Bioscience). The recombinant protein was purified with glutathione Sepharose 4B (GE Healthcare) following the manufacturer’s instruction. Briefly, BL21 cells transformed with the expression vectors were used to inoculate 1.5 liters of Luria-Bertani's broth containing 100 μg/ml ampicillin. The cultures were grown to an A600 of 0.5 at 37°C, and protein expression was induced by adding isopropyl-1-thio-D-galactopyranoside to a final concentration of 0.3 mM for 4 h at 37°C. The cells were harvested from the cultures by centrifugation, resuspended in 20 ml of PBS, and then disrupted by freezing-thawing and sonication. After centrifugation (10,000 g at 4°C), supernatants were saved and purified with glutathione Sepharose 4B. After purification, recombinant proteins were dialyzed against saline at 4°C. Polyclonal antibodies were prepared in Japanese white rabbits by injecting 200 μg of purified recombinant proteins emulsified with the adjuvant TiterMax Gold (CytRx) (1:1) intramuscularly at multiple sites. The rabbits were injected three times at monthly intervals and bled 7 days after the third immunization. In addition, polyclonal antibodies were prepared in four Wistar-Kyoto rats by first injecting 200 μg of protein in Freund’s complete adjuvant near abdominal lymph nodes and intradermally. Two and three weeks after the initial injections, the rats were boosted intradermally with 200 μg of protein in Freund’s incomplete adjuvant. Final bleeds were made 7 days after the third injection.
Immunohistochemistry
Immunohistochemistry with zebrafish larvae was performed as previously described (Esaki et al., 2007). Larvae were fixed with 4% PFA in PBS at 4°C overnight and dehydrated in 100% methanol. After rehydration in PBT and incubation in PBT containing 10% sheep serum (Sigma) for 1 h, the larvae were incubated at 4°C overnight with anti-eel Na,K-ATPase (diluted 1:1000 with PBT containing 10% sheep serum) (Mistry et al., 2001), anti-dace vH+-ATPase (diluted 1:1000) (Hirata et al., 2003), anti-zebrafish Foxi3a (drFoxi3a; diluted 1:500), anti-drFoxi3b (diluted 1:500) or anti-ΔNp63 antibody 4A4 (Santa Cruz, diluted 1:200) (Bakkers et al., 2005). Following a wash with PBT, the larvae were further incubated for 2 h at room temperature with Alexa Flour 488-conjugated anti-rabbit IgG, Alexa Flour 594-conjugated anti-rabbit IgG, Alexa Flour 488-conjugated anti-rat IgG or Alexa Flour 594-conjugated anti-rat IgG (diluted 1:1000, Invitrogen) and then washed with PBT and embedded in 2% methylcellulose to photograph.
Morpholino injection
Antisense morpholinos (MOs) were purchased from GeneTools and injected into one- to two-cell stage embryos according to the method of Nasevicius et al. (Nasevicius and Ekker, 2000). MOs against foxi3a and gcm2 were as described previously (Esaki et al., 2007) and (Hanaoka et al., 2004), respectively. The maximal dosage that caused no obvious toxic effect on embryogenesis was injected as a final concentration: foxi3a MO1, 0.5 ng/embryo; foxi3a MO2, 2 ng/embryo; foxi3b MO1, 13.6 ng/embryo; foxi3b MO2, 2 ng/embryo; gcm2 MO, 4 ng/embryo; foxi1 MO, 3 ng/embryo. Sequences of MOs are listed in Supplementary Table 2. Knockdown efficiency of the foxi3b MOs was confirmed by immunostaining with anti-Foxi3b antiserum (Fig. 2M) since foxi3b MOs exerted little effects on the appearance of vH-MRC and NaK-MRC (Fig. 2K). Microinjection pipettes were fabricated using a Sutter P-97 puller (Sutter Instruments) set up with a 2.0-mm square box filament of 3.0-mm wide (FB230B, Sutter Instruments). Glass capillary tubes (GC-1, Narishige) were used. The ramp test result for the capillaries was 545. A single line program looped three times and had following parameters (heat, 624; pull, -; velocity, 10; and time, 250). After pulling, the tip of pipette was cut by tweezers (Inox No. 5, Fontax) to make hole.
Fig. 2.

Spatio-temporal expression patterns and knockdown analyses of foxi3a and foxi3b. All panels are lateral views, dorsal side up, anterior to the left. (A-F) Whole mount in situ hybridization with foxi3a probe (A-C) and foxi3b probe (D-F). Expression of foxi3a begins earlier than that of foxi3b (A, D). foxi3b-positive cells are distributed in the dorsal trunk region in addition to the ventral trunk region (F). (G, H) Expression of marker genes for vH-MRC (atp6v1a) and NaK-MRC (atp1a1a.2). (I-K) Double-immunostaining with anti-vH-ATPase and anti-NaK-ATPase antibody at 48 hpf of uninjected wild-type control (I), foxi3a morphant (J), and foxi3b morphant (K). (L, M) Immunostaining with anti-Foxi3b antibody at 24 hpf of uninjected wild-type control (L) and foxi3b morphant (M). Knockdown of foxi3b with MO exerted no or little effects on the generation of vH-MRC and NaK-MRC (K) while knockdown of foxi3a resulted in complete loss of both vH-MRC and NaK-MRC (J).
Cell transplantation
Cell transplantation was performed as described with brief modifications (Kudoh et al., 2004). Briefly, at 1-cell stage, donors were injected with foxi3a mRNA (5 pg/embryo) and fluorescein isothiocyanate-dextran (25 ng/embryos; average Mr 2 × 10⁶, Sigma) which is a fixable linage tracer. In a similar manner, recipients were injected with 2 ng/embryo of foxi3a-MO2 which blocks both vH-MRC and NaK-MRC differentiation. Just before 1-k cell stage (4–5 hpf), both donors and recipients embryos were dechorionated and mounted adjacent to one another on agar bed with 0.5% methyl cellulose for manipulation. Using a micro-transplantation pipette, 5–10 cells were removed from mRNA injected donors and implanted into the animal pole of MO-injected recipients. Operated embryos were removed from the methyl cellulose and raised to 48 h and fixed with 4% PFA for immunohistochemistry. Micro-transplantation pipettes were fabricated in a similar manner with the micro-injection pipettes as described above with the following setting: heat, 650; pull, 150; velocity, 110; and time, 120. After pulling, the tip of pipette was cut by tweezers to make a hole which makes cells passing into the pipette.
mRNA injection
All constructs cloned in the pCS2+ vectors were linearized by NotI, and the capped RNA was transcribed using an SP6 RNA polymerase kit (Ambion). The capped mRNA was injected into cells at the 1-cell stage embryos at the following concentrations: foxi1, 10 pg/embryo (Solomon et al., 2003); gcm2, 50 pg/embryo; foxi3a, 5 pg/embryo; foxi3b, 5 pg/embryo.
The terminal deoxynucleotidyl transferase-mediated dUTP-biotin nick end labeling (TUNEL) staining
The TUNEL staining was carried out as previously described (Esaki et al., 2007) using the TUNEL Enzyme and Labeling Mix (Roche). Fluorescein-labeled DNA was visualized by incubation with anti-fluorescein Fab fragment conjugated with alkaline phosphatase (dilution: 1:2000, Roche) and BCIP/NBT color development substrate (Promega).
Generation of transgenic zebrafish for lineage tracing
Double transgenic zebrafish embryos were generated by the following three steps, which are schematically illustrated in Panel A in Fig. 9.
Fig. 9.

Lineage tracing showing a foxi3a-positive nature of NaK-MRC precursor. (A) Structures of the three expression vectors used for in vivo RFP labeling of atp1a1a.2-positive cells and in vivo GFP labeling of foxi3a-positive cells. (B-F) Demonstration that RFP is specifically expressed in the NaK-MRC subtype in the atp1a1a.2:RFP transgenic zebrafish line. In C, MitoTracker stains all types of MRCs. Blue arrows in panel D indicate MRCs other than NaK-MRC. (G-L) Examples of coexpression of RFP and GFP in the same cell under the influence of the promoters of the atp1a1a.2 and foxi3a genes in double transgenic zebrafish embryos. Dark areas in panels G-I represent spider-shaped melanocytes.
(1) Generation of a transgenic zebrafish line carrying atp1a1a.2:RFP
We used the Tol2 transposon system (Kawakami 2007), which is a versatile gene transfer method and is successfully used in zebrafish. To generate atp1a1a.2:RFP transgenic fish, atp1a1a.2:RFP plasmid (construct 1 in Fig. 9A) and transposase mRNA were injected into the 1-cell zebrafish embryos. For preparing the atp1a1a.2:RFP plasmid, a 5’-flanking region of the zebrafish atp1a1a.2 gene (~10 kb) was amplified by PCR using the following forward and reverse primers: CGGCTCGAGGCCTCGCACCTTACATCACCTTAC and CGCACGCGTTGCCTTGTTGACTTGTTTGGAGAC. The PCR fragment was first subcloned into pBS II. To generate a new polylinker, two annealed oligonucleotides (5’-TCGAGCATATGACGCGTCCCGGGGGATCCG-3’ and 5’-TCGACGGATCCCCCGGGACGCGTCATATGC-3’) were ligated into the unique XhoI and SalI site of pT2KXIGΔ in vector. GAP43-RFP was constructed by inserting the oligonucleotides corresponding to the membrane-anchoring signals of GAP-43 (Liu et al., 1994) at the N-terminus of RFP. Then an ~10-kb 5’-flanking region of the atp1a1a.2 gene was integrated into the unique MluI and XhoI site of pT2KXIG in+linker vector. Expression of RFP was detected at 2 dpf under a fluorescence microscope. For generation of stable transgenic lines, the founders were raised to sexual maturity. Transgenic screening was performed by crosses with wild type zebrafish.
(2) Construction of foxi3a:Gal4FF (GFF) plasmid
For preparing foxi3a:Gal4FF plasmid (for its structure, see construct 2-1 in Fig. 9A), a 5’-flanking region of the zebrafish foxi3a gene (~10 kb) was amplified by PCR using the following primers: GAAGGGCCCGCGGCGCAATAGTCTTTTAG (forward) and GAACCTGCAGGATGCTTTCTTCCCGTTTCTCT (reverse). The PCR fragment was first subcloned into pBS II and then integrated into the unique ApaI and SbfI site of T2KhspGFF vector (Asakawa et al., 2008); GFF stands for Gal4FF.
(3) Generation of double transgenic embryos expressing RFP and GFP
To make double transgenic eggs, UAS:GFP fish (Asakawa et al., 2008; for the structure of the vector, see construct 2-2 in Fig. 9A) were first crossed with the atp1a1a.2:RFP fish established above, which yielded eggs carrying two transgenic genes: atp1a1a.2:RFP and UAS:GFP. Consecutively, the above-prepared foxi3a:Gal4FF plasmid together with synthetic transposase mRNA was injected into the cytoplasm of 1-cell-stage embryo (atp1a1a.2:RFP/UAS:GFP) under a stereomicroscope. Injection solution contains 25 ng/μl of target plasmid DNA, 25 ng/μl of transposase mRNA, 0.2 M KCl and 0.25% phenol red. The plasmid pCSTZ2.8, which contains the Tol2 transposase cDNA, was linearized with NotI and used as the template for in vitro transcription of Tol2 transposase mRNA with an SP6 mMESSAGE mMACHINE kit (Ambion).
MitoTracker staining
Mitochondrial-staining reagent, MitoTracker (Invitrogen), was used to illuminate the MRCs. Briefly, 48-hpf embryos were incubated for 30 min in 500 nM MitoTracker Green.
Results
Identification and analysis of a zebrafish mutant lacking vH-MRC
Among the zebrafish mutants generated by treating with N-ethyl-N-nitrosourea (Malicki et al., 1996) and maintained in the Weinberg laboratory, there was a mutant line, named quadro (quo), which exhibited a morphological phenotype almost identical to that previously reported for the foxi1 null mutants foo (Nissen et al., 2003) and hearsay (Solomon et al., 2003) including defects in otic placode (split into two, reduced size, or absence) and the jaw (Figs. 1B-E). When we visualized MRCs by immunofluorescence microscopy using anti-vH-ATPase and anti-NaK-ATPase, we noticed lack of vH-ATPase-positive MRCs (vH-MRCs) (Figs. 1F, G). Prompted by this surprising result, we analyzed the foxi1 gene of the quo mutant and found that expression of foxi1 is strongly suppressed by insertion of an 8-kb retrotransposon in its 3’-untranslated region; a PCR analysis indicated that this insertion strongly destabilizes foxi1 mRNA (more detailed description of the mutation will be published elsewhere). In the quo mutant, appearance of vH-MRC was blocked without any apparent inhibitory effect on NaK-MRC (Fig. 1G).
Expression of foxi1 in early progenitor cells of vH-MRC
In situ hybridization indicated that foxi1 is expressed in the presumptive ectoderm in the gastrula zebrafish embryo (Figs. 3A-C). This expression pattern is consistent with the data available on the ZFIN database (Thisse et al., 2001 - Present) and suggests that zebrafish foxi1 may provide competence for ionocyte progenitor cells to adopt an MRC fate by acting upstream of the known factors DeltaC and Foxi3a. As expected, depletion of foxi1 transcripts with specific MO blocked the expression of deltaC (Figs. 3D, E; 100%, n = 5) and foxi3a (Figs. 3I, J, M, N; 80%, n = 20) in MRC in the epidermal ionocyte domain, and hence the differentiation of vH-MRC (Figs. 3K, O) but not that of NaK-MRC (Figs. 3L, P; 80%, n = 15); expression of deltaC in somites was not suppressed by foxi1 MO. No significant change in expression of notch1a was observed in foxi1 morphants (Fig. 3G, H). In a gain-of-function assay, deltaC and foxi3a expressions were upregulated in foxi1 mRNA-injected embryos (Figs. 3F, R, S; 73%, n = 45). Consequently vH-MRC formation was also upregulated (Fig. 3T; 93%, n = 30). In the case of NaK-MRC, its density was not affected but its expression region is expanded including the head region (Fig. 3U; 97%, n = 36). Forced expression of foxi3a mRNA in foxi1 morphants rescued the formation of vH-MRC in the epidermal ionocyte domain as revealed by in situ hybridization with a probe for atp6v1a mRNA, a marker for vH-MRC (Fig. 3Q).
Fig. 3.

Broad expression of foxi1 in the presumptive ectoderm from 8 hpf and its regulatory role upstream of deltaC and foxi3a. (A-C) Whole mount in situ hybridization with foxi1 probe at 8 hpf (A), 9 hpf (B), and 12 hpf (C). (D-F) Whole mount in situ hybridization with deltaC probe at 12 hpf of uninjected wild-type control (D), foxi1 morphant (E), and foxi1 mRNA-injected embryos (F). (G, H) Whole mount in situ hybridization with notch1a probe at 12 hpf of uninjected (G) and foxi1 MO-injected (H) embryos. (I-U) Whole mount in situ hybridization with (i) foxi3a probe at 12 hpf (I, M, R) and 24 hpf (J, N, S), (ii) atp6v1a probe at 24 hpf (K, O, Q, T), and (iii) atp1a1a.2 probe at 24 hpf (L, P, U) of uninjected wild-type controls (I, J, K, L), foxi1 morphants (M, N, O, P), foxi1 morphant injected with foxi3a mRNA (Q), and foxi1 mRNA-injected embryos (R, S, T, U); for the controls of R-U, also see Figs. 2C, G, H. atp1a1a.2 and atp6v1a are marker genes for NaK-MRC and vH-MRC, respectively. Red arrow in panel U indicates foxi1-induced ectopic generation of NaK-MRC in the head region. Embryos are shown with their ventral side down and animal pole to the right.
The expression pattern of foxi1 also suggests that foxi1, like bmp7, is expressed in all cells of the ventral ectoderm, namely both in epidermal and ionocyte precursors. We therefore determined if foxi1 is also required for keratinocyte specification by immunostaining of ΔNp63, a marker transcription factor for keratinocyte precursor cells (Bakkers et al., 2002; Lee and Kimelman, 2002). As shown in Fig. 4, no apparent inhibition of keratinocyte development was seen in foxi1 morphants, indicating that foxi1, unlike bmp7, is not required for keratinocyte specification. In untreated control embryos, the number of ΔNp63-positive cells was decreased consistent with previous observations that ionocyte precursor cells only transiently express ΔNp63 and become negative for ΔNp63 as ionocyte specification progresses (Hsiao et al., 2007; Janicke et al., 2007).
Fig. 4.

Foxi1 is not necessary for keratinocyte differentiation. Control (A) and foxi1 morphant (B) embryos were immunostained at 48 hpf for ΔNp63, a marker for keratinocyte precursor cells.
gcm2-dependent differentiation and maintenance of vH-MRC
gcm2 codes for a transcription factor that belongs to the Glial Cells Missing (Gcm) family. The first member was found in Drosophila and shown to act as a binary switch between neuronal and glial cell fates in the fly embryonic central nervous system (Hosoya et al., 1995; Jones et al., 1995). In mammals, Gcm2 expression is restricted to the parathyroid gland and it is shown to be required for the differentiation and survival of parathyroid precursor cells (Liu et al., 2007; Okabe and Graham, 2004). gcm2 has also been demonstrated to be essential for cartilage and gill filament formation in zebrafish (Hanaoka et al., 2004; Hogan et al., 2004). We found, through a database search (ZFIN: http://zfin.org/cgi-bin/webdriver?MIval=aa-ZDB_home.apg), that the distribution pattern of gcm2-expressing cells is very similar to that of vH-MRC on the yolk sac membrane of zebrafish larvae (Figs. 5A-D), and decided to determine a possible relationship between gcm2 and the development of vH-MRC. Indeed, transcripts of gcm2 were detected in vH-MRC (Figs. 5E-G). gcm2 expression was found to begin at ~9.5 hpf (Fig. 5A), a little later than that of foxi3a (~9 hpf, Figs. 2A-C), and depletion of foxi3a transcripts with morpholino resulted in complete loss of gcm2 expression (Figs. 5H, I; 100%, n = 10).
Fig. 5.

Expression of gcm2 in vH-MRC and under the influence of foxi3a. (A-D) Whole mount in situ hybridization with gcm2 probe at 9.5 hpf (A), 11 hpf (B), 12 hpf (C), and 24 hpf (D). (E-G) Co-staining of gcm2 (E, in situ hybridization) and vH-ATPase (F, immunostaining), and their merged image (G). gcm2-positive cells (arrowheads in E) completely overlap with vH-MRCs (arrowheads in F). (H, I) Whole mount in situ hybridization with gcm2 probe at 24 hpf of uninjected wild-type control (H), and foxi3a morphant (I). (J) Whole mount in situ hybridization with gcm2 probe at 12 hpf of foxi3a mRNA-injected embryo. (K-N, P-S, U-Y) Whole mount in situ hybridization with (i) foxi3a probe at 12 hpf (K, P) and 24 hpf (L, Q, U), (ii) atp6v1a probe at 24 hpf (M, R, V, X), and (iii) atp1a1a.2 probe at 24 hpf (N, S, W, Y) of uninjected wild-type controls (K-O), gcm2 morphants (P-T), gcm2 mRNA-injected embryos (U-W), and foxi3a morphant injected with gcm2 mRNA (X, Y). (O, T) TUNEL assay of control (O) and gcm2 MO-injected (T) embryos. Injection of gcm2 MO induced apoptosis in the tail region but not in the natural ionocyte domains (T). The densities of vH-MRC and NaK-MRC seem to be slightly increased by gcm2 mRNA injection (V, W) if compared with controls (Fig. 2G, H), but it is difficult to draw definite conclusion because of morphogenetic defects caused by misexpression of gcm2.
In contrast, depletion of gcm2 transcripts with morpholino did not affect the initial expression of foxi3a at 12 hpf (Figs. 5K, P; 100%, n = 10) but blocked the expression at the later stage (1 dpf, Figs. 5L, Q; 100%, n = 10). The knockdown of gcm2 resulted in depletion of vH-MRC (Figs. 5M, R; 95%, n = 20), but not NaK-MRC (Figs. 5N, S; 95%, n = 20). Furthermore overexpression of gcm2 by injecting recombinant mRNA did not cause appreciable changes in the number and distribution of foxi3a-positive cells and MRCs even though embryos show severe phenotype (Fig. 5U-W; ~90%, n = 10). These results indicate that Gcm2 acts downstream of Foxi3a, and Gcm2 does not seem to be required for the initial expression of foxi3a and hence generation of vH-MRC but it is necessary for maintaining expression of foxi3a. However, another possibility remains that gcm2 is important for cell survival rather than maintenance of foxi3a expression and, in gcm2 MO-injected embryos, vH-MRCs die and therefore foxi3a expression is lost. This possibility was eliminated by TUNEL staining that detects cells undergoing apoptosis, which showed no significant difference between untreated and gcm2 MO-injected embryos (Figs. 5O, T). To clarify further the relationship of foxi3a and gcm2, we carried out a gcm2 overexpression experiment using foxi3a morphants. No recovery of vH-MRC was observed in foxi3a morphants injected with gcm2 mRNA (Figs. 5X, Y), suggesting that gcm2, by itself, cannot induce development of vH-MRC but contributes indirectly to the formation of vH-MRC through the maintenance of foxi3a (model in Fig. 10). Consistent with the gcm2 action on foxi3a, there is a consensus sequence for the Gcm-binding site (ATGAGGGC) in appropriate distance (position −60) from a potential TATA box on the foxi3a gene.
Fig. 10.

Schematic representation of development of vH-MRC. Turning point times are indicated in the left. The factors identified by this study for the first time are indicated by red boxes.
Foxi3a-dependent cell-type specification of vH-MRC
To show that expression of foxi3a is necessary and sufficient for vH-MRC, we performed cell transplantation experiments. Donor embryos were generated by injecting fertilized eggs with a mixture of foxi3a mRNA and fluorescent dextran, which served as a lineage tracer. foxi3a+ cells were transplanted at early blastula stages into ectoderm positions of host embryos whose foxi3a had been depleted with MO (foxi3a morphants). Chimeric embryos were then allowed to develop until 2 dpf. The grafted cells, identified by green fluorescence, were mostly found in ectopic locations (e.g. near the eye and fin, Fig. 6). Immunochemical characterization of them revealed that they expressed vH-ATPase at sub-apical region like fully developed vH-MRC (Figs. 6G-I; n = 15). This result demonstrates that foxi3a by itself can induce expression of vH-ATPase, a marker for vH-MRC, confirming the previous reports by Hsiao et al. (Hsiao et al., 2007) and Jänicke et al. (Janicke et al., 2007) who showed that both foxi3a and foxi3b have the ability to induce ectopically atp1b1b (coding for a Na,K-ATPase subunit), atp6va1 (coding for a vH-ATPase subunit), and ca2 (coding for carbonic anhydrase 2, a marker for vH-MRC).
Fig. 6.

Transplantation experiment to show cell-autonomous nature of foxi3a. (A-F) foxi3a mRNA and FITC-dextran injected cells were transplanted into the animal pole of a foxi3a MO-injected embryo at 4-5 hpf. Transplanted cells (A, D, G; FITC-green) and cells expressing vH-ATPase (B, E, H;,immunostaining, purple) completely overlapped (C, F, I; merged images). (G-I) High-magnification view of ectopic expression of vH-ATPase. Magnified area is indicated by a white box (C).
Complex relationship between the foxi1-foxi3a/gcm2 pathway and foxi3b
Previous studies have revealed, by in situ hybridization, that vH-MRC and NaK-MRC can be distinguished by the expression levels of foxi3a and foxi3b, which are close relatives sharing ~94% sequence identity (Supplementary Fig. 1) (Hsiao et al., 2007; Janicke et al., 2007). We confirmed here the in situ hybridization results at the protein level by immunostaining (Fig. 7). Foxi3a protein is almost exclusively expressed in vH-MRC. Foxi3b is expressed in both types of MRCs: low but significant levels in vH-MRC and high levels in NaK-MRC. In the preceding sections, we described the effects of knockdown of foxi1 and gcm2 on the expression of foxi3a. As a complementary approach, we next determined their knockdown effects on foxi3b expression.
Fig. 7.

Expression profiles of protein products of foxi3a and foxi3b in vH-MRC and NaKMRC revealed by immunohistochemistry. All panels are lateral views of yolk sac extension and dorsal trunk, dorsal side up, anterior to the left. Yellow arrows and white arrowheads represent typical NaK-MRC and vH-MRC, respectively. (A) Double immunostaining of Foxi3b and vHATPase. (B) Double immunostaining of Foxi3b and NaK-ATPase. (C) Double immunostaining of Foxi3a and NaK-ATPase. (D) Summary of the expression profiles.
In foxi1 morphants, foxi3b expression was not seen at 12 hpf but restored at 24 hpf (Figs. 8A-D). This is a marked contrast to foxi3a whose expression was completely downregulated in foxi1 morphants (Figs. 3M, N). Although delayed, the recovery of expression of foxi3b in foxi1 morphants is consistent with the presence of NaK-MRC in the morphants. However, this recovery of foxi3b and NaK-MRC was contradictory to our expectation since we had confirmed the previous reports that foxi3a morphants lack not only vH-MRC but also foxi3b and NaK-MRC (Hsiao et al., 2007; Janicke et al., 2007) (our data not shown). We therefore tried to mimic the situation by injecting foxi3b mRNA into foxi3a morphants. To our surprise, introduction of foxi3b mRNA strongly induced vH-MRC (Figs. 8F, H) whereas no induction of NaK-MRC was seen in the natural ionocyte domain (Figs. 8G, I); only ectopic expression of NaK-MRC was induced in the head region by foxi3b mRNA in foxi3a morphants (Fig. 8I). In gcm2 morphants, expression of foxi3b was not changed (Fig. 8E).
Fig. 8.

Complex interplay between the foxi1-foxi3a/gcm2 pathway and foxi3b. (A-E) Whole mount in situ hybridization, with a foxi3b probe, of control (A, B), foxi1 MO-injected (C, D), and gcm2 MO-injected (E) embryos. (F, H) Whole mount in situ hybridization, with an atp6v1a probe, of control embryo (F) and foxi3a morphant injected with foxi3b mRNA (H). (G, I) Whole mount in situ hybridization, with an atp1a1a.2 probe, of control embryo (G) and foxi3a morphant injected with foxi3b mRNA (L). foxi3b-induced formation of NaK-MRC was only observed ectopically in the head region (red arrow) in foxi3a morphants.
Lineage analysis using transgenic zebrafish embryos
We tried to concentrate, in the present study, on the vH-MRC development, but to clarify the relationship between the foxi1-foxi3a/gcm2 pathway and formation of NaK-MRC, we performed a lineage analysis by generating double transgenic zebrafish, in which (i) NaK-MRC was visualized by red fluorescence protein (RFP) expression under the control of enhancer and promoter of the atp1a1a.2 gene and (ii) cells expressing foxi3a were similarly labeled with GFP by using the promoter/enhancer of the zebrafish foxi3a gene. We observed coexpression of RFP and GFP (Figs. 9G-L), suggesting that NaK-MRC also derives from the foxi3a-positive cells. The fact that RFP-expressing cells represent NaK-MRC was confirmed by staining atp1a1a.2:RFP single-transgenic embryos with an atp1a1a.2 in situ hybridization probe (Figs. 9E, F).
Discussion
Unraveling the mechanism of development of MRCs is a fundamental goal of molecular physiologists. Our results presented here and those of others (Hsiao et al., 2007; Janicke et al., 2007) indicate that the differentiation program of MRCs is much more complex than expected and several sets of transcription factors from various families act in concert to form the vH-MRC subtype as described below.
Transcriptional regulatory mechanisms controlling skin vH-MRC development
Current evidence suggests the following model for the development and maintenance of vH-MRCs in the skin of zebrafish larvae (Fig. 10). The vH-MRC pathway: (1) Bmp7 sets the stage for a cascade of signaling events leading to differential gene expression and subsequent formation of the two types of MRCs and epidermal keratinocytes (Hsiao et al., 2007); (2) activation of foxi1 leads to lateral inhibition mediated by Delta-Notch signaling, giving rise to vH-MRC progenitor and keratinocyte precursor cells; (3) a positive feedback loop between foxi3a and its downstream gene gcm2 induces differentiation into mature vH-MRCs. These cells arise from the ectoderm. Very recently, Chang et al. (Chang et al., 2009) have also demonstrated that gcm2 is involved in differentiation of vH-MRC in zebrafish.
The fact that the NaK-MRC fate is scarcely affected by the depletion of foxi1 (Figs. 1G, 3P) was contrary to our initial expectation that knockdown of foxi1 may result in disappearance of not only vH-MRC but also NaK-MRC. This expectation was based on (i) the observations of Hsiao et al. (Hsiao et al., 2007), Janicke et al. (Janicke et al., 2007), and ours (Fig. 2J) that foxi3a MO eliminated both vH-MRC and NaK-MRC and (ii) the depletion of foxi1 resulted in complete suppression of foxi3a (Figs. 3M, N). But actual results were that depletion of foxi1 and its downstream foxi3a by foxi1 MO resulted in elimination of only vH-MRC and, in contrast, suppression of foxi3a by foxi3a MO resulted in elimination of both vH-MRC and NaK-MRC. Currently this apparent contradiction is difficult to explain since if we assume, to explain the effects of foxi1 and foxi3a MOs, that (i) initial lineage separation of NaK-MRC and vH-MRC occurs earlier than the expression of foxi1 and (ii) the NaK-MRC pathway is negatively regulated by foxi1 until onset of foxi3a expression, it becomes difficult to explain the lineage tracing result that strongly suggested that both vH-MRC and NaK-MRC derive from the foxi3a-positive precursor cells (Fig. 9). For clarification of the relationship between foxi1 and NaK-MRC, it would be necessary to perform another lineage tracing experiment by generating transgenic zebrafish whose foxi1-expressing cells are labeled with GFP by using the promoter/enhancer of the foxi1 gene. Another important factor to be considered is Foxi3b, which is a close relative of Foxi3a and is proposed to be a key regulator of NaK-MRC development (Hsiao et al., 2007). As mentioned in Results, however, effects of depletion and overexpression of foxi3b are so complicated that we are unable to include it to our current model. In the present study, we clarified the transcriptional regulatory mechanisms controlling skin vH-MRC development by identifying two novel factors, foxi1 and gcm2, but concerning that of NaK-MRC, our results revealed its unexpectedly complex nature.
Differential expression of foxi3a and foxi3b in vH-MRC and NaK-MRC and its significance
Mature vH-MRC and NaK-MRC are clearly discriminated by the presence and absence of the foxi3a transcript, respectively (Hsiao et al., 2007; Janicke et al., 2007). We also confirmed this characteristic difference at the protein level using specific antiserum raised against recombinant zebrafish Foxi3a (Fig. 7). The two types of MRC can also be distinguished by high (NaK-MRC) and low (vH-MRC) expression of foxi3b, a close relative of foxi3a (Hsiao et al., 2007; Janicke et al., 2007) (Supplementary Fig. 1). Based on (1) these differences in the expression patterns of foxi3a and foxi3b, (2) the observation that the onset of expression of foxi3a is earlier than that of foxi3b, and (3) the fact that NaK-MRC differentiates earlier than vH-MRC, Hsiao et al. (Hsiao et al., 2007) proposed a model for the role of foxi3b. According to their model, foxi3a is first activated; Foxi3a, in turn, activates foxi3b. This coexpression of foxi3a and foxi3b is sufficient to promote the primary setting of NaK-MRC differentiation, while the secondary setting of vH-MRC differentiation is strongly dependent on a higher concentration of Foxi3a, which is achieved through a positive feedback regulation by Foxi3b. They explained the relatively weak effects of foxi3b MO on the formation of MRCs (Fig. 2K; Hsiao et al., 2007) by supposing that the foxi3afoxi3b positive feedback loop can continuously supply the foxi3b transcript, eventually diluting out the foxi3b MO, and maintain the Foxi3b protein levels even in the presence of antisense MO. To test this hypothesis, we carried out immunostaining of wild-type zebrafish larvae and foxi3b morphants. In contrast to a clear staining in the wild-type larvae, no significant staining was observed in the morphants (Fig. 2M), suggesting that foxi3b MO was not diluted out and acted as intended. Our results strongly suggest that the lack of or weak inhibitory effects of foxi3b MO is not due to being diluted out of its existence. Even more complicatedly, Jänicke et al. (Janicke et al., 2007) have reported complete disappearance of vH-MRC and only a partial reduction of NaK-MRC in foxi3b morphants. Furthermore, we observed induction of supernumerary vH-MRC in the epidermal ionocyte domain when foxi3b was forcedly expressed in foxi3a morphants (Fig. 8H). These results indicate that although foxi3b plays a key role in the differentiation of the subtypes of ionocytes, its role is not as simple as that proposed by Hsiao et al. (Hsiao et al., 2007) and requires further extensive studies.
Supplementary Material
Acknowledgments
We thank Dr. Shingo Maegawa for discussion, Noriko Isoyama for technical support, Setsuko Sato for secretarial assistance and Dr. Roger Y. Tsien of University of California at San Diego for providing monomeric RFP. This work was supported by Ministry of Education, Culture, Sport, Science and Technology of Japan (MEXT) Grants-in-Aid for Scientific Research 14104002, 17570003, 18059010, 19570201, and the Global Center of Excellence Program of MEXT. Work in the Weinberg lab was supported by NIH grant R01 DC 003080.
Footnotes
Publisher's Disclaimer: This is a PDF file of an unedited manuscript that has been accepted for publication. As a service to our customers we are providing this early version of the manuscript. The manuscript will undergo copyediting, typesetting, and review of the resulting proof before it is published in its final citable form. Please note that during the production process errors may be discovered which could affect the content, and all legal disclaimers that apply to the journal pertain.
References
- Asakawa K, Suster ML, Mizusawa K, Nagayoshi S, Kotani T, Urasaki A, Kishimoto Y, Hibi M, Kawakami K. Genetic dissection of neural circuits by Tol2 transposon-mediated Gal4 gene and enhancer trapping in zebrafish. Proc Natl Acad Sci USA. 2008;105:1255–1260. doi: 10.1073/pnas.0704963105. [DOI] [PMC free article] [PubMed] [Google Scholar]
- Ayson FG, Kaneko T, Hasegawa S, Hirano T. Differential expression of two prolactin and growth hormone genes during early development of tilapia (Oreochromis mossambicus) in fresh water and seawater: implications for possible involvement in osmoregulation during early life stages. Gen Comp Endocrinol. 1994;95:143–152. doi: 10.1006/gcen.1994.1111. [DOI] [PubMed] [Google Scholar]
- Bakkers J, Hild M, Kramer C, Furutani-Seiki M, Hammerschmidt M. Zebrafish DeltaNp63 is a direct target of Bmp signaling and encodes a transcriptional repressor blocking neural specification in the ventral ectoderm. Dev Cell. 2002;2:617–627. doi: 10.1016/s1534-5807(02)00163-6. [DOI] [PubMed] [Google Scholar]
- Bakkers J, Camacho-Carvajal M, Nowak M, Kramer C, Danger B, Hammerschmidt M. Destabilization of DeltaNp63alpha by Nedd4-mediated ubiquitination and Ubc9-mediated sumoylation, and its implications on dorsoventral patterning of the zebrafish embryo. Cell Cycle. 2005;4:790–800. doi: 10.4161/cc.4.6.1694. [DOI] [PubMed] [Google Scholar]
- Chang WJ, Horng JL, Yan JJ, Hsiao CD, Hwang PP. The transcription factor, glial cell missing 2, is involved in differentiation and functional regulation of H+-ATPase-rich cells in zebrafish (Danio rerio) Am J Physiol Regul Integr Comp Physiol. 2009 doi: 10.1152/ajpregu.90973.2008. in press. [DOI] [PubMed] [Google Scholar]
- Esaki M, Hoshijima K, Kobayashi S, Fukuda H, Kawakami K, Hirose S. Visualization in zebrafish larvae of Na+ uptake in mitochondria-rich cells whose differentiation is dependent on foxi3a. Am J Physiol Regul Integr Comp Physiol. 2007;292:R470–R480. doi: 10.1152/ajpregu.00200.2006. [DOI] [PubMed] [Google Scholar]
- Evans DH, Piermarini PM, Choe KP. The multifunctional fish gill: dominant site of gas exchange, osmoregulation, acid-base regulation, and excretion of nitrogenous waste. Physiol Rev. 2005;85:97–177. doi: 10.1152/physrev.00050.2003. [DOI] [PubMed] [Google Scholar]
- Guggino WB. Salt balance in embryos of Fundulus heteroclitus and F. bermudae adapted to seawater. Am J Physiol Regul Integr Comp Physiol. 1980;238:R42–R49. doi: 10.1152/ajpregu.1980.238.1.R42. [DOI] [PubMed] [Google Scholar]
- Hanaoka R, Ohmori Y, Uyemura K, Hosoya T, Hotta Y, Shirao T, Okamoto H. Zebrafish gcmb is required for pharyngeal cartilage formation. Mech Dev. 2004;121:1235–1247. doi: 10.1016/j.mod.2004.05.011. [DOI] [PubMed] [Google Scholar]
- Hirata T, Kaneko T, Ono T, Nakazato T, Furukawa N, Hasegawa S, Wakabayashi S, Shigekawa M, Chang MH, Romero MF, Hirose S. Mechanism of acid adaptation of a fish living in a pH 3.5 lake. Am J Physiol Regul Integr Comp Physiol. 2003;284:R1199–R1212. doi: 10.1152/ajpregu.00267.2002. [DOI] [PubMed] [Google Scholar]
- Hiroi J, Kaneko T, Seikai T, Tanaka M. Developmental sequence of chloride cells in the body skin and gills of Japanese flounder (Paralichthys olivaceus) larvae. Zoolog Sci. 1998;15:455–460. doi: 10.2108/0289-0003(1998)15[455:DSOCCI]2.0.CO;2. [DOI] [PubMed] [Google Scholar]
- Hiroi J, Kaneko T, Tanaka M. In vivo sequential changes in chloride cell morphology in the yolk-sac membrane of mozambique tilapia (Oreochromis mossambicus) embryos and larvae during seawater adaptation. J Exp Biol. 1999;202:3485–3495. doi: 10.1242/jeb.202.24.3485. [DOI] [PubMed] [Google Scholar]
- Hogan BM, Hunter MP, Oates AC, Crowhurst MO, Hall NE, Heath JK, Prince VE, Lieschke GJ. Zebrafish gcm2 is required for gill filament budding from pharyngeal ectoderm. Dev Biol. 2004;276:508–522. doi: 10.1016/j.ydbio.2004.09.018. [DOI] [PubMed] [Google Scholar]
- Hosoya T, Takizawa K, Nitta K, Hotta Y. Glial cells missing: a binary switch between neuronal and glial determination in drosophila. Cell. 1995;82:1025–1036. doi: 10.1016/0092-8674(95)90281-3. [DOI] [PubMed] [Google Scholar]
- Hsiao C, You M, Guh Y, Ma M, Jiang Y, Hwang P. A positive regulatory loop between foxi3a and foxi3b is essential for specification and differentiation of zebrafish epidermal ionocytes. PLoS ONE. 2007;2:e302. doi: 10.1371/journal.pone.0000302. [DOI] [PMC free article] [PubMed] [Google Scholar]
- Hwang P-P, Sun CM. Putative role of adenohypophysis in the osmoregulation of tilapia larvae (Oreochromis mossambicus; Teleostei): an ultrastructure study. Gen Comp Endocrinol. 1989;73:335–341. doi: 10.1016/0016-6480(89)90189-5. [DOI] [PubMed] [Google Scholar]
- Hwang PP, Lee TH, Weng CF, Fang MJ, Cho GY. Presence of Na-K-ATPase in mitochondria-rich cells in the yolk-sac epithelium of larvae of the teleost Oreochromis mossambicus. Physiol Biochem Zool. 1999;72:138–144. doi: 10.1086/316660. [DOI] [PubMed] [Google Scholar]
- Itoh M, Kim CH, Palardy G, Oda T, Jiang YJ, Maust D, Yeo SY, Lorick K, Wright GJ, Ariza-McNaughton L, Weissman AM, Lewis J, Chandrasekharappa SC, Chitnis AB. Mind bomb is a ubiquitin ligase that is essential for efficient activation of Notch signaling by Delta. Dev Cell. 2003;4:67–82. doi: 10.1016/s1534-5807(02)00409-4. [DOI] [PubMed] [Google Scholar]
- Janicke M, Carney TJ, Hammerschmidt M. Foxi3 transcription factors and Notch signaling control the formation of skin ionocytes from epidermal precursors of the zebrafish embryo. Dev Biol. 2007;307:258–271. doi: 10.1016/j.ydbio.2007.04.044. [DOI] [PubMed] [Google Scholar]
- Jones BW, Fetter RD, Tear G, Goodman CS. glial cells missing: a genetic switch that controls glial versus neuronal fate. Cell. 1995;82:1013–1023. doi: 10.1016/0092-8674(95)90280-5. [DOI] [PubMed] [Google Scholar]
- Kaneko T, Shiraishi K, Katoh F, Hasegawa S, Hiroi J. Chloride cells during early life stages of fish and their functional differentiation. Fisheries Sci. 2002;68:1–9. [Google Scholar]
- Kawakami K. Tol2: a versatile gene transfer vector in vertebrates. Genome Biol. 2007;8(Suppl 1):S7. doi: 10.1186/gb-2007-8-s1-s7. [DOI] [PMC free article] [PubMed] [Google Scholar]
- Kudoh T, Concha ML, Houart C, Dawid IB, Wilson SW. Combinatorial Fgf and Bmp signalling patterns the gastrula ectoderm into prospective neural and epidermal domains. Development. 2004;131:3581–3592. doi: 10.1242/dev.01227. [DOI] [PMC free article] [PubMed] [Google Scholar]
- Lee H, Kimelman D. A dominant-negative form of p63 is required for epidermal proliferation in zebrafish. Dev Cell. 2002;2:607–616. doi: 10.1016/s1534-5807(02)00166-1. [DOI] [PubMed] [Google Scholar]
- Liu Y, Fisher DA, Storm DR. Intracellular sorting of neuromodulin (GAP-43) mutants modified in the membrane targeting domain. J Neurosci. 1994;14:5807–5817. doi: 10.1523/JNEUROSCI.14-10-05807.1994. [DOI] [PMC free article] [PubMed] [Google Scholar]
- Liu Z, Yu S, Manley NR. Gcm2 is required for the differentiation and survival of parathyroid precursor cells in the parathyroid/thymus primordia. Dev Biol. 2007;305:333–346. doi: 10.1016/j.ydbio.2007.02.014. [DOI] [PMC free article] [PubMed] [Google Scholar]
- Lin LY, Horng JL, Kunkel JG, Hwang PP. Proton pump-rich cell secretes acid in skin of zebrafish larvae. Am J Physiol, Cell Physiol. 2006;290:C371–C378. doi: 10.1152/ajpcell.00281.2005. [DOI] [PubMed] [Google Scholar]
- Malicki J, Schier AF, Solnica-Krezel L, Stemple DL, Neuhauss SCF, Stainier DYR, Abdelilah S, Rangini Z, Zwartkruis F, Driever W. Mutations affecting development of the zebrafish ear. Development. 1996;123:275–283. doi: 10.1242/dev.123.1.275. [DOI] [PubMed] [Google Scholar]
- Mistry AC, Honda S, Hirata T, Kato A, Hirose S. Eel urea transporter is localized to chloride cells and is salinity dependent. Am J Physiol Regul Integr Comp Physiol. 2001;281:R1594–R1604. doi: 10.1152/ajpregu.2001.281.5.R1594. [DOI] [PubMed] [Google Scholar]
- Nakada T, Hoshijima K, Esaki M, Nagayoshi S, Kawakami K, Hirose S. Localization of ammonia transporter Rhcg1 in mitochondrion-rich cells of yolk sac, gill, and kidney of zebrafish and its ionic strength-dependent expression. Am J Physiol Regul Integr Comp Physiol. 2007;293:R1743–R1753. doi: 10.1152/ajpregu.00248.2007. [DOI] [PubMed] [Google Scholar]
- Nasevicius A, Ekker SC. Effective targeted gene 'knockdown' in zebrafish. Nat Genet. 2000;26:216–220. doi: 10.1038/79951. [DOI] [PubMed] [Google Scholar]
- Nissen RM, Yan J, Amsterdam A, Hopkins N, Burgess SM. Zebrafish foxi one modulates cellular responses to Fgf signaling required for the integrity of ear and jaw patterning. Development. 2003;130:2543–2554. doi: 10.1242/dev.00455. [DOI] [PubMed] [Google Scholar]
- Okabe M, Graham A. The origin of the parathyroid gland. Proc Natl Acad Sci U S A. 2004;101:17716–17719. doi: 10.1073/pnas.0406116101. [DOI] [PMC free article] [PubMed] [Google Scholar]
- Pan TC, Liao BK, Huang CJ, Lin LY, Hwang PP. Epithelial Ca2+ channel expression and Ca2+ uptake in developing zebrafish. Am J Physiol Regul Integr Comp Physiol. 2005;289:R1202–R1211. doi: 10.1152/ajpregu.00816.2004. [DOI] [PubMed] [Google Scholar]
- Shih TH, Horng JL, Hwang PP, Lin LY. Ammonia excretion by the skin of zebrafish (Danio rerio) larvae. Am J Physiol Cell Physiol. 2008;295:C1625–C1632. doi: 10.1152/ajpcell.00255.2008. [DOI] [PubMed] [Google Scholar]
- Solomon KS, Kudoh T, Dawid IB, Fritz A. Zebrafish foxi1 mediates otic placode formation and jaw development. Development. 2003;130:929–940. doi: 10.1242/dev.00308. [DOI] [PubMed] [Google Scholar]
- Thisse C, Thisse B. High resolution whole-mount in situ hybridization. The Zebrafish Science Monitor. 1998;5:8–9. [Google Scholar]
- Varsamos S, Nebel C, Charmantier G. Ontogeny of osmoregulation in postembryonic fish: a review. Comp Biochem Physiol. 2005;141A:401–429. doi: 10.1016/j.cbpb.2005.01.013. [DOI] [PubMed] [Google Scholar]
- Westerfield M. The Zebrafish Book: A Guide to the Laboratory Use of Zebrafish (Danio rerio) Eugene: University of Oregon Press; 1995. [Google Scholar]
- Yan JJ, Chou MY, Kaneko T, Hwang PP. Gene expression of Na+/H+ exchanger in zebrafish H+-ATPase-rich cells during acclimation to low-Na+ and acidic environments. Am J Physiol Cell Physiol. 2007;293:C1814–C1823. doi: 10.1152/ajpcell.00358.2007. [DOI] [PubMed] [Google Scholar]
Associated Data
This section collects any data citations, data availability statements, or supplementary materials included in this article.