

Abstract
Purpose
To investigate spectral domain optical coherence tomography (SD-OCT) detected optic disc margin anatomy in the monkey eye by co-localizing disc photographs to SD-OCT scans acquired from the same eyes.
Methods
The neural canal opening (NCO) was delineated within 40 digital radial sections generated from SD-OCT volumes acquired from 33 normal monkey eyes (15°, 290 × 768 horizontal grid pattern, Heidelberg Spectralis). Each volume was co-localized to its disc photograph by matching the retinal vessels within each photograph to vessel outlines visible within en face SD-OCT images. Border Tissue was delineated where it extended internal to the NCO. A clinician (masked to delineated points) marked the disc margin onto each photograph whilst viewing the relevant stereophotograph pair. Alignment of the clinician-ascribed disc margin to the NCO and Border Tissue delineations was assessed. The process was repeated in a single myopic human eye.
Results
In 23 eyes, the NCO aligned to the disc margin. In 10 eyes, externally oblique Border Tissue was detectable in the temporal disc. In these regions of the disc, the termination of Border Tissue was the disc margin. An exaggerated form of this phenotype was observed in the myopic human eye. In this case, temporal Border Tissue terminated at the anterior scleral canal opening, which was detected as the disc margin.
Conclusions
The termination of Bruch’s Membrane, Border Tissue and the anterior scleral canal opening may constitute the disc margin within the same eye depending upon the Border Tissue architecture; this anatomy is consistently visualized by SD-OCT.
An ability to identify, understand and appreciate the morphological changes occurring at the optic nerve head (ONH) is vital in the assessment of patients with, or at risk of, glaucoma. The ONH is a complex three-dimensional (3-D) structure and interpretation of its underlying anatomy can be a challenge for clinicians. The optic disc margin is a fundamental clinical landmark in the assessment of the ONH as it marks the peripheral boundary of neural tissue within the disc. As such the disc margin is an essential component of both the assessment of neuroretinal rim loss and of disc size.
The ring of Elschnig is widely accepted as the structure underpinning the fundoscopic appearance of the optic disc margin in human eyes.1 The ring of Elschnig comprises the Border Tissue of Elschnig (hereby referred to as Border Tissue) which is collagenous tissue, arising from the sclera to join Bruch’s Membrane, thereby enclosing the choroid.2 It is this scleral ‘cuff’ or ‘lip’ between the ONH and the choroid which has been thought to account for the white ‘rim’ perceived fundoscopically as the disc margin in the human eye.3, 4 The appearance of the disc margin is therefore that of a whitish halo (if present for 360°) or crescent (if present for less than 360°) at the edge of the disc. However, these landmarks may not be detectable in some regions or not at all in certain discs. In this context, the subjective location of the disc margin can be highly variable.
In a series of recent publications we have proposed three important concepts that are necessary to understand optic disc margin anatomy within 3-D histomorphometric and spectral domain optical coherence tomography (SD-OCT) reconstructions of the monkey ONH.5-7 The first concept is that of a ‘neural canal opening’ (NCO) (Figure 1A - arrows), which is the anatomic opening in Bruch’s Membrane (also referred to as Bruch’s Membrane Opening – BMO) through which retinal ganglion cell axons must pass to enter the choroidal and scleral portions of the neural canal.6-8 The second concept is that of a ‘neural canal’ which is the axonal pathway through the eye wall.5 The neural canal begins at the NCO, and then extends through a choroidal component, bound on either side by the Border Tissue (Figure 1A - arrowheads). Beyond the choroidal component, the neural canal has a scleral component, bound on either side by the internal wall of the sclera. The neural canal terminates at the point at which the optic nerve leaves the globe. The third concept is that what the clinician perceives to be the disc margin is not a single anatomic structure but is instead variable with some portions being the NCO, and others the Border Tissue (Figure 1A - arrowheads) or the anterior scleral canal opening, depending upon the 3-D architecture of these structures.7
Figure 1. Neural canal architecture, demonstrating the neural canal opening (NCO) and Border Tissue within a histologic section (upper) and a co-localized spectral domain OCT B-scan.
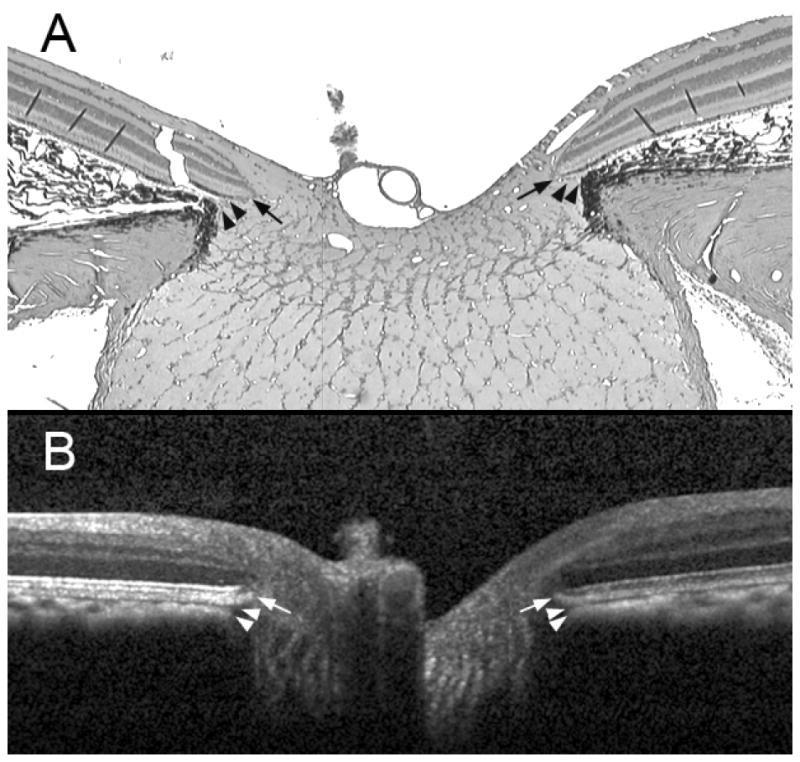
A representative serial histologic section (hematoxylin and eosin stain, × 2.5 magnification) through the optic nerve head of a normal monkey eye (not part of this report), perfusion fixed at an IOP of 10 mmHg (panel A) compared to an equivalent B-scan acquired in vivo from the same optic nerve head at an IOP of 10 mmHg (panel B). The arrows show the position of the NCO, which in the histologic section (black arrows) is at the termination of Bruch’s Membrane either side of the neural canal and in the B-scan (white arrows) is at the termination of the retinal pigment epithelium/Bruch’s Membrane signal either side of the neural canal. The arrowheads show the position of Border Tissue, which in the histologic section (black arrowheads) is an extension of the scleral connective tissue, enclosing the choroid to meet Bruch’s Membrane; in the B-scan (white arrowheads) the Border Tissue is identified as the junction of the choroidal signal with the neural canal. The neural canal extends from the NCO until the point where the optic nerve exits the globe, passing through a choroidal component (bound by the Border Tissue) followed by a scleral component.
The NCO is an important anatomic landmark because it can be identified within SD-OCT images and has been proposed as the basis for a reference plane for SD-OCT imaging.8 Within our 3-D histomorphometric reconstructions we define the NCO as the termination of Bruch’s Membrane (BMO) because Bruch’s Membrane is within the resolution of our reconstruction technique.6 Within SD-OCT reconstructions we define the NCO as the termination of the Bruch’s Membrane/retinal pigment epithelium (BM/RPE) complex because it is uncertain whether Bruch’s Membrane in isolation can be resolved by SD-OCT.9
We recently co-localized post mortem 3-D ONH histomorphometric reconstructions to stereophotographs acquired in vivo in twenty-eight normal monkey eyes.7 In that study we found that the NCO constituted the disc margin throughout its full extent in the majority of monkey eyes. However in some eyes, Border Tissue was detectable in disc photographs and it co-localized to the disc margin in regions where it demonstrated an ‘externally oblique’ configuration (described below) and where its junction with the anterior scleral surface was internal to the termination of Bruch’s Membrane.
From these 3-D histomorphometric reconstructions, we have proposed that there are two principal Border Tissue orientations (both illustrated in Figure 2) and that Border Tissue orientation determines what the clinician identifies as the disc margin. The Border Tissue orientation is most commonly ‘internally oblique’ whereby Border Tissue extends from the sclera into the neural canal to meet Bruch’s Membrane (Figure 2A). Border Tissue is less commonly ‘externally oblique’ whereby Border Tissue extends from the sclera away from the neural canal to meet Bruch’s Membrane (Figure 2B). Where an overhang of Bruch’s Membrane extends beyond the innermost termination of Border Tissue (whether internally or externally oblique), the termination of Bruch’s Membrane (BMO) is detected as the disc margin. Where the innermost termination of an externally oblique Border Tissue is internal to the termination of Bruch’s Membrane, the Border Tissue is visible clinically and comprises the disc margin.7 We now propose that the anatomical basis of the disc margin can also be identified and delineated within SD-OCT volumes. The purpose of this study was to examine whether the NCO and Border Tissue identified in SD-OCT volumes define the optic disc margin in the normal monkey eye.
Figure 2. Two principal Border Tissue configurations, their relationship to a pigmented or unpigmented extension of Bruch’s Membrane and the resultant clinical disc margin anatomy.
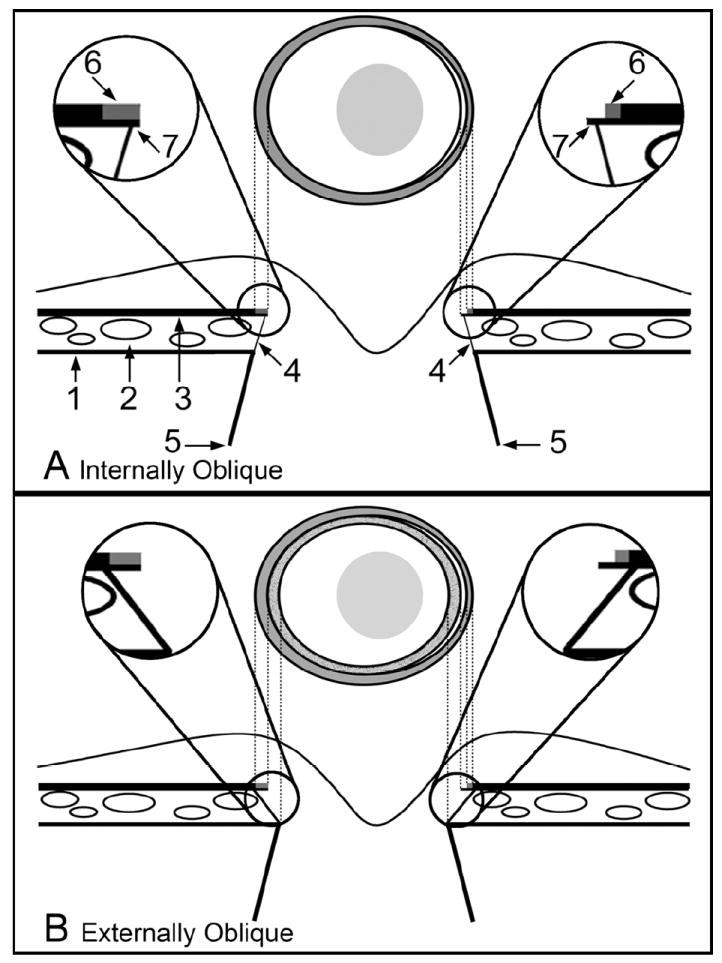
A. Internally Oblique
- 1 = Sclera
- 2 = Choriocapillaris
- 3 = Retinal pigment epithelium with Bruch’s Membrane
- 4 = Border Tissue
- 5 = Neural canal boundary
- 6 = Pigment on the surface of Bruch’s Membrane
- 7 = Bruch’s Membrane
Magnified Inset Left – pigmented Bruch’s Membrane corresponds to the halo of pigment on the left side of the disc margin
Magnified Inset Right – a region of unpigmented Bruch’s Membrane is shown; this corresponds to a white crescent internal to the pigment halo at the disc margin (which corresponds to a portion of pigmented Bruch’s Membrane)
B. Externally Oblique
Labeling is as per the schematic in panel A
Magnified Inset Left – Bruch’s Membrane is pigmented to its end and extends beyond the termination of the Border Tissue. This Bruch’s Membrane extension corresponds to an external crescent of pigment at the disc margin that is internal to the termination of the retinal pigment epithelium. The portion of the Border Tissue that is internal to the end of Bruch’s Membrane (BMO) may be clinically recognizable as an inner reflective (if there is no pigment on the Border Tissue surface) or a pigmented crescent (if there is pigment on the Border Tissue surface) that is posterior to the plane of the retinal pigment epithelium. An inner pigmented halo (lighter grey and stippled) is shown on both sides of the disc diagram
Magnified Inset Right– unpigmented Bruch’s Membrane extends internally to the Border Tissue termination, corresponding to a reflective crescent internal to the pigment crescent. Again, pigmented Border Tissue (lighter grey and stippled) extends internal to the reflective crescent. In both the left and right insets the Border Tissue/scleral junction is depicted without a true scleral lip which when present and visible, appears internal and deep to the other structures.
Figure previously published in: Strouthidis NG, Yang H, Downs JC, Burgoyne CF. Comparison of Clinical and Three-Dimensional Histomorphometric Optic Disc Margin Anatomy. Invest Ophthalmol Vis Sci 2009;50:2165-2174. © Association for Research in Vision and Ophthalmology
METHODS
Animals
The Institutional Animal Care and Use Committee (Legacy Healthcare System) approved this study and all animals were treated in accordance with the ARVO statement for the use of animals in ophthalmic and vision research. All eyes were SD-OCT imaged in vivo as part of other ongoing research studies. Data from thirty-three normal eyes of twenty-four rhesus macaque monkeys were included. For each eye, SD-OCT volumes were compared to optic disc stereophotographs as detailed below.
Imaging
All imaging was performed while the animal was under pentobarbital or isoflurane anesthesia. The intraocular pressure in the imaged eye was set at 10 mmHg via a manometer connected to a 27 gauge cannula inserted into the temporal anterior chamber. Pupils were dilated with 1 drop each of 1% tropicamide, 2.5% phenylephrine hydrochloride, and 2% cyclopentolate hydrochloride. Images were acquired through a rigid plano contact lens placed on the corneal surface, after at least 30 minutes of IOP stabilization. Stereophotographic pairs were acquired using a Topcon TRC-WT Retinal Camera (Topcon, Paramus, NJ). These images were captured onto 35mm slide film which was developed and processed into color slides. SD-OCT imaging of the ONH was performed using a commercially available Spectralis SD-OCT device (Heidelberg Engineering, Heidelberg, Germany). The technical specifications of the Spectralis device have been covered in detail elsewhere.10, 11 Briefly, the Spectralis uses an 870 nm semi-luminescent diode light source; its optical resolution is approximately 7 μm in depth and 14 μm transversely. For this study, 290 individual horizontal B-scans were acquired over a 15° retinal window (768 A-scans per B-scan, each B-scan was acquired 9 times and averaged for speckle noise reduction). In this scan pattern, the Spectralis software automatically registers all acquired B-scans relative to each other in the z-axis. All image acquisitions were well centered on the ONH and this scan location was consistent in all images used in this study.
Delineation of Disc Margin Structures Within SD-OCT Volumes
Our delineation method within SD-OCT images has been described in detail elsewhere.8 Briefly, a 3-D SD-OCT volume was constructed from each 290 horizontal B-scan set using our custom-built, ‘Multiview’ 3-D visualization and delineation software based on the Visualization Toolkit (VTK, Clifton Park, NY). Forty interpolated radial sections (4.5° intervals) were generated from each 3-D SD-OCT volume, centered at the geometric center of origin of each volume. A single experienced operator (NGS) manually delineated all of the volumes. No contour smoothing filtering techniques were applied to the interpolated data.
Figure 1 compares a horizontal B-scan with a comparable sagittal serial histological section taken from the same normal monkey ONH. This eye has not been included in the current study and is used for illustrative purposes only; a detailed account of the comparison between serial histology and SD-OCT B-scans in this eye will be the subject of a future report. Figure 1B illustrates that SD-OCT is capable of identifying both the termination of the RPE/BM complex (NCO, marked with arrows) and the Border Tissue (marked with arrowheads). The anterior scleral canal opening, which is defined as the internal boundary of the anterior scleral surface, is not detectable in this particular representative B-scan. For each SD-OCT volume, the operator identified and delineated the NCO (defined as the innermost extent of the posterior surface of the RPE/BM complex) within each interpolated radial SD-OCT section (Figure 1B, arrows). There are therefore two NCO points within each a single radial SD-OCT section, one on either side of the neural canal, yielding 80 NCO points per volume. In sections where the innermost (most axial) extent of an externally oblique Border Tissue was observed to extend further into the neural canal than the NCO point on that side, the innermost termination of the Border Tissue was also delineated. Within the SD-OCT radial sections, Border Tissue was defined as the transition from high to low intensity signal at the junction of the choroid and the neural canal, visible inferior to the RPE/BM complex (Figure 1B, arrowheads). Figure 3 demonstrates the distinction between internally and externally oblique Border Tissue within a different SD-OCT B-scan and serial en face (transverse) SD-OCT C-scans relative to their respective features within a disc photograph.
Figure 3. The disc photograph (Panel A) and spectral domain OCT (Panels B and C) appearance of internally oblique and externally oblique Border Tissue in the normal monkey eye.
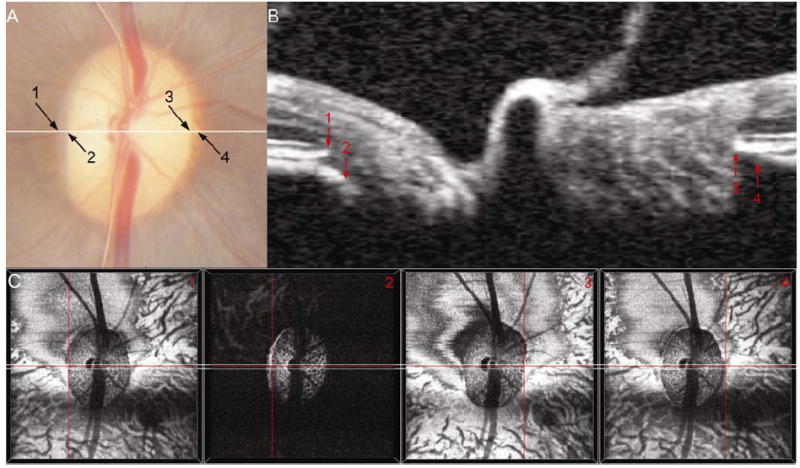
Externally Oblique: In Panel A, arrow 1 marks a thin pale crescent, which is located at the same stereoscopic depth as the retinal pigment. Internal to this is a pigment crescent deep to the retinal pigment; the end of this pigment is the temporal disc margin (arrow 2). In a co-localized horizontal B-scan (panel B, location of B-scan shown by a white line in panel A), an externally oblique Border Tissue configuration is seen temporally. Arrow 1 marks the location of the neural canal opening (NCO) temporally and arrow 2 marks the position of the Border Tissue, which can be seen to extend internal to the NCO. In the disc photograph (panel A), the pale crescent labeled 1 is a stripe of unpigmented Bruch’s Membrane – external to this is pigmented Bruch’s Membrane continuous with the retinal pigment epithelium. The pigment crescent internal to 1 is caused by pigment on the surface of an externally oblique Border Tissue. Panels C1 and 2 show the location of these structures (at the center of the red cross-hairs) within the en face OCT images. Note that the externally oblique Border Tissue (Panel C2) is visible as a high intensity signal, internal to and at a greater depth than, the NCO (Panel C1).
Internally Oblique: In Panel A, arrow 3 highlights the disc margin location, which is at the termination of a crescent of mottled pigment, visible at the same depth as the retinal pigment. Within the B-scan (Panel B), internally oblique Border Tissue can be clearly seen at the nasal side of the neural canal. Arrow 3 shows the termination of the retinal pigment epithelium/Bruch’s Membrane (NCO). The internally oblique Border Tissue can be seen to meet the retinal pigment epithelium/Bruch’s Membrane signal external to the NCO (arrow 4) and to extend away from the neural canal. The pigment crescent at the nasal disc margin represents a region of pigmented Bruch’s Membrane. The region of Bruch’s Membrane ‘overhang’, beyond the point where Border Tissue meets Bruch’s Membrane is visible as a dark crescent in the en face OCT image (panel C4), external to the NCO (panel C3).
Once manual delineation was completed, the Cartesian coordinates for each delineated point (both NCO and Border Tissue) were saved, allowing a 3-D point cloud to be generated.6
Co-localization of SD-OCT Volumes to the Disc Photographs
For each eye, a stereophotograph pair was selected in which at least one photograph in the pair had sharply defined central retinal vessels. A good stereo effect and a clear focus at the disc margin were desirable secondary considerations but their absence was not grounds for exclusion. The selected stereophotograph slides were digitized at a resolution of 4800 dpi using a color-calibrated Microtek ArtixScan M1 slide scanner (Microtek Lab, Inc., Fontana, CA) and the disc image with the most clearly resolved disc margin was selected for the purposes of co-localization.
Each SD-OCT ONH volume was viewed in the en face orientation and the z-axis depth was adjusted until the outline of the central retinal vessels was clearly visible. Two en face OCT images were acquired; one showing the vessel outlines and the other showing all of the delineated glyphs. The two images were overlaid using Adobe Photoshop CS3 (Adobe Systems, Inc., San Jose, CA) to create a perfectly aligned two-layer image file. The disc photographs were then overlaid onto their respective SD-OCT images with the glyphs hidden from view. The same operator (NGS) performed the initial manual co-localizations. Co-localization required the outline of the central retinal vessels and their bifurcations to be matched between the en face OCT image and the photograph. This was achieved by rotating the photograph image layer, moving it in the x- and y- orientation and by adjusting its magnification in a 1:1 ratio scale. The proximity of alignment between image layers was verified by reducing the opacity of the clinical image so as to view the two overlaid images simultaneously. In order to not prejudice the co-localization process, the SD-OCT delineation glyphs were hidden throughout. At the completion of co-localization, the co-ordinates of the SD-OCT delineations were saved and the glyphs were transferred onto the clinical image. The co-localization process is illustrated in Figure 4A - 4C.
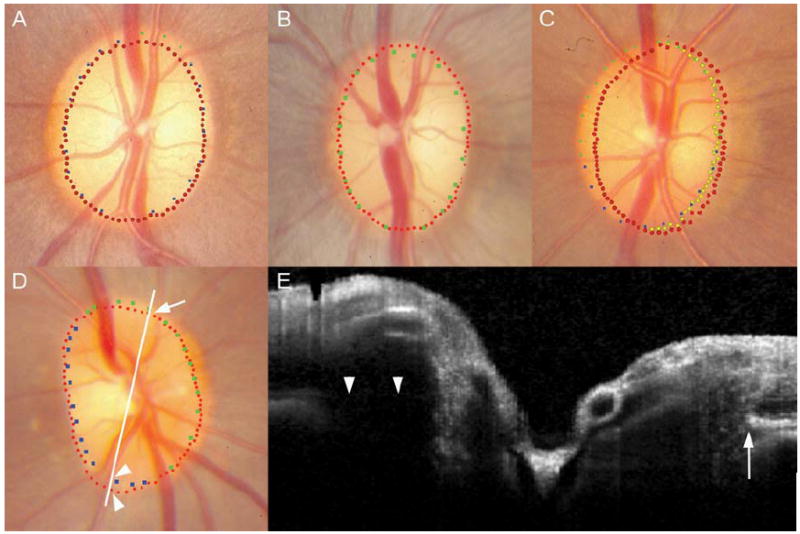
Figure 4. The co-localization and disc margin delineation process.
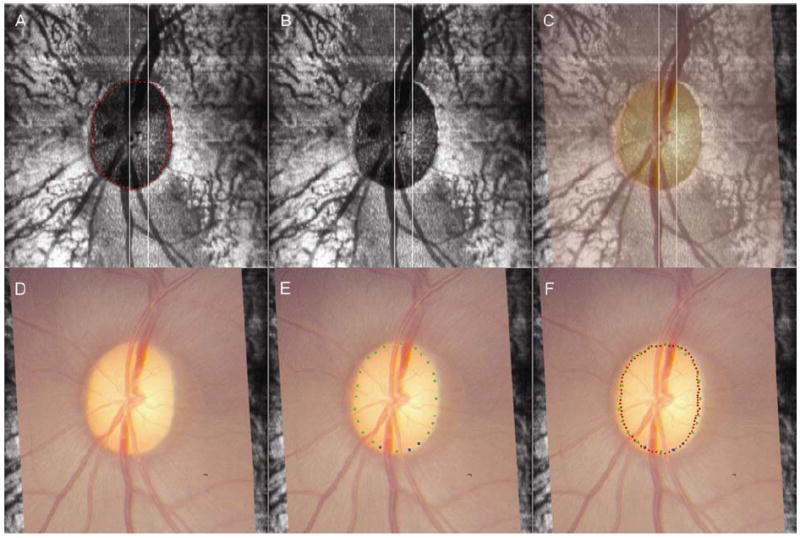
Panel A shows the location of the neural canal opening points (NCO, visible as red glyphs) within an en face OCT image. During co-localization, the en face OCT image is used with the NCO glyphs not visible (Panel B). Panel C shows the clinical photograph, at 50% opacity, laid onto the en face OCT image. By adjusting x- and y- axis shifts, z-axis rotation and by scaling at a 1:1 ratio, the central retinal vessels are matched between the photograph and the en face OCT image. The disc photograph, co-localized to the en face OCT image is then presented to the clinical observer for disc margin delineation (Panel D). Whilst delineating the disc margin, the observer simultaneously views the representative stereophotograph pair. Panel E shows completed disc margin delineation, with blue glyphs representing ‘certainty’ regarding disc margin location and green glyphs representing ‘forced choice’. Once disc margin delineation is completed, the co-localized OCT delineated points are revealed, so that their alignment to the disc margin can be compared (Panel F). In this case, the spectral domain OCT-defined NCO is well aligned to the disc margin, as there is less than a glyph’s separation between adjacent glyphs for 360° of the disc margin.
Delineation of the Disc Margin
An experienced clinical observer (CFB) viewed each eye’s digitized stereophotograph pair on a computer monitor using a Screen-Vu stereoscope (PS Mfg., Portland, OR). In order to ensure that the observer had an optimal view of the disc margin, he also had access to a number of alternative stereophotograph slides, which could be viewed using a hand-held stereo viewer (Asahi-Pentax Co., Englewood, CO). For each eye, the observer delineated the disc margin present in the co-localized clinical photograph (with the SD-OCT delineations hidden, Figure 4D) using a custom-built application designed to capture the x and y coordinates of each selected point. The observer could classify the marks as ‘certain’ (blue) or ‘uncertain’ (green) in which case a ‘forced’ choice was made (Figure 4E). There were no constraints on the number of points the observer needed to delineate in each photograph. The observer defined the disc margin as the innermost reflective structure that extended beyond the internal termination of pigment at the disc periphery; in doing so the observer delineated what clinicians interpret as Elschnig’s ring. Where a reflective structure was absent, the observer selected the termination of pigment as the disc margin. The collected coordinates of the marked points were saved and the points were transferred onto the disc photograph image in which the SD-OCT delineation glyphs were also shown. An image of the disc photograph incorporating both the co-localized SD-OCT delineations and the disc margin demarcations was then saved for each eye (Figure 4F).
Subjective Assessment of Alignment of SD-OCT Delineations to the Disc Margin
Two observers (NGS and CFB) qualitatively reviewed the disc photographs incorporating the SD-OCT delineations and the disc margin delineations. This was performed to assess how well the co-localized SD-OCT NCO or Border Tissue delineations aligned to the disc margin. The observers classified good alignment as where there was less than a glyph’s diameter separation between the SD-OCT glyph (either NCO or Border Tissue) and the nearest adjacent disc margin glyph in all disc sectors. When the two dimensional SD-OCT image is projected onto the disc photograph in the purpose-built disc margin delineation software, a universal 1:1 pixel ratio was applied. This was performed so as to negate any discrepancy in glyph diameter caused by SD-OCT scaling issues related to differences in monkey axial lengths. The glyphs in this program are 5 pixels in diameter, meaning that this is the minimum resolvable separation between adjacent glyphs. Disc sectors were defined according to 0° (vertical), 45°, 90° (horizontal) and 135° axes applied to the clinical photograph, generating superior, inferior, superotemporal, inferotemporal, temporal, nasal, superonasal and inferonasal disc sectors. Where the SD-OCT NCO delineations aligned to the disc margin delineations, the NCO was defined as the anatomical basis for the disc margin in that region. Where both the NCO and the termination of an externally oblique Border Tissue had been marked, the landmark most closely aligned to the disc margin delineation was defined as the anatomical basis of the disc margin in that region. In eyes where good alignment was not observed for 360° of the disc margin, the number of sectors where there was a greater than one glyph diameter separation between SD-OCT and disc margin glyphs was recorded. In order to identify causes for discrepancy in these regions of the disc, the relevant stereophotographs and B-scans were systematically re-examined, examples of which are discussed below.
Quantification of Alignment of SD-OCT Delineations to the Disc Margin
In addition to the subjective assessment described above, an attempt was made to quantify the degree of alignment between the clinician’s disc margin and the SD-OCT delineations. For the purposes of this analysis, all images were configured into the right eye orientations. The two-dimensional co-ordinates of all glyphs in x- and y-space were transferred to Matlab (Matlab Mathworks, Natick, MA). B-spline curves were fitted between glyphs so that three different continuous curves were generated for each co-localized image. In all images, a continuous disc margin curve and a continuous SD-OCT NCO curve were generated. In those eyes in which externally oblique Border Tissue had been delineated, a third continuous curve was generated which incorporated the Border Tissue (where present) as well as the NCO in the remainder of the disc. The alignment ‘error’ was assessed along radial spokes generated at 4.5° intervals, from the center of the clinician’s disc margin to the disc margin curve, commencing at the temporal meridian (0°) and proceeding in a counter-clockwise fashion. Alignment error at each spoke was expressed as the distance between the disc margin curve and the SD-OCT curve along the spoke, expressed as a percentage of the spoke length from the center of the disc margin to the disc margin curve (Figure 5). Percentage alignment error relative to disc margin radius was measured globally and regionally across all eyes (analyses performed using R, R Foundation for Statistical Computing, Vienna, Austria).
Figure 5. Schematic to illustrate the estimation of alignment error in the superonasal quadrant of a co-localized image (all images in right eye orientation – all four quadrants used in the analysis, not shown in diagram).
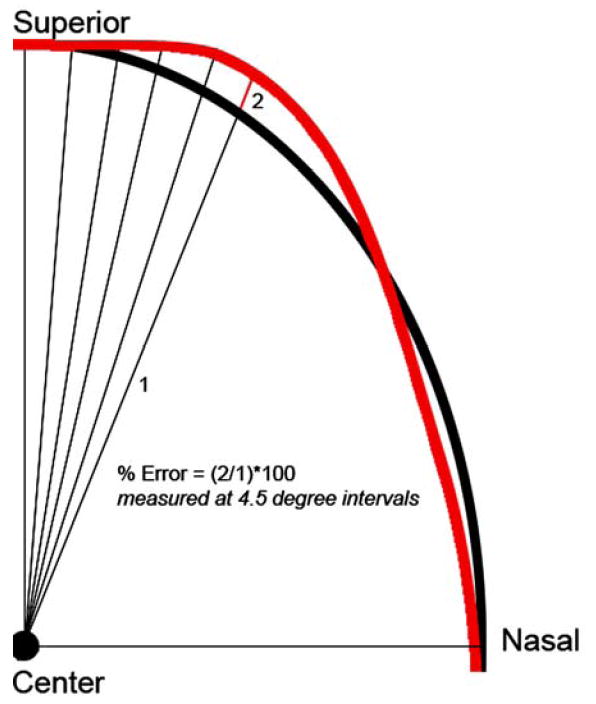
The clinician-ascribed disc margin is shown in black and the SD-OCT delineated curve is shown in red. Radial spokes are generated from the center of the disc margin at 4.5° intervals from the temporal meridian Alignment error is the distance between the clinician’s disc margin and the SD-OCT curve (the red line – 2), expressed as a percentage of the disc radius (the black line marked – 1). The alignment errors are calculated for each radial spoke enabling an estimation of global and regional alignment error for each eye.
SD-OCT Disc Margin Anatomy in A Myopic Human Eye
To extend our findings to the human ONH and to better demonstrate their clinical implication, the same operator (NGS) delineated an SD-OCT volume acquired from a myopic human eye (optical refraction, -9.00/-1.00 D × 90°, axial length 29.04 mm). The SD-OCT volume was generated from 97 horizontal B-scans acquired over a 15° by 10° retinal window (768 A-scans per B-scan, each B-scan acquired 25 times and averaged). Human SD-OCT imaging was performed at Dalhousie University, Halifax, Nova Scotia, Canada where there was regional Ethics Committee approval and the subject gave his informed consent.
In addition to the NCO, the full extent of the Border Tissue was delineated, regardless of whether it was internally or externally oblique or if it extended beyond the NCO. The anterior scleral canal opening (the innermost extent of the anterior scleral surface) was detectable in this eye so was also delineated within each radial SD-OCT section (blue glyphs). These additional delineations were performed because of the complexity of the anatomy in this eye, compared to the normal monkey eyes. Following delineation of these landmarks, the en face SD-OCT image was co-localized to the disc photograph, and the clinician (CFB) marked the disc margin, masked to the SD-OCT landmarks, using exactly the same protocol as per the monkey eyes.
RESULTS
Assessment of Alignment Between SD-OCT and Disc Margin Delineations In Monkey Eyes
In 18 eyes, the delineated NCO was well aligned (within one glyph diameter) to 360° of the disc margin (6 examples are illustrated in Figure 6A). In 5 other eyes, NCO was misaligned from the disc margin in a single sector of the disc (examples shown in Figures 6A, 6B and 6D), but was well aligned to the remaining circumference of the disc margin.
Figure 6. Examples of good alignment between disc margin delineations and spectral domain OCT delineations.
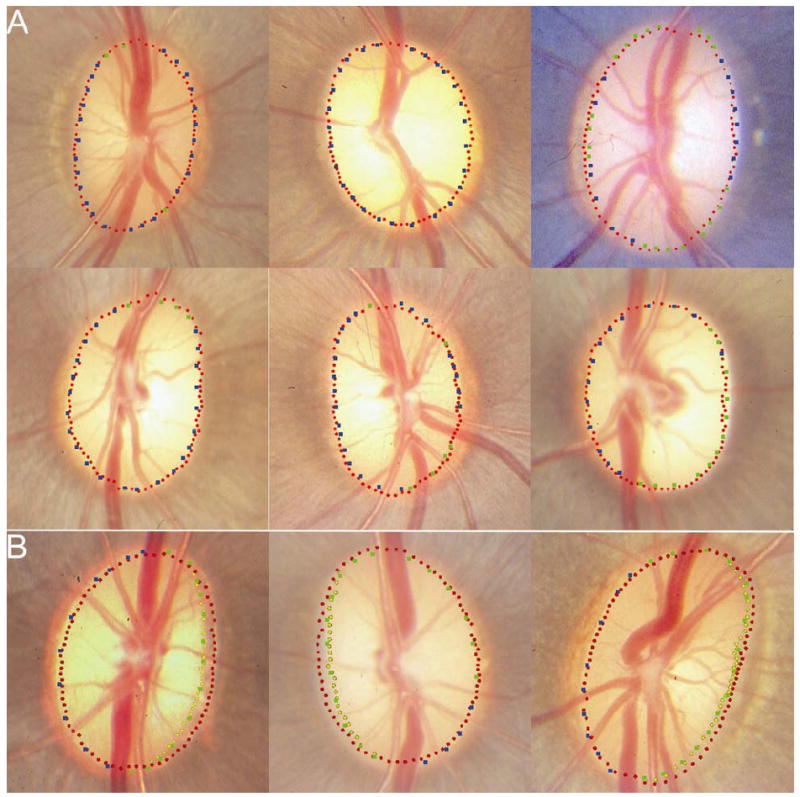
Panel A shows 6 discs where the neural canal opening (NCO – red glyphs) aligns to within one glyph’s diameter for 360° of the disc margin (blue glyphs – ‘certain’ disc margin location; green glyphs – ‘forced choice’ disc margin location). Panel B shows 3 examples where the termination of externally oblique Border Tissue (yellow glyphs) aligns to the temporal disc margin and the NCO aligns to the remainder of the disc margin.
A region of externally oblique Border Tissue extending internal to the NCO was detectable by SD-OCT in 10 eyes. In all cases, the region of externally oblique Border Tissue was located in the temporal half of the disc. Within these 10 eyes, where an externally oblique Border Tissue was delineated, the termination of Border Tissue rather than the NCO aligned to the disc margin. In 8 of these eyes, the NCO aligned well to the remainder of the disc where Border Tissue had not been delineated (Figure 6B). In one eye, the NCO and the disc margin were misaligned in a single sector. In the remaining eye, misalignment (greater than two glyphs’ diameter separation) between the NCO and the disc margin was encountered in the nasal half of the disc.
The mean percentage alignment error (distance between the SD-OCT delineations and the disc margin, expressed as a percentage of the center of the disc to the disc margin) was 3.8 % +/- 1.2 %. Figure 7 illustrates the regional alignment error for all of the eyes in the study. Absolute alignment error has been estimated using the moving average generated from each corresponding 4.5° location and the two locations either side of it (in other words a moving average based on 5 consecutive locations). In Figure 7 the median (middle lines), 95 % (upper lines) and 5 % (lower lines) quantiles for alignment error are shown. Median alignment error was less than 5%, with greatest misalignment of the NCO (solid lines) occurring in the temporal, inferotemporal and superotemporal regions. The misalignment in these regions was considerably reduced when the disc margin was compared to externally oblique Border Tissue (dotted lines).
Figure 7. Regional alignment error for all eyes included in the study.
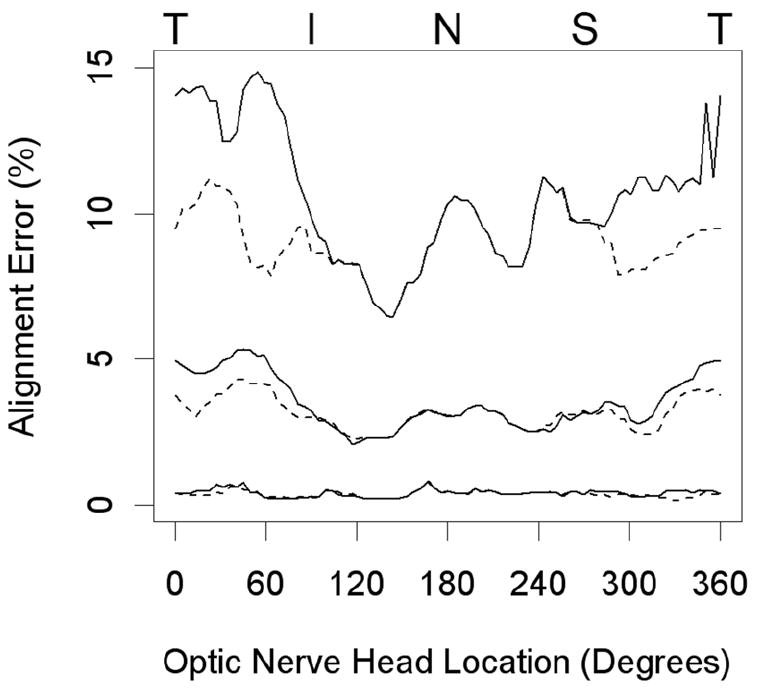
The lines shown are for the median (middle lines), 95 % (upper lines) and 5 % quantiles of alignment error. This is measured at each 4.5° location as a moving average of that location and the 2 locations either side of it. Solid lines indicate the degree of misalignment from the disc margin of the curves generated by the neural canal opening, whereas the dotted lines indicate the degree of misalignment from the disc margin of the curves generated by a combination of the neural canal opening and the Border Tissue. (T = temporal, I = inferior, N = nasal, S = superior)
Sources of Misalignment
In 5 of the 6 eyes where misalignment of the NCO to the disc margin was present in a single disc sector, the disc margin had been marked using green glyphs. This indicates that the clinical observer was not certain of the location of the disc margin in that region. These misalignments were all located at either the superior or inferior pole of the disc (two examples shown in Figure 8A and 8B). In the normal monkey, the retinal nerve fiber layer can be very thick where it enters the disc at the poles, making it difficult to clearly visualize the disc margin in stereophotographs. It is possible that this may explain the misalignment in these 5 cases. It should, however, be noted that the degree of misalignment is fairly minimal, amounting to less than two glyphs’ diameter separation.
Figure 8. Examples of misalignment between the disc margin and spectral domain OCT delineations.
In panel A, the neural canal opening (NCO) is internal to the disc margin, beyond one glyph’s diameter, at the superior pole. In Panel B, the NCO is misaligned at the superior pole. In both cases, the remainder of the disc margin is well aligned to the NCO. A possible reason for misalignment in these two cases is the fact that the disc margin may be indistinct in regions of the disc poles where the nerve fiber layer is particularly thick. Panel C shows a left disc where the NCO is misaligned from the nasal disc margin. It is possible in this case that a wide crescent of unpigmented Bruch’s Membrane was not visible at the nasal disc margin on the stereophotographs but was picked up by spectral domain OCT imaging. In panel D, the NCO at the inferior pole is external to the disc margin, which had been marked ‘with certainty’ (blue glyphs) in this region. When examining the B-scan (Panel E) acquired at the location highlighted by the white line in the disc photograph, the superior NCO, which is aligned to the disc margin, is clearly visible (white arrows). The inferior NCO and the retinal pigment epithelium/Bruch’s Membrane complex are obscured by a shadow cast by a blood vessel (white arrowheads), causing difficulties in accurate delineation of the NCO.
In the remaining eye in which misalignment was confined to a single sector, the disc margin in the misaligned sector had been delineated using blue glyphs. This indicates that the clinical observer was ‘certain’ of the disc margin location (Figure 8D). Within the radial B-scans at that location, a substantial ‘shadow’ cast by a blood vessel made precise delineation of the NCO difficult (Figure 8E). This problem was not encountered in the remaining SD-OCT ONH volumes examined in this study.
The reason for the misalignment between the SD-OCT defined NCO and the nasal disc margin in one eye was less apparent (Figure 8C). The degree of misalignment was too large to be explained by either the small margin of error inherent in the co-localization process or the potential differences in the size of vessels at the time of SD-OCT imaging relative to their size at the time of stereophotography.
Assessment of Disc Margin Anatomy in A Myopic Human Eye
The relationships between the photographic disc margin and the SD-OCT NCO, Border Tissue and anterior scleral canal opening delineations are illustrated in Figures 9A - 9C. The 3-D anatomy of this myopic human ONH was ascertained from the point cloud generated from the delineated NCO, Border Tissue and anterior scleral canal opening (Figures 9D - 9E). An exaggerated obliquity of the neural canal was clearly visible in the 3-D point cloud.
Figure 9. SD-OCT disc margin anatomy in a myopic human left eye.
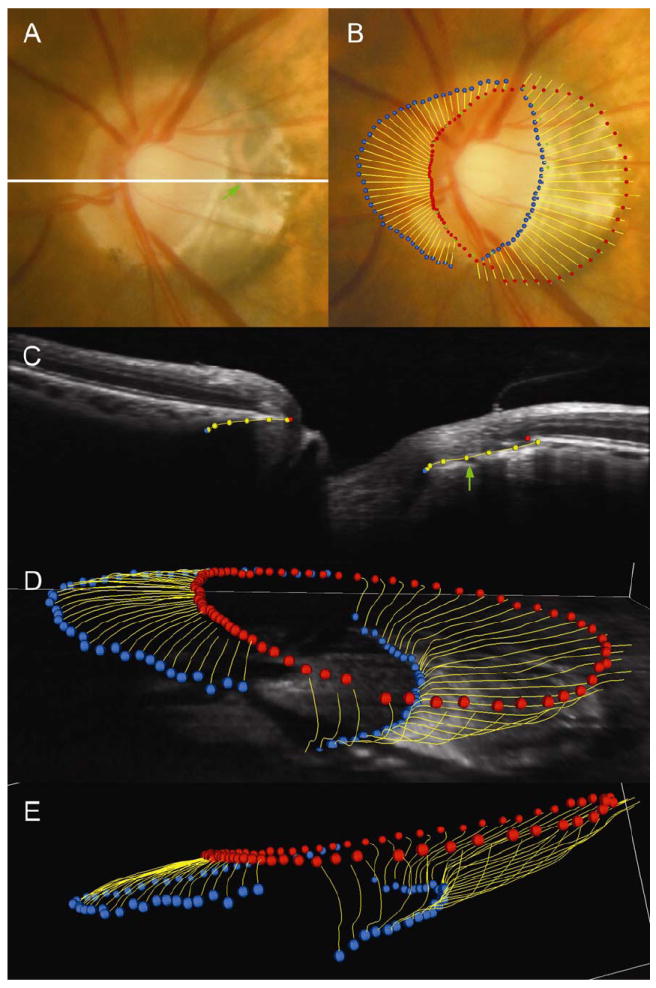
Panel A shows the disc photograph; a white line highlights the location of the B-scan shown in panel C. Panel B shows the alignment of the disc margin (blue and green square glyphs) to the spectral domain OCT delineations. In panels B, C (the representative B-scan), D and E (three-dimensional point clouds) circular red glyphs are the neural canal opening (NCO), circular blue glyphs are the anterior scleral canal opening and yellow lines represent the full extent of the Border tissue. In panel B, the anterior scleral canal opening, at the termination of externally oblique Border Tissue, can be seen to align to the temporal disc margin. This is seen clinically as a ‘true’ scleral lip at the disc margin. The NCO is aligned to the nasal disc margin. A green arrow shown in panel C highlights the location of a choroidal vessel within the Border Tissue signal which is also shown in its co-localized position within the disc photograph (Panel A). Panels D and E are three-dimensional point clouds generated from the delineation of the spectral domain OCT images.
As in 10 of the monkey eyes, externally oblique Border Tissue was present in the temporal half of the disc whereas an internally oblique Border Tissue was present in the nasal half of the disc. However, the extent and degree of obliquity of the Border Tissue far exceeded that seen in the normal monkey eyes.
In this eye, the temporal NCO coincided with the termination of retinal pigment (Figure 9B). The Border Tissue delineations in the temporal disc extended downward and internal to the NCO where they corresponded to a region of atrophy evident in the photograph. In this region, large underlying choroidal vessels were visible. The temporal disc margin corresponded to the anterior scleral canal opening located at the innermost termination of the externally oblique Border Tissue. In the disc photograph, the anterior scleral canal opening was visible as a distinct white crescent internal to the variably pigmented Border Tissue. In this eye, this landmark represents a true ‘scleral lip’ or ‘scleral crescent’ as has been classically described.1, 3, 12
In the nasal half of the disc, the internally oblique Border Tissue can be seen to sweep external to the NCO, terminating at the anterior scleral canal opening. Within these sectors the NCO corresponded to the disc margin.
DISCUSSION
The principal findings of this study may be summarized as follows. Border Tissue and NCO anatomy was well visualized by volumetric SD-OCT imaging in monkey eyes. The anatomic underpinnings of the disc margin were regionally variable depending upon Border Tissue obliquity as detected by SD-OCT. Finally; these findings could be utilized to explain the much more complicated anatomy of a single myopic human eye.
The findings of this study are consistent with the results of our previous assessment of disc margin anatomy using 3-D histomorphometric reconstructions.6, 7 Chiefly, the NCO (equivalent to the BMO in the monkey eye) corresponded to the disc margin in the majority of monkey eyes. Where an externally oblique Border Tissue extended into the neural canal internal to the NCO, the disc margin was comprised of the innermost termination of the Border Tissue and the anterior scleral canal opening (where visible). This orientation was observed in approximately one third of the monkey eyes examined in this study and was invariably located in the temporal half of the disc. An extreme form of this phenotype was also seen in the myopic human eye.
Our findings suggest that disc margin anatomy is consistently detected within SD-OCT volumes. SD-OCT volumes therefore have the potential to inform the clinician of the true location of the disc margin in circumstances where defining the disc margin either by fundoscopy or within a disc photograph is difficult. This has important implications in the management of glaucoma patients as it will enable a precise identification of the peripheral boundary of neural tissue in the disc and will allow accurate placement of the contour line in optic disc images used in the quantitative assessment of glaucomatous progression.
In only one monkey eye did the SD-OCT misalign to the clinician’s ascribed disc margin in more than one sector of the disc. In this case, externally oblique Border Tissue co-localized to the temporal disc margin whereas the SD-OCT defined NCO was located at a considerable distance internal to the disc margin nasally. Given the overwhelming consistency regarding the relationship between the NCO, Border Tissue and the disc margin in the remaining SD-OCT volumes as well as in 3-D histomorphometric volumes,7 it is unlikely that the disc margin is the ring of Elschnig nasally. The most valid interpretation in this single exception is that a wide extension of unpigmented Bruch’s Membrane, beyond the termination of retinal pigment epithelium, was detectable by SD-OCT but was not visible within the stereophotograph. As such, the nasal disc margin may have been marked too externally in that disc photograph. Unfortunately the animal concerned was sacrificed on schedule for a separate study prior to the completion of this study, so we were unable to confirm the exact location of the nasal disc margin by stereoscopic ophthalmoscopy.
In our previous examination of the disc margin by 3-D histomorphometry, we proposed that the reason for a tendency towards having an internally oblique neural canal orientation nasally and an externally oblique orientation temporally was likely due to an anatomical adaptation to facilitate passage of optic nerve axons to reach the chiasm, a midline structure.7 This explanation is supported by the results obtained from delineating a myopic human eye. In this case, the optic nerve axons may need to exit the eye in a more extreme oblique direction towards the midline because of the large size of the myopic globe.
When examining the 3-D point cloud generated from the human SD-OCT ONH volume, it is apparent that there are a number of potential ‘apertures’, through which the axons traverse as they pass through the neural canal and then exit the eye through the scleral canal. The first ‘aperture’ is the NCO; this represents the point at which retinal nerve fiber axons change direction to enter the ONH. The NCO is equivalent to the termination of Bruch’s Membrane in our histomorphometric volumes. Within SD-OCT volumes, the innermost termination of the presumed RPE/BM signal was delineated as the NCO. In most cases, the NCO co-localized to a point on the disc photograph beyond the apparent termination of the visible retinal pigment. We interpret this to mean that portions of Bruch’s Membrane may be detectable by SD-OCT, beyond the termination of the retinal pigment epithelium.
Our study uses SD-OCT imaging to confirm our previous histomorphometric report that the disc margin is not a single anatomic structure.7 These data suggest that in regions of the disc where the Border Tissue is externally oblique, the Border Tissue or anterior scleral canal opening will represent the disc margin. Where Bruch’s Membrane extends beyond the termination of Border Tissue (whether internally or externally oblique), the NCO will represent the disc margin.
While both the NCO and the disc margin are clinically visible, we believe that it is important to recognize them as independent landmarks. Firstly, we predict that the NCO and not the disc margin will become the basis for an SD-OCT reference plane for both ONH and peripapillary retinal nerve fiber layer quantification. Furthermore, we believe that clinical co-localization of SD-OCT detected disc margin anatomy will inform the clinician’s interpretation of the disc in eyes with tilted, highly myopic or glaucomatous ONH.
It should be noted that it is possible for an experienced clinician to differentiate between the different anatomical components of a disc margin by judging the stereoscopic ‘depth’ of the disc margin relative to the retinal pigment. Where the NCO comprises the disc margin, the termination of Bruch’s Membrane will be located at the same depth as the retinal pigment. Where the disc margin is at a deeper level (more posterior) than the retinal pigment, it will comprise externally oblique border tissue or the scleral canal opening.
The neural canal extends posteriorly from the NCO to the anterior scleral canal opening, with neural tissue separated from the choroid by the Border Tissue. The scleral canal further extends from the anterior scleral canal opening to the posterior scleral canal, with the nerve passing through the full thickness of the sclera.6 The anterior scleral surface and the anterior scleral canal opening were not discernible in the monkey eyes examined in this study whereas they were detected in the myopic human eye. We are currently unable to detect the posterior scleral surface and posterior scleral canal opening using 870 nm SD-OCT. However, this may be possible using a 1050 nm light source, which has been reported to achieve increased axial depth penetration.13-16 An ability to fully image the scleral canal (from anterior to posterior scleral canal openings) may be potentially useful in the detection of glaucoma progression as scleral canal expansion has been identified as a feature of chronic IOP elevation in monkey eyes using 3-D histomorphometric reconstructions.6, 17
Manassakorn and co-workers compared the disc margins delineated in the disc photographs of 17 normal human eyes with the disc margins identified in scans acquired using a novel high speed, ultra-high resolution OCT device.18 In their study, the termination of the retinal pigment epithelium at either side of the ONH was manually delineated within the 180 consecutive horizontal raster frames within each scan volume. The x-axis co-ordinates of these delineations were used to transfer these locations onto the en-face OCT image generated from the completed volume. The en face OCT image was co-localized to the disc photograph without viewing any of the delineations, as in our study. In the 17 eyes studied by Manassakorn and co-workers, the disc area identified by the cross-sectional OCT images was significantly larger than that identified using the disc photographs, although the geometric center of the disc margin was similar using both techniques. The authors suggested that the cross-sectional OCT disc margins might have larger dimensions than the photograph-defined disc margin because of difficulties delineating the termination of retinal pigment epithelium under large vessel shadows and in areas of peripapillary atrophy.
Peripapillary atrophy was not a feature of any of the monkey eyes examined in our study and we encountered difficulty in identifying the NCO because of vessel shadowing in only a single region of one disc. In our study, the detection of NCO despite the presence of retinal vessel shadowing may be due to the density of the B-scans acquired, which exceeds what has been attempted to date in human subjects. It is also possible that the Bruch’s Membrane underlying the retinal vessels in the monkey eye is more reflective than in the human, rendering the signal detectable despite the presence of vessel shadowing.
Our delineation of the ‘disc margin’ within B-scans also differed in that we not only delineated the NCO, but also regions where the Border Tissue extended further into the canal than the termination of the RPE/BM complex. It is possible that in some of the eyes examined in Manassakorn and co-workers’ study, a portion of the disc margin circumference was comprised of externally oblique Border Tissue. If only the termination of the retinal pigment epithelium was marked in these regions, which would have been outside of the termination of the externally oblique Border Tissue, then it would result in an erroneously large disc area when compared to the photographic disc area.
Subsequently, Kotera and colleagues have compared the photographic disc margin with the SD-OCT defined disc margin in 18 glaucomatous eyes.19 In that study, a high concordance between the photographic disc margin and the SD-OCT disc margin was found. Unlike the previous study, the observers delineated either the termination of the retinal pigment epithelium or the termination of the “highly reflective, curved line”, which connected to the straight signal identified as the retinal pigment epithelium. We believe that this highly reflective, curved line is the signal we have identified as Border Tissue in our study.
Kotera and colleagues additionally highlighted circumstances where the termination of the retinal pigment epithelium identified by SD-OCT coincided with the termination of visible retinal pigment at the edge of peripapillary atrophy. We observed the same finding in the myopic human eye examined in this study, with the temporal NCO co-localizing to the edge of the peripapillary atrophy. The appearance of this disc is in keeping with the concept of ‘simple misalignment’ of the sclera, choroidal and retinal pigment epithelium layers caused by the oblique exit of the nerve in an axially myopic eye.3 We have identified this curved high intensity signal as Border Tissue, as opposed to choroid or sclera, as large choroidal vessels were visible posterior to this signal. These choroidal vessels co-localized to the correct location in the clinical photograph, highlighted by a green arrow in Figures 9A and 9C. This suggests that the signal was derived from tissue anterior to both the choroid and the sclera, most likely the compacted connective tissue comprising the Border Tissue.
There are a number of limitations to our methodology that should be considered. In particular, our co-localizations are subject to a degree of inherent variability in part because the caliber of the central retinal vessels is likely to differ between the time of SD-OCT volume acquisition and the time of stereophotography. Also the width of the vessels imaged at the surface of the nerve (as in a photograph) may have differed from the width of vessels at the depth of the en face C-scan used for co-localization. These differences may result in a discrepancy between the magnification of the en SD-OCT image and the disc photograph. Our co-localization technique is also two-dimensional, and so does not take into account the presence of optic nerve head tilt. This was not a problem for the normal monkey eyes, in which tilt was not a feature. It could, however, lead to misalignment in human eyes with more pronounced tilt, although this was not observed in the single eye examined in this study. It may be necessary to further develop our co-localization technique, perhaps using 3-D viewing software, if this is found to be a problem in other human eyes. Finally, both co-localization and disc margin delineation are limited by the quality of the acquired stereophotographs and SD-OCT volumes.
In conclusion, Border Tissue and Neural Canal Opening anatomy are well visualized by volumetric SD-OCT imaging. The anatomic underpinnings of the disc margin vary regionally, and depend upon Border Tissue obliquity which is detected by SD-OCT. These observations held true in the single myopic human eye examined in this study and served to enhance our understanding of its ONH architecture. These findings pave the way for a more detailed exploration of SD-OCT defined disc margin anatomy in normal and myopic human eyes.
Acknowledgments
The authors wish to gratefully acknowledge Galen Williams, Erica Dyrud, Wenxia Wang, Christy Hardin (for SD-OCT imaging) and Dr Balwantry Chauhan (for supplying the human SD-OCT volume and for his careful and considered comments regarding this manuscript).
Grant Information: R01-EY11610, Legacy Good Samaritan Foundation, Heidelberg Engineering and Sears Medical Trust
Commercial Disclosure: NGS is funded by an unrestricted educational grant from Heidelberg Engineering and by a Royal College of Ophthalmologists/Pfizer Fellowship; CFB receives instrument and unrestricted research support but no honoraria or consultant funds from Heidelberg Engineering.
References
- 1.Jonas JB, Airaksinen PJ, Robert Y. Definitionsentwurf der intra- und parapapillären Parameter für die Biomorphometrie des Nervus opticus. Klin Monatsbl Augenheilkd. 1988;192:621. [Google Scholar]
- 2.Anderson DR, Hoyt WF. Ultrastructure of intraorbital portion of human and monkey optic nerve. Arch Ophthalmol. 1969;82:506–530. doi: 10.1001/archopht.1969.00990020508017. [DOI] [PubMed] [Google Scholar]
- 3.Fantes FE, Anderson DR. Clinical histologic correlation of human peripapillary anatomy. Ophthalmology. 1989;96:20–25. doi: 10.1016/s0161-6420(89)32929-0. [DOI] [PubMed] [Google Scholar]
- 4.Nevarez J, Rockwood EJ, Anderson DR. The configuration of peripapillary tissue in unilateral glaucoma. Arch Ophthalmol. 1988;106:901–903. doi: 10.1001/archopht.1988.01060140047021. [DOI] [PubMed] [Google Scholar]
- 5.Burgoyne CF, Downs JC, Bellezza AJ, Hart RT. Three-dimensional reconstruction of normal and early glaucoma monkey optic nerve head connective tissues. Invest Ophthalmol Vis Sci. 2004;45:4388–4399. doi: 10.1167/iovs.04-0022. [DOI] [PubMed] [Google Scholar]
- 6.Downs JC, Yang H, Girkin C, Sakata L, Bellezza AJ, Thompson H, Burgoyne CF. Three Dimensional Histomorphometry of the Normal and Early Glaucomatous Monkey Optic Nerve Head: Neural Canal and Subarachnoid Space Architecture. Invest Ophthalmol Vis Sci. 2007;48:3195–3208. doi: 10.1167/iovs.07-0021. [DOI] [PMC free article] [PubMed] [Google Scholar]
- 7.Strouthidis NG, Yang H, Downs JC, Burgoyne CF. Comparison of Clinical and Three-Dimensional Histomorphometric Optic Disc Margin Anatomy. Invest Ophthalmol Vis Sci. 2009;50:2165–2174. doi: 10.1167/iovs.08-2786. [DOI] [PMC free article] [PubMed] [Google Scholar]
- 8.Strouthidis NG, Yang H, Fortune B, Downs JC, Burgoyne CF. Detection of Optic Nerve Head Neural Canal Opening within Histomorphometric and Spectral Domain Optical Coherence Tomography Data Sets. Invest Ophthalmol Vis Sci. 2009;50:214–223. doi: 10.1167/iovs.08-2302. [DOI] [PMC free article] [PubMed] [Google Scholar]
- 9.Drexler W, Fujimoto JG. State-of-the-art retinal optical coherence tomography. Prog Retin Eye Res. 2008;27:45–88. doi: 10.1016/j.preteyeres.2007.07.005. [DOI] [PubMed] [Google Scholar]
- 10.Heidelberg Engineering. Spectralis Operating Instructions. Version 001. Heidelberg; Germany: 2007. [Google Scholar]
- 11.Fortune B, Cull GA, Burgoyne CF. Relative course of retinal nerve fiber layer birefringence and thickness and retinal function changes after optic nerve transection. Invest Ophthalmol Vis Sci. 2008;49:4444–4452. doi: 10.1167/iovs.08-2255. [DOI] [PMC free article] [PubMed] [Google Scholar]
- 12.Hogan MJ, Alvarado JA, Esperson Weddell J. Histology of the human eye: an atlas and textbook. Philadelphia: W.B. Saunders Company; 1971. [Google Scholar]
- 13.Srinivasan VJ, Adler DC, Chen Y, Gorczynska I, Huber R, Duker J, Schuman JS, Fujimoto JG. Ultrahigh-speed Optical Coherence Tomography for Three-Dimensional and En Face Imaging of the Retina and Optic Nerve Head. Invest Ophthalmol Vis Sci. 2008;49:5103–5110. doi: 10.1167/iovs.08-2127. [DOI] [PMC free article] [PubMed] [Google Scholar]
- 14.Povazay B, Bizheva K, Hermann B, Unterhuber A, Sattmann H, Fercher A, Drexler W, Schubert C, Ahnelt P, Mei M, Holzwarth R, Wadsworth W, Knight J, Russell PSJ. Enhanced visualization of choroidal vessels using ultrahigh resolution ophthalmic OCT at 1050 nm. Opt Express. 2003;11:1980–1986. doi: 10.1364/oe.11.001980. [DOI] [PubMed] [Google Scholar]
- 15.Povazay B, Hermann B, Unterhuber A, Hofer B, Sattmann H, Zeiler F, Morgan JE, Falkner-Radler C, Glittenberg C, Blinder S, Drexler W. Three-dimensional optical coherence tomography at 1050 nm versus 800 nm in retinal pathologies: enhanced performance and choroidal penetration in cataract patients. J Biomed Opt. 2007;12:041211. doi: 10.1117/1.2773728. [DOI] [PubMed] [Google Scholar]
- 16.Wang Y, Nelson J, Chen Z, Reiser B, Chuck R, Windeler R. Optimal wavelength for ultrahigh-resolution optical coherence tomography. Opt Express. 2003;11:1411–1417. doi: 10.1364/oe.11.001411. [DOI] [PubMed] [Google Scholar]
- 17.Yang H, Downs JC, Burgoyne CF. Physiologic Intereye Differences in Monkey Optic Nerve Head Architecture and Their Relation to Changes in Early Experimental Glaucoma. Invest Ophthalmol Vis Sci. 2009;50:224–234. doi: 10.1167/iovs.08-2464. [DOI] [PMC free article] [PubMed] [Google Scholar]
- 18.Manassakorn A, Ishikawa H, Kim JS, Wollstein G, Bilonick RA, Kagemann L, Gabriele ML, Sung KR, Mumcuoglu T, Duker JS, Fujimoto JG, Schuman JS. Comparison of optic disc margin identified by color disc photography and high-speed ultrahigh-resolution optical coherence tomography. Arch Ophthalmol. 2008;126:58–64. doi: 10.1001/archophthalmol.2007.16. [DOI] [PMC free article] [PubMed] [Google Scholar]
- 19.Kotera Y, Yasuno Y, Hangai M, Inoue R, Matika S, Nakanishi H, Yamanari M, Yoshimura N. Comparison of Spectral Domain Optical Coherence Tomography and Color Photographic Imaging of the Optic Nerve Head in Glaucoma Management. Ophthalmic Surg Lasers Imaging. 2008;39:S62–S70. doi: 10.3928/15428877-20090430-06. [DOI] [PubMed] [Google Scholar]