Abstract
Measuring rates of brain atrophy from serial magnetic resonance imaging (MRI) studies is an attractive way to assess disease progression in neurodegenerative disorders, particularly Alzheimer's disease (AD). A widely recognized approach is the boundary shift integral (BSI). The objective of this study was to evaluate how several common scan non-idealities affect the output of the BSI algorithm. We created three types of image non-idealities between the image volumes in a serial pair used to measure between-scan change: inconsistent image contrast between serial scans, head motion, and poor signal-to-noise (SNR). In theory the BSI volume difference measured between each pair of images should be zero and any deviation from zero should represent corruption of the BSI measurement by some non-ideality intentionally introduced into the second scan in the pair. As the severity of motion, noise and non-congruent image contrast increases in the second scan, the calculated brain BSI values deviate progressively more from the expected value of zero. This study illustrates the magnitude of the error in measures of change in brain volume across serial MRI scans that can result from commonly encountered deviations from ideal image quality. The magnitudes of some of the measurement errors seen in this study significantly exceed the disease effect in AD. For example, measurement error may exceed 30% if image contrast properties differ between the two scans in a measurement pair. Methods to maximize consistency of image quality over time are an essential component of any quantitative serial MRI study.
Keywords: MRI, image processing, image artifacts, Alzheimer's disease
Introduction
Serial imaging studies are capable of capturing disease specific alterations in morphology, biochemistry, or function that evolve over time. Measuring rates of brain atrophy from serial MR studies has emerged as a promising way to assess disease progression in neurodegenerative disorders, particularly Alzheimer's disease (AD) (Fox, 2000,Fox, 1996,Fox, 1999a,Fox, 1999b,Jack, 2004,Jack, 1998,Jack, 2000,Du, 2003,Thompson, 2003). In a widely recognized approach, termed the boundary shift integral (BSI), two MRI volumes are spatially registered, intensity normalized, and volume change between the two scans is computed from intensity differences at the brain-CSF interface (Freeborough and Fox, 1997). The BSI has been used as an outcome metric in therapeutic intervention studies (Fox, 2005). In practice, one or both of the MRI studies entered into the BSI calculation often deviate from the ideal in some way, for example head motion. The objective of this study was to evaluate how several common scan non-idealities affect the output of the BSI algorithm.
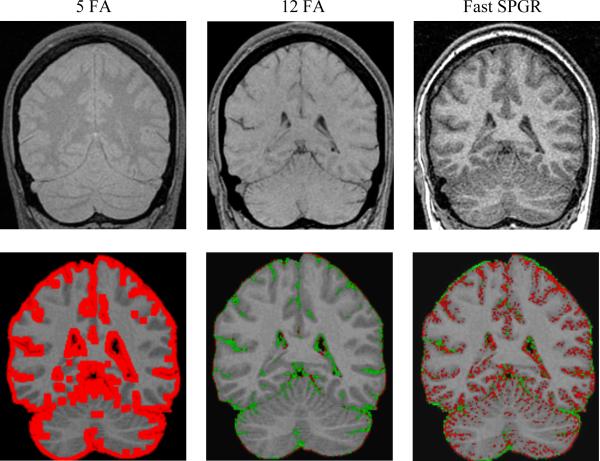
Figure 2. Effects of change in image contrast on BSI calculations.
(a) The top row, going from left to right, are the images of the 5 degree flip angle, 12 degree flip angle and fast spin echo SPGR scan. (b) Below each scan mentioned above is its BSI object map overlaid on the base SPGR scan. In each case the BSI object map pictorially illustrates those pixels where volume difference was measured between the base and the second altered scan in the pair. The red and green pixels represent a color map of BSI computed change in volume superimposed on the baseline grey scale MRI scan. Red indicates shrinkage and green expansion of the color annotated pixel
Methods
We simulated three types of image non-idealities: errors in MR protocol consistency between serial scans, head motion, and images acquired with sub optimal signal-to-noise (SNR). Ten normal young volunteers participated in this study after informed consent had been obtained, ages 27 to 60, 6 men and 4 women. Each of the 10 normal volunteers underwent a 3D radiofrequency spoiled gradient recalled (SPGR) scan: 24cm FOV, TR=23ms, TE=6ms (full echo), 256×192 matrix, 124 partitions, with a 25 degree flip angle (FA), which we refer to as the “base” scan. This was followed by four additional 3D scans; the first two were identical to the previously described pulse sequence except the FA was changed to 5 degrees and 12 degrees respectively. The third scan was acquired as a fast SPGR (Fig. 2). The implementation of the fast SPGR sequence differed from the base SPGR sequence in several ways, one of which was that the fast SPGR acquires a fractional echo which in turn exacerbates local susceptibility artifacts. The implementation of spoiler gradients also differs between a fast and conventional SPGR. Finally, the subject was withdrawn from the scanner, repositioned, and a scan identical to the base was repeated, which we refer to as the “repositioned” scan.
The “base” scan was then modified by adding 5 levels of motion blurring (Fig. 3) and also 5 levels of noise (Fig. 4). Fourteen brain BSI volume difference values were computed in each subject: base-to-5 degree FA, base to 12 degree FA, and base to fast SPGR; base to repositioned scan; base to match scans with 5 levels of motion blurring with increasing severity; and, base to match scans with 5 levels of noise with increasing severity (Tables 1, 2 and 3).
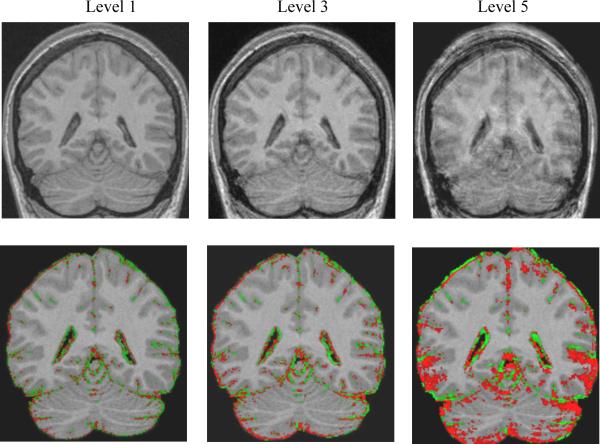
Figure 3. Effects of Motion on BSI calculations.
(a) The top row, going from left to right, are SPGR images with increasing motion. (b) Below each respective image is its BSI object map overlaid on the base SPGR scan. In each case the BSI object map pictorially illustrates those pixels where volume difference was measured between the base and the second altered scan in the pair. The red and green pixels represent a color map of BSI computed change in volume superimposed on the baseline grey scale MRI scan. Red indicates shrinkage and green expansion of the color annotated pixel.
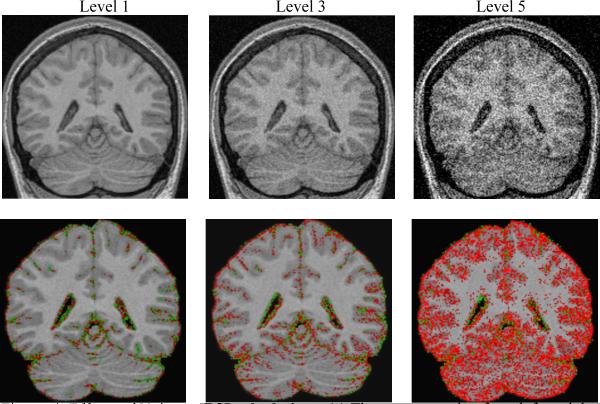
Figure 4. Effects of Noise on BSI calculations.
(a) The top row, going from left to right, are SPGR images with increasing noise. (b) Below each respective image is its BSI object map overlaid on the SPGR scan where no noise was added. As noise increases, the BSI brain and ventricle values progressively diverge from zero and suggest increased brain atrophy. In each case the BSI object map is calculated by “subtracting” the second altered scans from the base 25 degree FA bas scan. The red and green pixels represent a color map of BSI computed change in volume superimposed on the baseline grey scale MRI scan. Red indicates shrinkage and green expansion of the color annotated pixel.
Table 1.
BSI Results for Varying Image Contrast
| Contrast | Base – Fast SPGR | Base – 12 deg. FA | Base – 5 deg. FA | |||
|---|---|---|---|---|---|---|
| BSI | BSI (abs) | BSI | BSI (abs) | BSI | BSI (abs) | |
| Mean | −0.43 | 0.79 | 1.85 | 1.85 | −30.45 | 37.41 |
| SD | 0.97 | 0.67 | 0.62 | 0.62 | 29.11 | 17.98 |
The column labeled BSI represents the average percent volume change between the base and second scan with the sign of the change retained. Negative BSI values signify that on average the second scan in the pair was measured as smaller than the base. A positive sign indicates the reverse. The column labeled BSI (abs) indicates the absolute value of the volume change between the base and second scan.
Table 2.
BSI Results for Increasing Levels of Motion
| Motion | Base - Level 1 | Base - Level 2 | Base - Level 3 | Base - Level 4 | Base - Level 5 | |||||
|---|---|---|---|---|---|---|---|---|---|---|
| BSI | BSI (abs) | BSI | BSI (abs) | BSI | BSI (abs) | BSI | BSI (abs) | BSI | BSI (abs) | |
| Mean | 0.03 | 0.08 | 0.10 | 0.14 | 0.18 | 0.49 | −0.19 | 0.89 | −1.00 | 1.64 |
| SD | 0.10 | 0.05 | 0.15 | 0.11 | 0.54 | 0.24 | 1.34 | 0.98 | 2.02 | 1.48 |
The column labeled BSI represents the average percent volume change between the base and second scan with the sign of the change retained. Negative BSI values signify that on average the second scan in the pair was measured as smaller than the base. A positive sign indicates the reverse. The column labeled BSI (abs) indicates the absolute value of the volume change between the base and second scan.
Table 3.
BSI Results for Increasing Levels of Noise
| Noise | Base - Level 1 | Base - Level 2 | Base - Level 3 | Base - Level 4 | Base - Level 5 | |||||
|---|---|---|---|---|---|---|---|---|---|---|
| BSI | BSI (abs) | BSI | BSI (abs) | BSI | BSI (abs) | BSI | BSI (abs) | BSI | BSI (abs) | |
| Mean | 0.02 | 0.07 | −0.01 | 0.24 | −0.75 | 0.75 | −4.08 | 4.08 | −8.06 | 8.06 |
| SD | 0.08 | 0.03 | 0.36 | 0.27 | 0.45 | 0.45 | 1.25 | 1.25 | 3.37 | 3.37 |
The column labeled BSI represents the average percent volume change between the base and second scan with the sign of the change retained. Negative BSI values signify that on average the second scan in the pair was measured as smaller than the base. A positive sign indicates the reverse. The column labeled BSI (abs) indicates the absolute value of the volume change between the base and second scan.
BSI brain volume difference values were made using a home built software algorithm, described in detail elsewhere (Gunter, 2003). The algorithm begins with a series of data preprocessing steps including extracting the brain from the overlying skull and scalp, creating binary masks of brain and ventricle, correcting intensity non-uniformities, spatial alignment of the two image volumes, scaling correction, and global intensity normalization. The pre-processed brain volumes are then entered into a module that computes change in brain volume from baseline to follow-up scan (Gunter, 2003). Volume change is determined at the brain-CSF interface over the entire three-dimensional surface of the registered brain volumes, similar to the method of Fox and Freeborough (Freeborough and Fox, 1997).
Varied levels of noise were introduced into the data as follows. Raw k-space data was transformed to image space using a home built program suite called MR-View. In MR-view the image data for the 3D SPGR pulse sequence typically has a dynamic range of 25,000. Noise was generated by a standard pseudo-random number generator with period on the order of 232. Pseudo-random noise in the range zero to N was added to the data, where N took the values 500, 1250, 2500, 5000 or 7500. That is, noise of up to around 2,5,10,20, and 30% was added.
The addition of motion to the MR images was done by applying synthetic motion to the MR k-space according to the Fourier shift theorem plus (Bracewell, 1978). The k-space was divided into 8 blocks, with motion being added in the x direction in the second and eighth block, x and y directions in the third and seventh block, y direction in the forth and sixth block and no motion was added in the first and fifth block (Ehman and Felmlee, 1989). The magnitude of the motion added in image space was 0.3125, 0.625, 1.25, 2.5 or 5 pixels, depending on the level of the motion.
Results
In theory the BSI volume difference between each pair of images should be zero and any deviation from zero should represent corruption of the BSI measurement by some non-ideality intentionally introduced into the second scan in the pair. In practice some random error is present in the measurement. The BSI values obtained in the measures of base to repositioned scans provide a reference measure of the error associated with simply repositioning the subject plus that associated with making the actual measurement itself. That is, these values represent the error inherent in measuring volume change from serial MRI scans with no intentionally introduced scan quality problems or non compatibilities between the pair of scans. The mean signed BSI of the base to repositioned measures was −0.05% (SD 0.37%) while the absolute values of these measures were 0.29% (SD 0.23%).
Mean signed as well as absolute value BSI measures across the 10 volunteers are presented in 3 tables. In each of the 3 tables, the value labeled BSI indicates the average percent change in volume from base to second scan with the sign of the change retained - i.e. in theory large deviations from the expected change of zero but with opposing signs could cancel out leaving a small apparent deviation from 0 when averaged across the 10 subjects. A negative value indicates that on average the second scan was measured as smaller than the base scan, and a positive BSI value indicates the reverse. BSI (abs) indicates the absolute value of the change. Table 1 illustrates that as image contrast in the second image deviates from that of the base scan, the BSI result deviates progressively more from the expected value of zero. Note that an SPGR with a FA of 5 degrees is proton density weighted – quite different from the T1 weighted contrast of the 25 FA base scan (Fig 2). Conversely, the 12 degree FA match scan while still different has contrast properties that are more similar to the base 25 FA scan. The BSI values match the visually apparent relative contrast properties in these image pairs. Tables 2 and 3 illustrate that as the severity of motion and noise (respectively) in the second scan increases, the calculated absolute brain BSI values deviate progressively more from zero. Increasing levels of noise distort the signed BSI brain values in the negative direction, suggesting the second image in the pair has a smaller brain volume. As the levels of motion increase, the signed BSI brain values diverge progressively more from zero in the positive direction from smaller motions and in the negative direction for larger motions.
Conclusion
MR is increasingly viewed as an attractive way to measure biological properties of interest in therapeutic and natural history studies (Matthews, 2003,Jack, 2003). This is particularly true in AD where no in vivo biomarker exists. Atrophy of the brain is a fundamental feature of the pathological process of AD. Both brain atrophy and the characteristic clinical symptoms are a direct consequence of the loss of neurons and synapses that occurs as AD pathology progresses. Measuring rates of atrophy from serial MR scans is viewed as a promising surrogate measure of disease progression in AD and other neurodegenerative conditions. However, in practice image non idealities do occur. Common examples are: errors (differences) in protocol prescription between a baseline and a later scan; drifts in instrument signal to noise; and, bulk head motion, which is particularly common in elderly or demented subjects.
As image contrast properties in the match scan deviate progressively from those in the base scan, the measured BSI inter-scan difference deviates more significantly from the expected value of zero. The 5 degree FA match scan is essentially a spin density weighted image, quite different from the T1- weighted base image. The 12 degree flip angle match scan is T1 weighted, but less so than the 25 degree flip angle base scan. As would be expected the mean BSI value for the 12 degree flip images is substantially less than that of the 5 degree flip, but still greater than the base-repositioned BSI value which serves as a reference for the precision of the BSI method. The fast SPGR scan has image properties more similar to the base scan and appropriately has a smaller BSI value than either the 5 or 12 degree flip angle scans.
As the amplitude of the motion in the match scan increases, the mean absolute BSI values as well as the associated SD increase progressively. This is consistent with progressively greater blurring of the brain CSF boundary in the match scan which in turn leads to progressively greater distortion in the BSI measure of brain “shrinkage” between the two scans. Interestingly the signed BSI mean values do not respond in a monotonic manner as motion blurring increases. The position of the brain surface in the second scan relative to the base scan expands with smaller degrees of blurring in the second scan, and contracts with larger degrees of blurring.
As noise in the match scan is increased, the mean absolute BSI values as well as the associated SD increase progressively. Conversely the signed BSI values decrease progressively. The decrease in the signed BSI values with progressively greater mismatch in SNR between the scans in the pair indicates that the noisier match scan is seen as “smaller” than the base scan. That is, the position of the brain surface is seen to retract as noise in the match scan increases.
Interestingly, despite its importance, the interaction between image acquisition and image processing is an area that receives little academic attention. This study illustrates the magnitude of the error in measures of change in brain volume across serial MRI scans that can result from commonly encountered deviations from ideal image quality. The magnitudes of the measurement errors seen in this study are significantly greater than the disease effect in AD. The image analysis algorithm used in the study was the BSI. However, many if not most computer-based image analysis methods would be expected to display the same types of vulnerabilities to image non-idealities. The loss of a single scan in a series due to poor quality may invalidate not only the MRI data at that one time point, but it may require exclusion of the entire series of scans from that particular subject from the data analysis. This can be costly. If pervasive enough this loss of data could invalidate the statistical power of portions of the analysis plan. Loss of data points is also costly from a financial perspective. Costs to enroll and retain a subject in longitudinal studies vary, but in neurodegenerative disorders these expenses may be as high as tens of thousands of dollars per subject. Results of this study underscore the importance of rigorous quality control methods in longitudinal MRI studies. Methods to maximize consistency of image quality over time are an essential component of any quantitative serial MRI study.
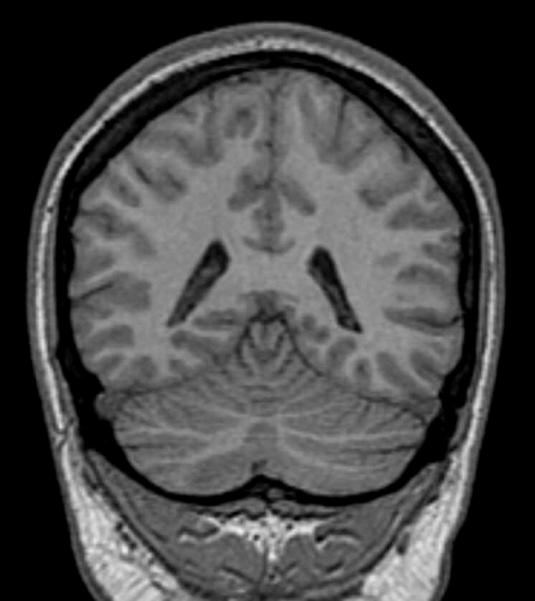
Figure 1. Standard SPGR Image.

Example of a scan used as base in the analyses.
Acknowledgements
Grant support AG11378 and EB00229, Technical assistance Roger Grimm, Armando Manduca, Ph.D. and David Lake.
References
- 1.Fox NC, Cousens S, Scahill R, et al. Using serial registered brain magnetic resonance imaging to measure disease progression in Alzheimer disease. Arch Neurol. 2000;57:339–443. doi: 10.1001/archneur.57.3.339. [DOI] [PubMed] [Google Scholar]
- 2.Fox NC, Freeborough PA, Rossor MN. Visualization and quantification of rates of atrophy in Alzheimer's disease. The Lancet. 1996;348:94–97. doi: 10.1016/s0140-6736(96)05228-2. [DOI] [PubMed] [Google Scholar]
- 3.Fox NC, Warrington EK, Rossor MN. Serial magnetic resonance imaging of cerebral atrophy in preclinical Alzheimer's disease. The Lancet. 1999a;353:2125. doi: 10.1016/S0140-6736(99)00496-1. [DOI] [PubMed] [Google Scholar]
- 4.Fox NC, Scahill RI, Crum WR, Rossor MN. Correlation between rates of brain atrophy and cognitive decline in AD. Neurology. 1999b;52:1687–1689. doi: 10.1212/wnl.52.8.1687. [DOI] [PubMed] [Google Scholar]
- 5.Jack CR, Jr., Shiung MM, Mintzer J, et al. Comparison of different MRI brain atrophy rate measures with clinical disease progression in AD. Neurology. 2004;62:591–600. doi: 10.1212/01.wnl.0000110315.26026.ef. [DOI] [PMC free article] [PubMed] [Google Scholar]
- 6.Jack CR, Jr., Petersen RC, Xu Y, et al. The rate of medial temporal lobe atrophy in typical aging and Alzheimer's disease. Neurology. 1998;51:993–999. doi: 10.1212/wnl.51.4.993. [DOI] [PMC free article] [PubMed] [Google Scholar]
- 7.Jack CR, Jr., Petersen RC, Xu Y, O'Brien PC, Smith Ge, Ivnik RJ, Boeve BF, Tangalos EG, Kokmen E. Rates of Hippocampal Atrophy in Normal Aging, Mild Cognitive Impairment, and Alzheimer's Disease. Neurology. 2000;55:484–489. doi: 10.1212/wnl.55.4.484. [DOI] [PMC free article] [PubMed] [Google Scholar]
- 8.Du AT, Schuff N, Zhu XP, et al. Atrophy rates of entorhinal cortex in AD and normal aging. Neurology. 2003;60:481–486. doi: 10.1212/01.wnl.0000044400.11317.ec. [DOI] [PMC free article] [PubMed] [Google Scholar]
- 9.Thompson PM, Hayashi KM, de Zubicaray G, et al. Dynamics of gray matter loss in Alzheimer's disease. Journal of Neuroscience. 2003;23:994–105. doi: 10.1523/JNEUROSCI.23-03-00994.2003. [DOI] [PMC free article] [PubMed] [Google Scholar]
- 10.Freeborough PA, Fox NC. The boundary shift integral: an accurate and robust measure of cerebral volume changes from registered repeat MRI. IEEE Trans on Medical Imaging. 1997;15:623–629. doi: 10.1109/42.640753. [DOI] [PubMed] [Google Scholar]
- 11.Fox N, Black RS, Gilman S, Rossor MN, Griffith S, Jenkins L, Koller M. Effects of AB immunization (AN1792) on MRI measures of cerebral volume in Alzheimer disease. Neurology. 2005;64:1563–1572. doi: 10.1212/01.WNL.0000159743.08996.99. [DOI] [PubMed] [Google Scholar]
- 12.Gunter JL, Shiung MM, Manduca A, Jack CRJ. Methodological considerations for measuring rates of brain atrophy. JMRI. 2003;18:16–24. doi: 10.1002/jmri.10325. [DOI] [PMC free article] [PubMed] [Google Scholar]
- 13.Bracewell RN. The Fourier transform and its applications. 2nd ed. 1978. p. 104. [Google Scholar]
- 14.Ehman RL, Felmlee JP. Adaptive technique for high-definition MR imaging of moving structures. Radiology. 1989;173:255–263. doi: 10.1148/radiology.173.1.2781017. [DOI] [PubMed] [Google Scholar]
- 15.Matthews B, Siemers ER, Mozley PD. Imaging-based measures of disease progression in clinical trials of disease-modifying drugs for Alzheimer disease. American Journal of Geriatric Psychiatry. 2003;11:146–159. [PubMed] [Google Scholar]
- 16.Jack CRJ, Slomkowski M, Gracon S, Hoover TM, Felmlee JP, Stewart K, Xu YC, Shiung MM, O'Brien PC, Cha RH, Knopman DS, Petersen RC. MRI as a biomarker of disease progression in a therapeutic trial of Milameline for Alzheimer's. Neurology. 2003;60:253–260. doi: 10.1212/01.wnl.0000042480.86872.03. [DOI] [PMC free article] [PubMed] [Google Scholar]


