Abstract
Background
Age and LV hypertrophy are risk factors for the development of LV dysfunction and CHF. Our goal was to study the relationships of LV mass and age with myocardial dyssynchrony among asymptomatic participants of the Multi-Ethnic Study of Atherosclerosis.
Methods and Results
1,100 individuals underwent tagged MRI. Regional LV function was analyzed using HARP (Harmonic Phase Imaging). Time to peak systolic circumferential strain and strain rate were measured in 12 segments, and myocardial dyssynchrony was expressed as the standard deviation (SD) of time to peak strain and strain rate. Relationships of age, LV mass and myocardial perfusion with timing of strain, strain-rate and dyssynchrony were studied.
There was a positive relationship between age and time to peak strain before [regression coefficients (RC) =0.37 ms/year of age, (95% CI=0.05-0.70), p=0.025], and after adjustment for demographic characteristics and risk factors (p=0.007). Positive associations between age and SD of time to peak strain (RC=0.33 ms/yr of age, p=0.002), and SD of time to peak systolic strain-rate were documented (p=0.045). Importantly, we found that LV mass index is directly related to time to peak strain (p<0.001), time to peak strain rate, and the SD of time to strain rate (p=0.001 for all). Finally, decreased myocardial perfusion at rest was associated with delayed contraction and increased extent of dyssynchrony.
Conclusions
In asymptomatic individuals, age, increased LV mass and decreased myocardial perfusion are related to delayed myocardial contraction and greater extent of dyssynchrony. Increased dyssynchrony may mediate the association of myocardial dysfunction with age and left ventricular hypertrophy.
Keywords: Magnetic resonance imaging, aging, hypertrophy, perfusion
Introduction
Heart failure constitutes a major health problem worldwide. Approximately 5 million patients in the USA suffer from congestive heart failure (CHF) and 500,000 new patients are diagnosed annually as having this condition.1 The prevalence of heart failure increases with age, and approximately 6–10% of individuals older than 65 years are diagnosed as having heart failure2. With the aging of the general population the incidence and prevalence of CHF are expected to increase.
Left ventricular (LV) remodeling and hypertrophy are also associated with the development of CHF and an increased incidence of other major cardiovascular events, including sudden death.3;4 In a previous study based on the Multi-Ethnic Study of Atherosclerosis database, LV remodeling was associated with decreased systolic regional LV function.5
Coordinated contraction of the left ventricular myocardium is necessary for efficient LV chamber performance. Indeed, conduction abnormalities in the form of left bundle branch block have been associated with global left ventricular dysfunction.6 Tagged MRI studies demonstrated that creation of dyssynchronized electrical activation using right ventricular pacing causes redistribution of regional myocardial work with markedly reduced myocardial deformation in regions adjacent to the pacing site, and greater work load in remote areas. This redistribution has been associated with changes in myocardial perfusion, as well as with LV structural changes.7
Several techniques have been used to evaluate mechanical dyssynchrony. The most commonly used modality has been echocardiography employing tissue Doppler imaging or speckle tracking. However, tagged MRI is a more powerful tool for assessing myocardial dyssynchrony by the virtue of its ability to evaluate myocardial deformation noninvasively, unlimited by scanning angles or acoustic windows.
Our aim was to explore the relationship between age, increased LV mass, and the extent of dyssynchrony in an asymptomatic population free of cardiovascular disease. This would allow insight into the mechanisms associated with the development of LV dysfunction and heart failure in these populations.
Methods
Study population
MESA is a prospective cohort study designed to evaluate mechanisms underlying the development and progression of subclinical cardiovascular disease in asymptomatic individuals.8 6,814 men and women 45 to 85 years of age from different ethnicities (Caucasian, African-American, Hispanic, and Chinese-American) were included in the study. Individuals with cardiac symptoms or known cardiovascular disease were excluded. Cardiac MRI was performed as part of the baseline examination. Of the entire study population, 1,100 consecutive participants agreed to undergo tagged MRI studies in 6 centers (Wake Forest University, Winston Salem, NC; Columbia University, New York, NY; Johns Hopkins University, Baltimore, MD; University of Minnesota, Minneapolis, MN; Northwestern University, Chicago, IL; and UCLA, Los Angeles, CA). The study protocol was approved by the institutional review boards of each participating center, and informed consent was obtained from each participant.
255 individuals among the 1,066 MESA participants enrolled at St Paul MN underwent tagged MRI. All participants enrolled in that center were invited to participate in a substudy of contrast-enhanced perfusion imaging. Individuals with known sensitivity to gadolinium or adenosine, bradyarrhythmias, asthma, or chronic obstructive pulmonary disease were excluded. 234 participants underwent myocardial perfusion studies and 74 individuals underwent both myocardial MRI tagging and contrast-enhanced perfusion studies. Results from this group of individuals are included in the analysis of the association between perfusion and dyssynchrony.
Tagged MRI studies
Tagged MR images were acquired by whole-body 1.5 T scanners using electrocardiograph-triggered segmented k-space fast spoiled gradient-echo pulse sequence during breath holds. After completing the standard protocol, 3 tagged short-axis slices (base to apex) were obtained using spatial modulation of magnetization (SPAMM) encoding gradients. Settings are described in the on-line Supplement.
LV mass was determined for each participant using dedicated commercially available software (MASS, version 4.2, Medis, Leiden, the Netherlands) at end diastole, as previously described by Natori et al9.
Strain analysis
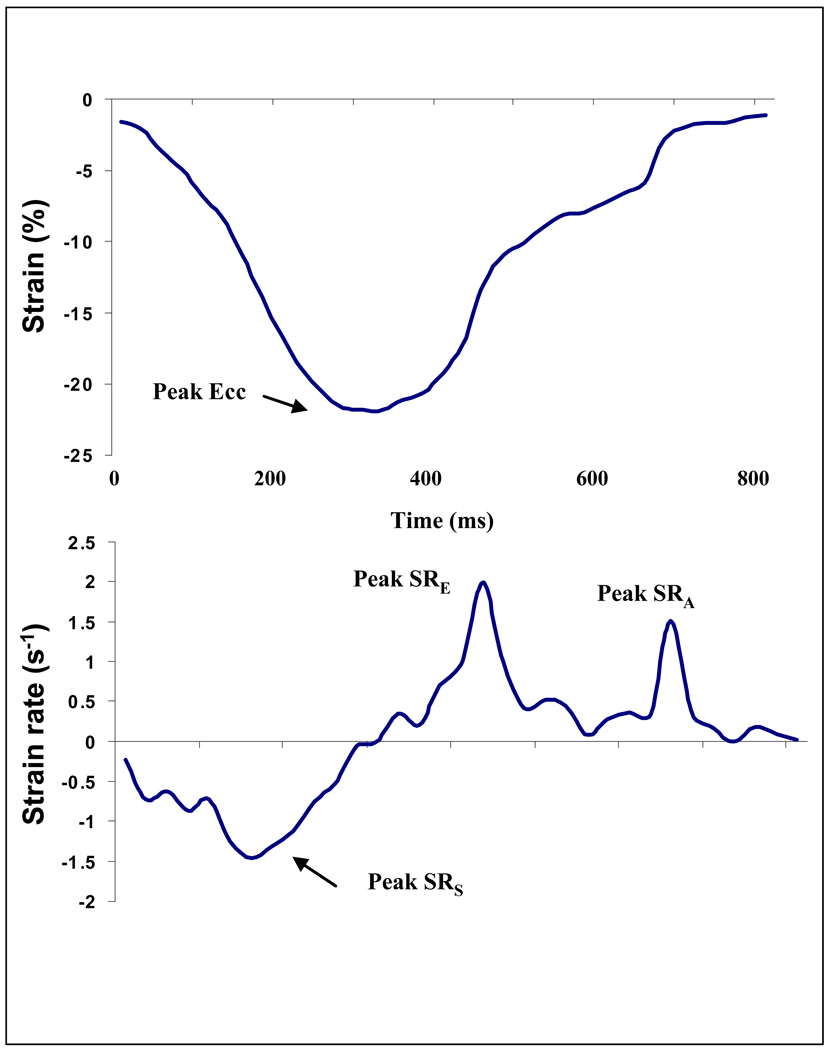
Short-axis tagged slices were analyzed using harmonic phase imaging (HARP). This method (Diagnosoft, Palo Alto, CA) enables fast determination of myocardial strain10 including circumferential strain and strain rate from 3 short axis slices (basal, mid-ventricular and apex) and 4 regions (septum, anterior, posterior and lateral walls). Times from end-diastole to peak systolic strain and strain rate were also measured (Figure 1).
Figure 1. Strain and strain rate curves.
Circumferential strain (upper curve) and strain rate plots (lower curve). X axis indicates time from end-diastole (ms). Peak systolic circumferential strain and strain rates are shown. Ecc- circumferential strain, SRs- peak systolic strain rate, SRE – peak early diastolic relaxation rate. (E wave). SRA– peak late diastolic relaxation rate. (A wave).
Dyssynchrony
Standard deviation (SD) of time to peak systolic strain and time to peak systolic strain rate in 12 regions (3 slices × 4 regions) was used to evaluate the extent of myocardial dyssynchrony. This approach is analogous to the method described previously by Yu et al using echocardiography.11
In order to assess the validity of the SD of time to peak systolic strain and strain rate, we studied their correlation with an established index of dyssynchrony, i.e lateral to septal wall time delay. The correlation between lateral-septal delay and the SD of the time to peak systolic strain rate was good (r= 0.60, p<0.001). In contrast, the correlation between the absolute difference and SD of time to peak systolic strain, was weaker (r=0.26, p<0.001).
MRI Perfusion Study
T1-weighted gradient-echo imaging with magnetization saturation was used to cover 2 to 3 short axis slices during the first pass of the contrast bolus through the LV (cavity and myocardium). Gd-DPTA at a dose of 0.04 mmol/kg body weight (Magnevist, Berlex, Wayne, NJ) was administered intravenously at a rate of 7 mL/second. First-pass scan was performed at rest, followed by a second scan 15 minutes later during hyperemia induced by adenosine (0.14 mg/kg per minute for 3 minutes, before the onset of scanning). Myocardial blood flow (ml/min per gm tissue) at rest and during hyperemia were determined as previously described.12
Statistical Analysis
The associations of mean time to peak systolic strain, mean time to peak systolic strain rate (averaged across the 12 regions), extent of dyssynchrony (expressed as the SD to time to peak strain or strain rate in 12 regions) with age, gender and LV mass were studied. LV mass index (LV mass/ height2.7) and age were studied as continuous and as categorical variables using quartiles for LV mass index and age groups (45–54, 55–64, 65–74 and 75–85 years). Multiple linear regression models were used to examine relations of time to peak systolic strain, strain rate and their corresponding standard deviations as dependent variables, whereas demographic parameters and risk factors served as independent variables.
Three sets of multivariable models were examined in a hierarchical fashion. Model 1: Unadjusted. Model 2: Adjusted for gender, age (when LV mass index was studied), ethnicity and body mass index (BMI) (when age was used). Model 3: Model #2 with additional adjustments for history of diabetes mellitus (DM), smoking (never, former smoker and current smokers), systolic and diastolic blood pressures (SBP and DBP, respectively), HDL, LDL-cholesterol, and antihypertensive therapy.
Relationships between mean blood flow (mbf) at rest and during adenosine induced hyperemia and average time to peak strain, strain rate as well as dyssynchrony were also determined by multivariable linear regression analysis.
The normality of residuals from the linear regression models was assessed via standardized normal probability (P-P) plots as well as plotting the quantiles of a variable against the quantiles of a normal distribution showing no deviation from normality in the middle range of data as well near the tails. Skewed plots of residual versus fitted values from age- and LVH-specific regression models did not indicate a discernible pattern or heteroscedasticity in residuals, suggesting that no important deviations from linear model assumptions had occurred.
Differences were considered significant if p<0.05. All reported p values are two-sided. The authors had full access to and vouch for the integrity of the entire dataset. All authors have read and agree with the manuscript as written.
Results
The mean age of the study population was 66 years. 54% (562/1,100) were male. Study-participants were mildly overweight (BMI: 27.8±4.6 kg/m2) (mean±S.D). A considerable percentage of individuals had risk factors including hypertension (43.6%) and diabetes (17.5%) (Table 1). Approximately 50% were either former or current smokers and 19.3% participants of the study cohort were treated for hyperlipidemia. Mean global LV ejection fraction was 68.6±7.6% and LV mass was 146.6±40.1 gm.
Table 1.
Demographics and risk factors of the study population (n=1,100)
| Parameter | Value* |
|---|---|
| Age | 66.3±9.7 |
| Males(%) | 53.9 |
| Ethnicity(%) | |
| Caucasian | 33.1 |
| Chinese American | 9.2 |
| African American | 28.0 |
| Hispanic | 29.7 |
| BMI(Kg/m2) | 27.8±4.6 |
| BSA(m2) | 1.85±0.2 |
| Risk factors | |
| SBP(mmHg) | 128.3±20.6 |
| DBP(mmHg) | 71.9±10.3 |
| Heart rate(BPM) | 62.7±9.7 |
| Hx of Hypertension(%) | 43.6 |
| Hx of Diabetes(%) | 17.5 |
| Cigarette smoking(%): Never smoked Former smokers Current smokers |
50.6 37.5 11.9 |
| Triglycerides(mg/dl) | 129.1±77.3 |
| Total Cholesterol(mg/dl) | 194.0±34.8 |
| LDL-C(mg/dl) | 117.5±30.0 |
| HDL-C(mg/dl) | 50.9±14.8 |
| Use anti-hypertensive medication(%) | 33.1 |
| Anti-hyperlipidemia medication(%) | 19.3 |
| Anti-hyperglycemic medication(%) | 11.2 |
| Global LV measurements | |
| LV mass(gm.) | 146.6±40.1 |
| LV end diastolic volume(ml) | 123.7±32.0 |
| LV end systolic volume(ml) | 39.6±17.0 |
| LV ejection fraction(%) | 68.6±7.6 |
| LV stroke volume(ml) | 84.1±20.2 |
Mean± SD.
Abbreviations: BMI-body mass index, BSA-body surface area, SBP-systolic blood pressure, DBP-diastolic blood pressure, Hx-history, LDL-low density lipoprotein, HDL-high density lipoprotein, LV-left ventricular.
Mean time to peak systolic strain was 315.4±53.6 (SD) ms, while the time to peak systolic strain rate was 106.6±29.8 ms. Extent of myocardial dyssynchrony defined as the standard deviation of the time to peak systolic strain and strain rate in 12 regions was 84.9±30.6 and 47.4±22.5 ms, respectively. The means and distributions of these parameters are presented in the (On-line supplement Table A).
Relationships of gender, time to peak systolic strain and strain rate with dyssynchrony
There were no significant gender differences in time to peak systolic strain (317.6±51.5 and 312.7±55.9 ms in men and women respectively, p=0.14). Time to peak systolic strain rate tended to be greater in men (p=0.07), whereas SD of time to peak systolic strain tended to be higher in women (86.5±30.8 versus 83.4±30.4 ms, p=0.09).
Relationships of age, time to peak systolic strain and strain rate with dyssynchrony (Table 2, Figure 2)
Table 2.
Relationship between age and time to peak strain, strain rate and their standard deviations as indicators of myocardial dyssynchrony. (n=1,100)
| parameter | Model 1 | Model 2 | Model 3 | |||
|---|---|---|---|---|---|---|
| RC* | 95%CI (p) | RC* | 95%CI (p) | RC* | 95%CI (p) | |
| Time to peak systolic strain |
0.37 | 0.05 to 0.70 (0.025) |
0.42 | 0.085 to 0.75 (0.014) |
0.49 | 0.14 to 0.86 (0.007) |
| Time to peak systolic strain rate |
−0.19 | −0.37 to −0.007 (0.042) |
−0.15 | −0.33 to 0.04 (0.11) |
−0.09 | −0.29 to 0.12 (0.41) |
| SD of time to peak systolic strain |
0.43 | 0.25 to 0.62 (<0.001) |
0.39 | 0.21 to 0.59 (<0.001) |
0.33 | 0.12 to 0.53 (0.002) |
| SD of time to peak systolic strain rate |
0.13 | −0.009 to 0.27 (0.067) |
0.15 | 0.015 to 0.29 (0.030) |
0.15 | 0.003 to 0.31 (0.045) |
RC - ms/year of age, p for significance, SD-standard deviation.
Model 1 - Unadjusted. Model 2- adjusted for gender, ethnicity and BMI.
Model 3 - adjusted for #1+ smoking, blood pressure, DM, lipids, medications
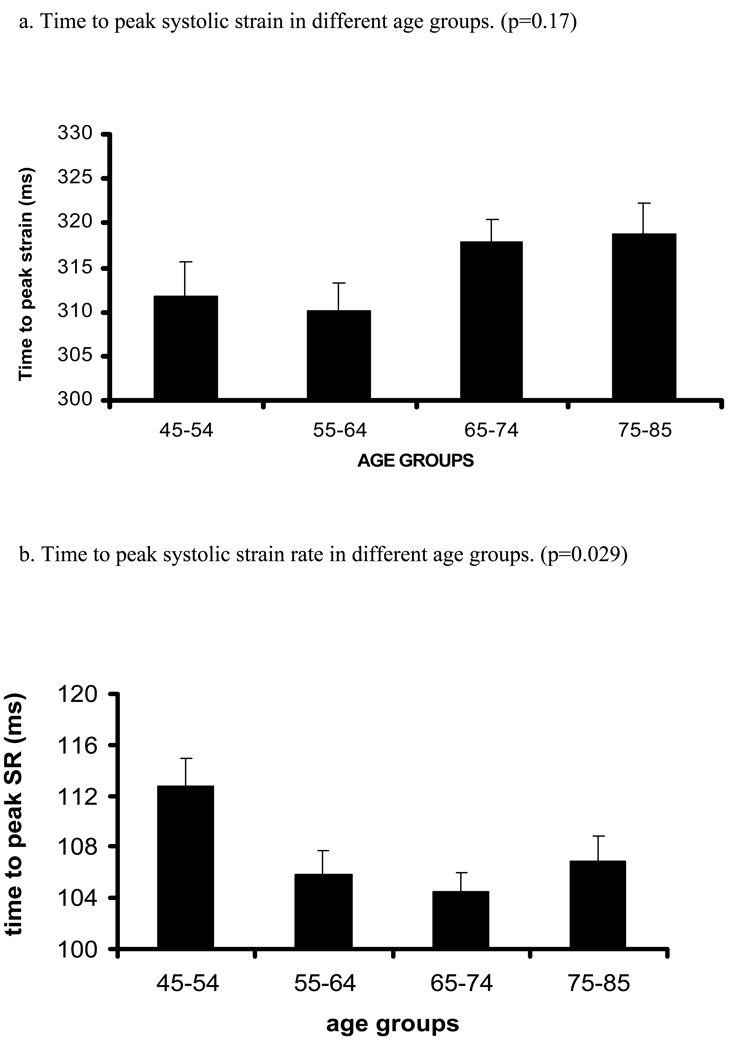
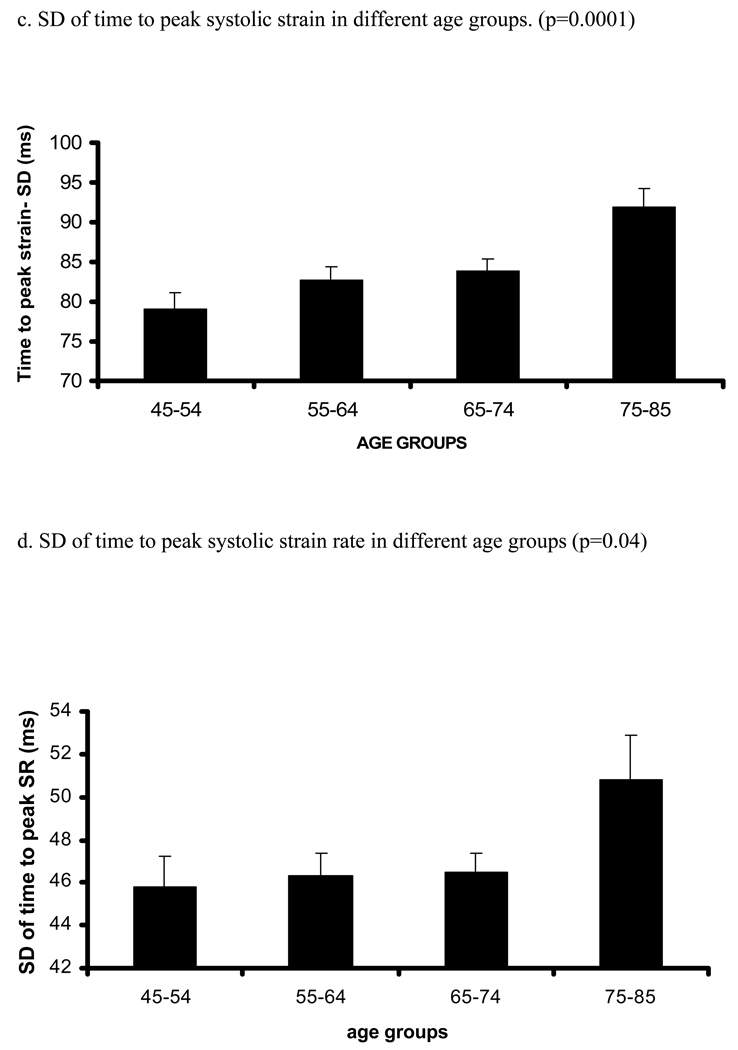
Figure 2. Relation between age and time to peak systolic strain, strain rate and their standard errors (trend tested by ANOVA, p- significance value).
Relation between increasing age and time (ms) to peak systolic strain (a), strain rate (b) and SD of strain (c) and strain rate (d). X axis shows age groups (45–54, 55–64, 65–74, and 75–85 years). Y axis indicates time to peak systolic strain (a), strain rate (b), SD of time to peak systolic strain (c) and SD of time to peak systolic strain rate (d). Standard error (SE) bars are depicted.
There was a positive relationship between age and time to peak systolic strain (Regression coefficients [RC] were 0.37 ms/1 year of age, p=0.025, before adjustment and 0.49 ms/1 year of age, p=0.007 after adjustment for demographic parameters and risk factors). In contrast, there was an inverse relationship between age and time to peak systolic strain rate (p=0.042). However, after multivariable adjustment, the latter association became nonsignificant. Interestingly, there were direct associations between age and SD of time to peak systolic strain and SD of time to peak systolic strain rate. Analysis using age-group categories rather than age as continuous variable yielded similar results (Table A, supplement).
Relationships of left ventricular mass index, time to peak systolic strain and strain rate with myocardial dyssynchrony (Table 3, Figure 3)
Table 3.
Relationship* between LV mass indexed by height2.7 and time to peak systolic strain, strain rate and their variations expressed as SD of time to peak systolic strain and strain rate (n=1,100).
| Variable | Quartiles of LV mass index (gm/height2.7) | ||||
|---|---|---|---|---|---|
| Quartile 1 | Quartile 2 | Quartile 3 | Quartile 4 | Trend (p value) |
|
| Time to peak strain (ms) |
|||||
| Model 1† | Ref | 7.2±4.7 (0.12) |
17.2±4.7 (<0.001) |
21.8±4.7 (<0.001) |
<0.001 |
| Model 2 | Ref | 9.1±4.8 (0.06) |
20.0±4.9 (<0.001) |
26.2±5.3 (<0.001) |
<0.001 |
| Model 3 | Ref | 8.2±4.9 (0.098) |
18.6±5.1 (<0.001) |
24.7±5.5 (<0.001) |
<0.001 |
| Time to peak strain rate (ms) |
|||||
| Model 1† | Ref | 1.4±2.5 (0.59) |
7.4±2.5 (0.003) |
10.0±2.5 (<0.001) |
<0.001 |
| Model 2 | Ref | 1.7±2.6 (0.50) |
7.8±2.7 (0.004) |
10.5±2.9 (<0.001) |
<0.001 |
| Model 3 | Ref | 1.6±2.7 (0.56) |
8.3±2.8 (0.003) |
11.6±3.0 (<0.001) |
<0.001 |
| SD of time to peak strain (ms) |
|||||
| Model 1† | Ref | −1.0±2.7 (0.7) |
−4.1±2.7 (0.12) |
−4.1±2.7 (0.13) |
0.072 |
| Model 2 | Ref | 0.23±2.7 (0.93) |
−1.8±2.8 (0.52) |
−0.52±3.0 (0.87) |
0.70 |
| Model 3 | Ref | 0.4±2.8 (0.89) |
−2.9±2.9 (0.33) |
−2.4±3.1 (0.44) |
0.28 |
| SD of time to peak strain rate (ms) |
|||||
| Model 1† | Ref | −0.19±1.9 (0.93) |
4.8±1.9 (0.015) |
3.9±1.9 (0.05) |
0.008 |
| Model 2 | Ref | −0.45±2.0 (0.83) |
4.54±2.1 (0.033) |
3.5±2.3 (0.12) |
0.030 |
| Model 3 | Ref | 1.0±2.1 (0.63) |
6.4±2.2 (0.003) |
5.4 ±2.3 (0.022) |
0.004 |
Relationship is expressed as a regression coefficient tested by multivariable linear regression using quartiles of LV mass indexed by height2.7 (Time to peak systolic strain rate or extent of myocardial dyssynchrony [ms]/ quartile of LV mass index (gm/height2.7)±S.E). First quartile is considered as reference for all analyses. Abbreviations: Ref- reference, S.E- standard error
Models, see Table 2.
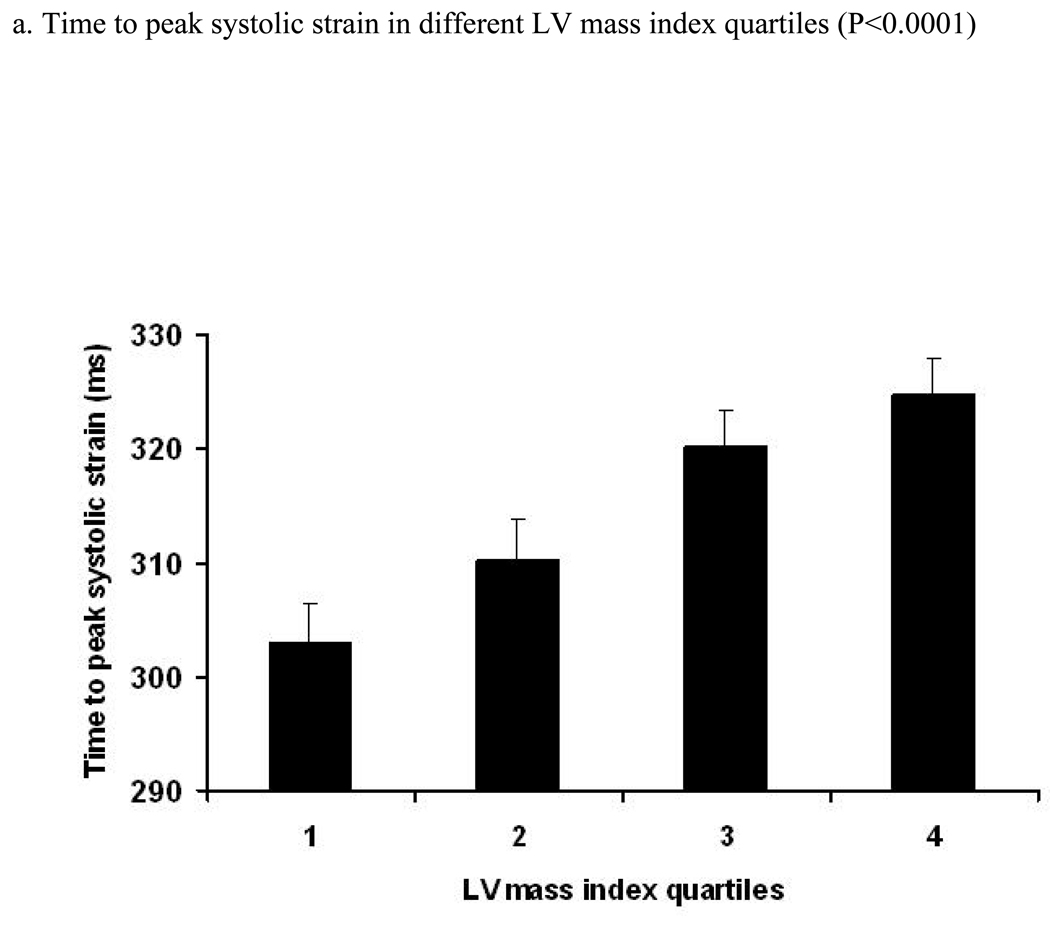
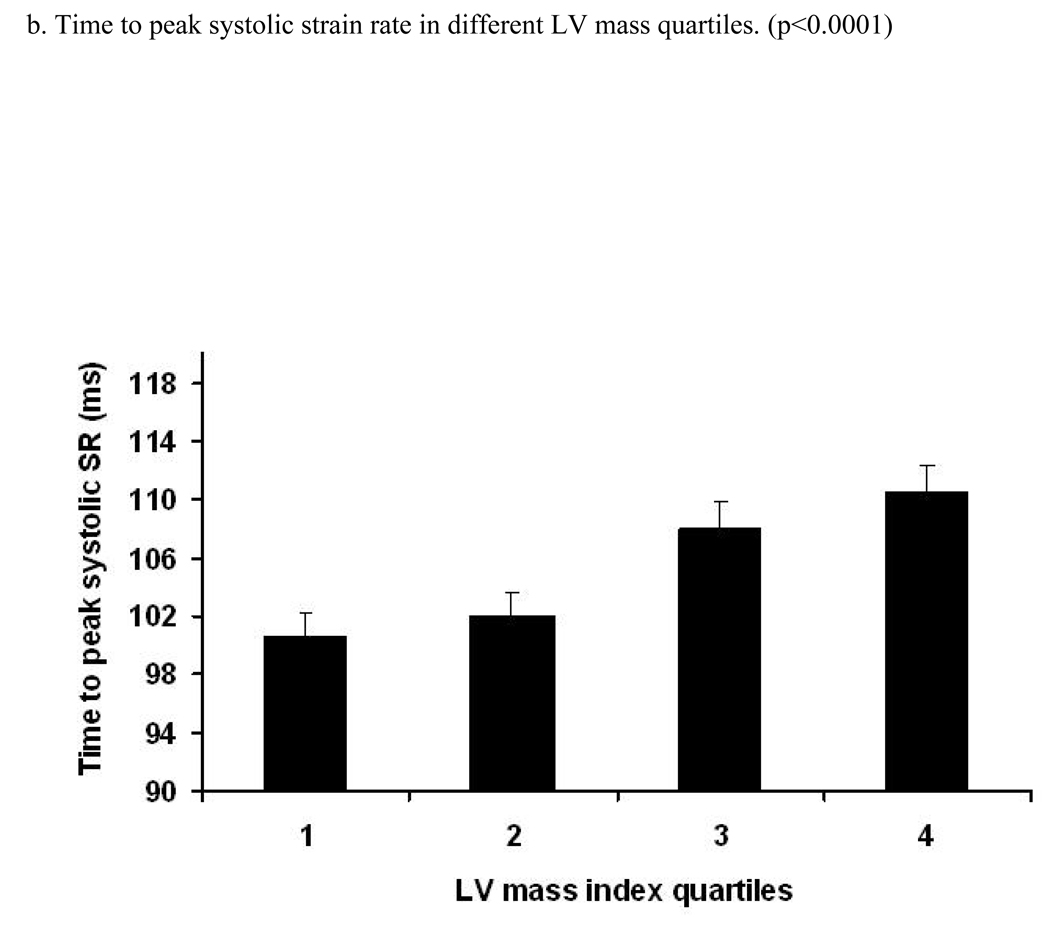
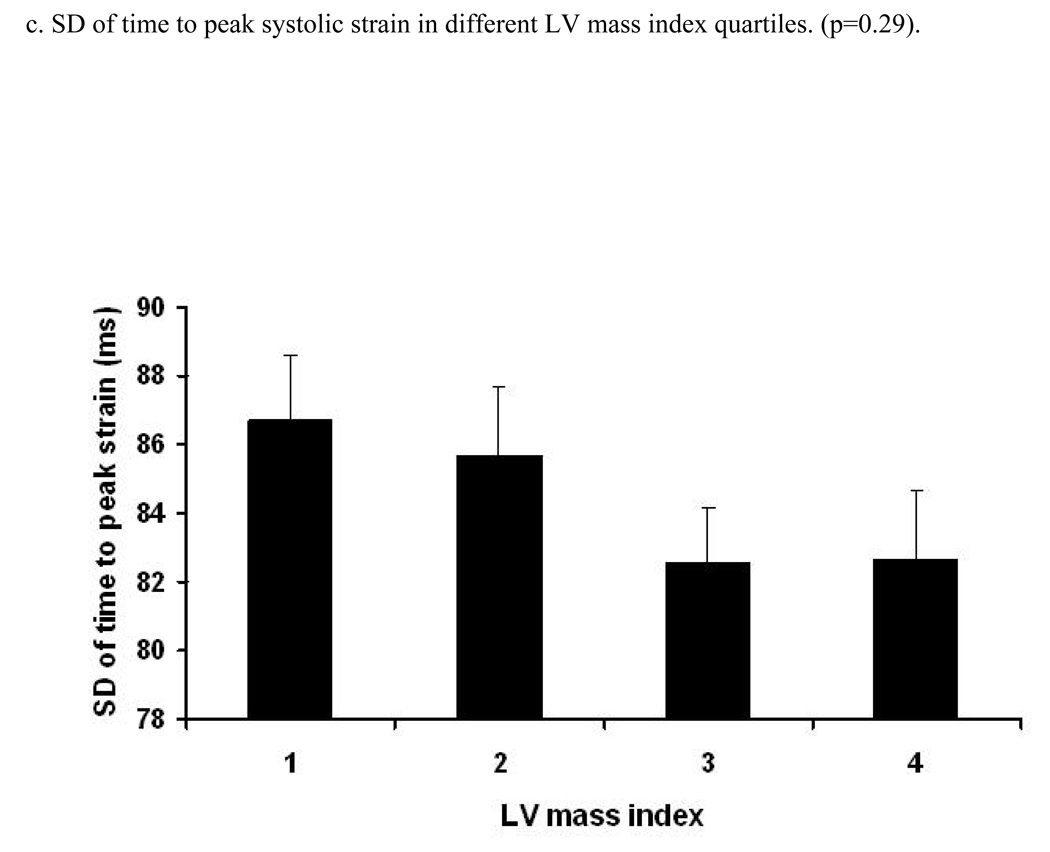
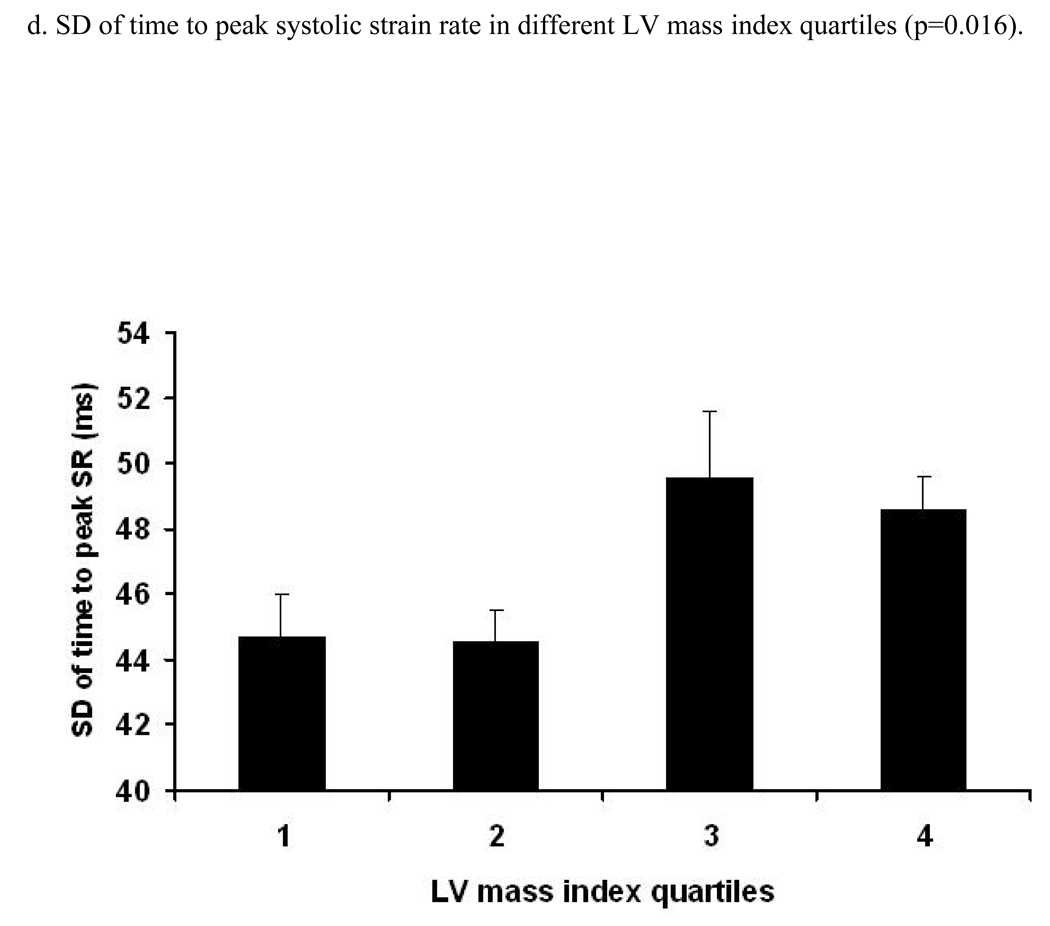
Figure 3. Relation between LV mass index (LV mass/height2.7) and time to peak systolic strain, strain rate and their standard errors (trend was tested by ANOVA, p- significance value).
Relation between quartiles of increasing LV mass index (LV mass/height2.7) and time (ms) to peak systolic strain (a), strain rate (b) and SD of strain (c) and strain rate (d). X axis shows quartiles of LV mass index, Y axis indicates time to peak systolic strain (a), strain rate (b), SD of time to peak systolic strain (c) and SD of time to peak systolic strain rate (d). S.E bars are shown.
A positive linear relationship was noted between the time to peak systolic strain and LV mass index (RC=1.11 ms/1 gm/m2.7 [95% CI:0.71 to 1.52, p<0.001]) before adjustment. After adjustment for demographic parameters and risk factors, this association remained significant (RC=1.20 ms/1 gm/m2.7, p<0.001). A similar direct association was also found between time to peak systolic strain rate and LV mass index (p<0.001, after adjustment). Moreover, there was a significant positive relationship between LV mass index and SD of time to peak systolic stain rate (0.016). After multi-variable adjustment, this association remained significant (adjusted difference between the 1st and 4th quartile was 5.4 ms, p=0.022). In contrast, the association between LV mass index and SD of the time to peak systolic strain was not significant. Analysis using LV mass indexed by BSA yielded similar results (Data not shown).
Importantly, there were no significant relationships between the extent of concentric remodeling expressed as the mass/volume ratio and the times of peak systolic strain, strain rate or their corresponding standard deviations (data not shown).
Relationships of myocardial perfusion at rest and during adenosine induced hyperemia with time to peak systolic strain, strain rate and dyssynchrony (Table 4)
Table 4.
Relationship between rest myocardial perfusion, and time to peak systolic strain, strain rate and their standard deviations. (n=1,100)
| Parameter | Model 1 | Model 2 | Model 3 | |||
|---|---|---|---|---|---|---|
| RC | 95%CI (p) | RC | 95%CI (p) | RC | 95%CI (p) | |
| Time to peak systolic strain |
−51.2 | −95.9 to −6.6 (0.025) |
−73.3 | −129.4 to −17.2 (0.011) |
−68.0 | −123.6 to −12.4 (0.017) |
| Time to peak systolic strain rate |
−16.3 | −38.1 to +5.5 (0.14) |
−32.2 | −59.2 to −5.3 (0.020) |
−29.6 | −56.2 to −2.9 (0.030) |
| SD of time to peak systolic strain |
−13.9 | −41.7 to +13.8 (0.32) |
−28.1 | −54.1 to −2.2 (0.034) |
−27.9 | −55.0 to −0.9 (0.043) |
| SD of time to peak systolic strain rate |
−16.8 | −29.9 to −3.8 (0.012) |
−19.9 | −36.2 to −3.5 (0.018) |
−19.2 | −35.4 to −3.0 (0.021) |
RC-regression coefficient (ms/ml/min/LV mass [gm]).
SD-standard deviation, 95%CI-95% confidence intervals, p-significance
Model 1- Unadjusted. Model 2-adjusted for age gender, ethnicity and BMI.
Model 3-adjusted for #1+smoking, history of hypertension and DM.
In order to further explore the mechanisms underlying the associations between LV mass and age with myocardial dyssynchrony, the association between myocardial perfusion and the times to peak systolic strain, strain rate and their SD were studied in an ancillary study including 74 participants who underwent both contrast enhanced perfusion and tagged MRI studies.
A significant increase in time to peak systolic strain in the lowest tertile of myocardial blood flow (MBF) at rest was found (time to peak systolic strain in the lowest tertile was 329.9 ms vs 294.5 ms in the highest, p=0.034). In addition, time to peak systolic strain rate was longer in the lowest compared with the highest MBF tertile (p=0.03), and the SD of time to peak systolic strain rate was significantly greater in the group with the lowest myocardial blood flow at rest (60.0 ms in the lowest MBF tertile versus 39.8 ms in the highest tertile, p=0.013). (Table C, supplements).
The associations between MBF at rest with time to peak systolic strain, time to peak systolic strain rate and SD of time to peak systolic strain rate became stronger after multivariable adjustment (Table 4, model 3). The relationship between SD of the time to peak systolic strain and MBF at rest tended to be significant (RC=−28.1 ms per 1 ml/min/gm blood flow, [95% CI=−56.8 to 0.67, p=0.055]). In contrast, the associations between the time to peak systolic strain, strain rate and their SD with myocardial blood flow during adenosine induced hyperemia were nonsignificant.
Relationship between global LV function and volumes as well as the QRS Width with time to peak systolic strain, strain rate and dyssynchrony
After multivariable adjustment for demographic characteristics, risk factors and treatment, lower EF was associated with greater time to peak systolic strain (RC= −0.018 ms/ 1% EF, 95% CI= −0.026 to −0.009, p<0.001) and strain rate (RC= −0.047 ms/ 1% EF, p<0.001). In contrast, there was no significant association between EF and the SD of time to peak systolic strain (p=0.11) or strain rate (p=0.086). Increased LV volumes (systolic and diastolic) were related to greater contraction times and myocardial dyssynchrony (Tables D and E, On line Supplement). Interestingly, there were significant relationships between QRS width and both time to peak systolic strain rate and its SD (p<0.001, and p=0.003, respectively, Table F, Online supplement).
Finally, there were no relationships between age and absolute peak systolic strain and strain rates, whereas peak diastolic strain rates were lower with increased age in men. On the other hand, increased LV mass was related to decreased peak systolic strain in men, and to peak systolic and diastolic strain rate in both genders (Online Supplement, Tables G and H, respectively).
Discussion
In the present study we examined relationships between the timing of myocardial contraction, as well as the extent of dyssynchrony with age and left ventricular mass in asymptomatic individuals without history of cardiovascular disease. LV hypertrophy and age are strongly related to the development of heart failure. Significant associations between age and time to peak systolic strain, as well as age and myocardial dyssynchrony were detected. In addition, higher LV mass was related to both delayed systolic contraction and greater LV dyssynchrony, expressed as the SD of time to peak strain rate. These results demonstrate that aging and LV hypertrophy influence the coordination of myocardial contraction before the onset of overt LV dysfunction and symptomatic disease.
To gain further insight into the mechanisms underlying these relationships, associations between myocardial perfusion and time to peak systolic strain and strain rate were studied in a subset of participants who underwent tagged MRI and contrast enhanced myocardial perfusion studies. Lower myocardial perfusion at rest was associated with both an increased time to peak systolic deformation and a greater extent of myocardial dyssnchrony.
Age has been demonstrated as an important risk factor for the development of CHF.1;2 Results from the Cardiovascular Health Study for example, indicate that approximately half of the elderly patients who develop CHF have normal global LV function. These individuals were considered to have diastolic dysfunction.13;14 Mortality of patients with heart failure and preserved systolic function may be lower compared with patients with abnormal systolic function15, although the results from a recent study suggest otherwise16. In elderly patients, diastolic filling rates are reduced17 and it has been shown that both relaxation and ventricular stiffness are abnormal in these patients18. Yet, patients with heart failure and preserved ejection fraction may exhibit abnormal systolic function when evaluated by more sophisticated measures of myocardial performance such as impaired long axis shortening and longitudinal mitral annulus velocities19;20. In addition, previous studies21 have suggested that patients with diastolic HF demonstrate increased diastolic as well as systolic dyssynchrony. In this regard, in the present study, we found changes in systolic contractile performance (e.g systolic dyssynchrony) in conditions that are commonly associated with diastolic dysfunction, e.g increased age and LV hypertrophy, despite preserved global systolic LV function. The ensemble of these findings suggest that diastolic and systolic dysfunction are not distinct entities and in fact represent different aspects of a spectrum of altered myocardial mechanical behavior which include diastolic and systolic abnormalities of varying contributions.
Bonow et al 22 demonstrated by randionuclide angiography that aging was associated with delayed and decreased early diastolic filling, and that these changes were related to regional LV dyssynchrony assessed from regional volume curves. Fonseca et al showed that in elderly individuals there is an increase in regional asynchrony in time to peak relaxation.23. In the current study we confirm those findings suggesting that increased age is indeed associated with a greater extent of dyssynchrony. This may impinge upon early diastolic relaxation through increased post- systolic shortening24 and discoordinate myocardial strain. Delayed myocardial contraction and dyssynchrony may result from myocardial fibrosis, especially in hypertensive patients25 with silent ischemia, or infarction potentially contributing to further ectromechanical uncoupling. In addition, conduction abnormalities could affect the timing of regional myocardial shortening and cause contractile dyssychnrony. Further studies are needed to clarify the mechanisms underlying these associations.
Left ventricular hypertrophy, especially in the form of concentric hypertrophy is associated with the development of CHF and increased incidence of other major cardiovascular events, including sudden death3;4. Initially, LV concentric remodeling is associated with decreased regional LV function manifested as reduced midwall circumferential shortening despite preserved ejection fraction.26;27 Eventually however, patients with LVH tend to develop global systolic dysfunction.28 In our study, we show that increased LV mass is related to delayed regional LV contraction and myocardial dyssynchrony expressed as SD of time to peak systolic strain rate among individuals without history of cardiovascular disease. In contrast, there was no significant relationship between LV mass and SD of time to peak systolic strain. A potential explanation is that increased LV mass might preferentially affect the early phase of systolic contraction manifested as the time to peak systolic strain rate. Another possibility is that strain rate is a more sensitive indicator of systolic contractility than strain. Thus, the earliest changes in myocardial contractility and dyssynchrony would manifest as changes in strain rate rather than strain.
Importantly, there was no significant relationship between the magnitude of concentric hypertrophy (expressed as LV mass/volume ratio) and the timing of regional deformation or LV dyssynchrony. These findings might indicate that LV enlargement and absolute increased LV size (LV mass and volumes) rather than concentric hypertrophy are related to LV dyssynchrony. This finding contrasts with the negative relation between concentric remodeling and peak systolic strain found in previous work.5
It is important to emphasize that the present study is cross-sectional. Therefore, temporality cannot be determined. For example, it is possible that myocardial dyssynchrony might have caused subtle LV dysfunction with compensatory increased LV mass. In addition, survival bias might have affected the results since only asymptomatic individuals without documented cardiovascular disease were included. Whether MESA cohort participants with increased extent of dyssynchrony associated with greater LV mass will develop symptoms of CHF is to be explored.
Finally, we studied the relationship between myocardial perfusion and the timing and SD of LV contraction. In a previous study, we observed that myocardial perfusion reserve, expressed as perfusion during adenosine induced hyperemia was associated with decreased regional LV function manifested as lower peak systolic circumferential shortening12. In the present work, using the same database, decreased regional perfusion at rest was shown to be associated with delayed contraction and greater extent of dyssynchrony, while there was no relationship between perfusion during hyperemia and dyssnchrony. Again, these relationships may be due to increased post-systolic shortening or delayed electromechanical coupling in regions with reduced perfusion.
Methodological considerations
The present work includes 1,100 asymptomatic individuals from the MESA cohort, making it one of the largest tagged MRI studies that we are aware of. The study cohort was multi-ethnic, thus enhancing the generalization of the study results. Tagged MRI is a robust technique for analyzing regional LV function without limitations of acoustic window or scanning angles, although its temporal resolution (approximately 40 ms) is inferior to echocardiography.
This study is cross sectional. Therefore, cause-effect relationships cannot be established. Moreover, the results of the present study should be interpreted in view of the study design and exclusion of individuals with symptoms or history of cardiovascular disease. Hence, patients with the most pronounced degree of LVH and/or LV dysfunction might have been excluded, thus potentially blunting the strength of the reported associations.
There are several methods for assessing myocardial dyssynchrony. As an index of intraventricular dyssynchrony, we used the standard deviation of the time to peak systolic strain and strain rate in 12 regions, a modification of a method used by Yu et al11. This index was found to have better specificity and sensitivity than alternative methods for predicting reverse remodeling after resynchronization therapy.
Only circumferential strain was used, since the results of circumferential strain were found to be more reproducible than radial strain.29 In a work done by Carlsson et al30, it has been shown that a major contribution to the overall stroke volume (60%) is generated by longitudinal atrioventricular plane displacement. Our current database does not allow us to examine the potential contribution of longitudinal atrioventricular displacement to myocardial dyssynchrony could. Finally, we used LV mass indexed by height2.7. Repeated analyses of absolute as well as LV mass indexed by BSA yielded similar results.
In conclusion, among asymptomatic individuals without history or symptoms of cardiovascular disease, aging, increased LV mass and reduced myocardial perfusion are associated with delayed regional myocardial contraction and a greater extent of myocardial dyssynchrony. These associations may reflect incipient myocardial impairment preceding the development of overt LV dysfunction and symptomatic disease.
Supplementary Material
Acknowledgments
The authors thank the participants of the MESA trial and the entire community of MESA investigators and staff for their support and valuable contributions. A full list of participating MESA investigators and institutions can be found at http://www.mesa-nhlbi.org
Funding Sources
This study was supported by an NHLBI grant (RO1-HL66075-01) and Multi-Ethnic Study of Atherosclerosis contracts (NO1-HC-95162, NO1-HC-95168, and NO1-HC-95169). Dr. Lima and Dr. Bluemke were also supported by Johns Hopkins Reynolds Center.
Footnotes
Age and myocardial hypertrophy are associated with the development of left ventricular dysfunction and heart failure. Myocardial dyssynchrony is also related to the development and progression of heart failure. Our goal was to study the relationship between LV mass and age with dyssynchrony in asymptomatic participants of the MESA study and to obtain more insight into the mechanisms underlying the development of myocardial dysfunction. 1,100 individuals underwent tagged MRI. Their regional LV function was analyzed using time-parameters of myocardial deformation including time peak systolic strain and strain rate. Myocardial dyssynchrony was expressed by standard deviation (SD) of time to peak strain and strain rate. There was a direct relationship between age and delayed time to peak strain, and a greater extent of dyssynchrony. Importantly, there was also significant association between LV mass and time to peak strain, time to peak strain rate, and the SD of time to strain rate. In a subset of patients (74), the relationship between myocardial perfusion with timing of contraction was studied. Decreased myocardial perfusion at rest was associated with delayed contraction and increased extent of dyssynchrony. These new data may enhance our understanding of the development of myocardial dysfunction and its possible prevention. We believe that myocardial dyssynchrony may explain, at least partly, the well-known association between aging and LV hypertrophy and LV dysfunction. This association may be mediated by changes in myocardial perfusion. Yet, the temporal relationships between aging, LV hypertrophy, reduced myocardial perfusion, dyssynchrony and LV dysfunction should be further clarified.
Study registration: Multi-Ethnic Study of Atherosclerosis.
Disclosures
There are no conflicts of interest or disclosures.
Reference List
- 1.Haldeman GA, Croft JB, Giles WH, Rashidee A. Hospitalization of patients with heart failure: National Hospital Discharge Survey, 1985 to 1995. Am Heart J. 1999;137:352–360. doi: 10.1053/hj.1999.v137.95495. [DOI] [PubMed] [Google Scholar]
- 2.Kannel WB, Belanger AJ. Epidemiology of heart failure. Am Heart J. 1991;121:951–957. doi: 10.1016/0002-8703(91)90225-7. [DOI] [PubMed] [Google Scholar]
- 3.Haider AW, Larson MG, Benjamin EJ, Levy D. Increased left ventricular mass and hypertrophy are associated with increased risk for sudden death. J Am Coll Cardiol. 1998;32:1454–1459. doi: 10.1016/s0735-1097(98)00407-0. [DOI] [PubMed] [Google Scholar]
- 4.Koren MJ, Devereux RB, Casale PN, Savage DD, Laragh JH. Relation of left ventricular mass and geometry to morbidity and mortality in uncomplicated essential hypertension. Ann Intern Med. 1991;114:345–352. doi: 10.7326/0003-4819-114-5-345. [DOI] [PubMed] [Google Scholar]
- 5.Rosen BD, Edvardsen T, Lai S, Castillo E, Pan L, Jerosch-Herold M, Sinha S, Kronmal R, Arnett D, Crouse JR, III, Heckbert SR, Bluemke DA, Lima JA. Left ventricular concentric remodeling is associated with decreased global and regional systolic function: the Multi-Ethnic Study of Atherosclerosis. Circulation. 2005;112:984–991. doi: 10.1161/CIRCULATIONAHA104.500488. [DOI] [PubMed] [Google Scholar]
- 6.Grines CL, Bashore TM, Boudoulas H, Olson S, Shafer P, Wooley CF. Functional abnormalities in isolated left bundle branch block. The effect of interventricular asynchrony. Circulation. 1989;79:845–853. doi: 10.1161/01.cir.79.4.845. [DOI] [PubMed] [Google Scholar]
- 7.Prinzen FW, Cheriex EC, Delhaas T, van Oosterhout MF, Arts T, Wellens HJ, Reneman RS. Asymmetric thickness of the left ventricular wall resulting from asynchronous electric activation: a study in dogs with ventricular pacing and in patients with left bundle branch block. Am Heart J. 1995;130:1045–1053. doi: 10.1016/0002-8703(95)90207-4. [DOI] [PubMed] [Google Scholar]
- 8.Bild DE, Bluemke DA, Burke GL, Detrano R, Diez Roux AV, Folsom AR, Greenland P, Jacob DR, Jr, Kronmal R, Liu K, Nelson JC, O'Leary D, Saad MF, Shea S, Szklo M, Tracy RP. Multi-ethnic study of atherosclerosis: objectives and design. Am J Epidemiol. 2002;156:871–881. doi: 10.1093/aje/kwf113. [DOI] [PubMed] [Google Scholar]
- 9.Natori S, Lai S, Finn JP, Gomes AS, Hundley WG, Jerosch-Herold M, Pearson G, Sinha S, Arai A, Lima JA, Bluemke DA. Cardiovascular function in multi-ethnic study of atherosclerosis: normal values by age, sex, and ethnicity. AJR Am J Roentgenol. 2006;186:S357–S365. doi: 10.2214/AJR.04.1868. [DOI] [PubMed] [Google Scholar]
- 10.Osman NF, Prince JL. Visualizing myocardial function using HARP MRI. Phys Med Biol. 2000;45:1665–1682. doi: 10.1088/0031-9155/45/6/318. [DOI] [PubMed] [Google Scholar]
- 11.Yu CM, Zhang Q, Fung JW, Chan HC, Chan YS, Yip GW, Kong SL, Lin H, Zhang Y, Sanderson JE. A novel tool to assess systolic asynchrony and identify responders of cardiac resynchronization therapy by tissue synchronization imaging. J Am Coll Cardiol. 2005;45:677–684. doi: 10.1016/j.jacc.2004.12.003. [DOI] [PubMed] [Google Scholar]
- 12.Rosen BD, Lima JA, Nasir K, Edvardsen T, Folsom AR, Lai S, Bluemke DA, Jerosch-Herold M. Lower myocardial perfusion reserve is associated with decreased regional left ventricular function in asymptomatic participants of the multi-ethnic study of atherosclerosis. Circulation. 2006;114:289–297. doi: 10.1161/CIRCULATIONAHA.105.588525. [DOI] [PubMed] [Google Scholar]
- 13.Kitzman DW, Gardin JM, Gottdiener JS, Arnold A, Boineau R, Aurigemma G, Marino EK, Lyles M, Cushman M, Enright PL. Importance of heart failure with preserved systolic function in patients > or = 65 years of age. CHS Research Group. Cardiovascular Health Study. Am J Cardiol. 2001;87:413–419. doi: 10.1016/s0002-9149(00)01393-x. [DOI] [PubMed] [Google Scholar]
- 14.Gottdiener JS, Arnold AM, Aurigemma GP, Polak JF, Tracy RP, Kitzman DW, Gardin JM, Rutledge JE, Boineau RC. Predictors of congestive heart failure in the elderly: the Cardiovascular Health Study. J Am Coll Cardiol. 2000;35:1628–1637. doi: 10.1016/s0735-1097(00)00582-9. [DOI] [PubMed] [Google Scholar]
- 15.Gottdiener JS, McClelland RL, Marshall R, Shemanski L, Furberg CD, Kitzman DW, Cushman M, Polak J, Gardin JM, Gersh BJ, Aurigemma GP, Manolio TA. Outcome of congestive heart failure in elderly persons: influence of left ventricular systolic function. The Cardiovascular Health Study. Ann Intern Med. 2002;137:631–639. doi: 10.7326/0003-4819-137-8-200210150-00006. [DOI] [PubMed] [Google Scholar]
- 16.Bhatia RS, Tu JV, Lee DS, Austin PC, Fang J, Haouzi A, Gong Y, Liu PP. Outcome of heart failure with preserved ejection fraction in a population-based study. N Engl J Med. 2006;355:260–269. doi: 10.1056/NEJMoa051530. [DOI] [PubMed] [Google Scholar]
- 17.Kitzman DW, Sheikh KH, Beere PA, Philips JL, Higginbotham MB. Age-related alterations of Doppler left ventricular filling indexes in normal subjects are independent of left ventricular mass, heart rate, contractility and loading conditions. J Am Coll Cardiol. 1991;18:1243–1250. doi: 10.1016/0735-1097(91)90542-h. [DOI] [PubMed] [Google Scholar]
- 18.Zile MR, Baicu CF, Gaasch WH. Diastolic heart failure--abnormalities in active relaxation and passive stiffness of the left ventricle. N Engl J Med. 2004;350:1953–1959. doi: 10.1056/NEJMoa032566. [DOI] [PubMed] [Google Scholar]
- 19.Yip G, Wang M, Zhang Y, Fung JW, Ho PY, Sanderson JE. Left ventricular long axis function in diastolic heart failure is reduced in both diastole and systole: time for a redefinition? Heart. 2002;87:121–125. doi: 10.1136/heart.87.2.121. [DOI] [PMC free article] [PubMed] [Google Scholar]
- 20.Borges MC, Colombo RC, Goncalves JG, Ferreira JO, Franchini KG. Longitudinal mitral annulus velocities are reduced in hypertensive subjects with or without left ventricle hypertrophy. Hypertension. 2006;47:854–860. doi: 10.1161/01.HYP.0000216123.57284.b0. [DOI] [PubMed] [Google Scholar]
- 21.Wang J, Kurrelmeyer KM, Torre-Amione G, Nagueh SF. Systolic and diastolic dyssynchrony in patients with diastolic heart failure and the effect of medical therapy. J Am Coll Cardiol. 2007;49:88–96. doi: 10.1016/j.jacc.2006.10.023. [DOI] [PubMed] [Google Scholar]
- 22.Bonow RO, Vitale DF, Bacharach SL, Maron BJ, Green MV. Effects of aging on asynchronous left ventricular regional function and global ventricular filling in normal human subjects. J Am Coll Cardiol. 1988;11:50–58. doi: 10.1016/0735-1097(88)90166-0. [DOI] [PubMed] [Google Scholar]
- 23.Fonseca CG, Oxenham HC, Cowan BR, Occleshaw CJ, Young AA. Aging alters patterns of regional nonuniformity in LV strain relaxation: a 3-D MR tissue tagging study. Am J Physiol Heart Circ Physiol. 2003;285:H621–H630. doi: 10.1152/ajpheart.01063.2002. [DOI] [PubMed] [Google Scholar]
- 24.Skulstad H, Edvardsen T, Urheim S, Rabben SI, Stugaard M, Lyseggen E, Ihlen H, Smiseth OA. Postsystolic shortening in ischemic myocardium: active contraction or passive recoil? Circulation. 2002;106:718–724. doi: 10.1161/01.cir.0000024102.55150.b6. [DOI] [PubMed] [Google Scholar]
- 25.Lopez B, Gonzalez A, Querejeta R, Diez J. The use of collagen-derived serum peptides for the clinical assessment of hypertensive heart disease. J Hypertens. 2005;23:1445–1451. doi: 10.1097/01.hjh.0000173780.67308.f1. [DOI] [PubMed] [Google Scholar]
- 26.Aurigemma GP, Silver KH, Priest MA, Gaasch WH. Geometric changes allow normal ejection fraction despite depressed myocardial shortening in hypertensive left ventricular hypertrophy. J Am Coll Cardiol. 1995;26:195–202. doi: 10.1016/0735-1097(95)00153-q. [DOI] [PubMed] [Google Scholar]
- 27.Edvardsen T, Rosen BD, Pan L, Jerosch-Herold M, Lai S, Hundley WG, Sinha S, Kronmal RA, Bluemke DA, Lima JA. Regional diastolic dysfunction in individuals with left ventricular hypertrophy measured by tagged magnetic resonance imaging--the Multi-Ethnic Study of Atherosclerosis (MESA) Am Heart J. 2006;151:109–114. doi: 10.1016/j.ahj.2005.02.018. [DOI] [PubMed] [Google Scholar]
- 28.Drazner MH, Rame JE, Marino EK, Gottdiener JS, Kitzman DW, Gardin JM, Manolio TA, Dries DL, Siscovick DS. Increased left ventricular mass is a risk factor for the development of a depressed left ventricular ejection fraction within five years: the Cardiovascular Health Study. J Am Coll Cardiol. 2004;43:2207–2215. doi: 10.1016/j.jacc.2003.11.064. [DOI] [PubMed] [Google Scholar]
- 29.Castillo E, Osman NF, Rosen BD, El Shehaby I, Pan L, Jerosch-Herold M, Lai S, Bluemke DA, Lima JA. Quantitative assessment of regional myocardial function with MR-tagging in a multi-center study: interobserver and intraobserver agreement of fast strain analysis with Harmonic Phase (HARP) MRI. J Cardiovasc Magn Reson. 2005;7:783–791. doi: 10.1080/10976640500295417. [DOI] [PubMed] [Google Scholar]
- 30.Carlsson M, Ugander M, Mosen H, Buhre T, Arheden H. Atrioventricular plane displacement is the major contributor to left ventricular pumping in healthy adults, athletes, and patients with dilated cardiomyopathy. Am J Physiol Heart Circ Physiol. 2007;292:H1452–H1459. doi: 10.1152/ajpheart.01148.2006. [DOI] [PubMed] [Google Scholar]
Associated Data
This section collects any data citations, data availability statements, or supplementary materials included in this article.


