Abstract
We demonstrate a method of cascading multiple diffractive elements for improving the purity of spectral dispersion. The cross-axis cascade was implemented in a two-stage grating spectrograph, resulting in a hundredfold reduction of stray light and a high dynamic range up to −75 dB. The technique can be used for parallel spectral measurements and processing.
Spectrally dispersive devices, such as diffraction gratings, have been indispensable in numerous applications from spectrometry and multiplexing to filtering and pulse shaping [1,2]. High spectral purity in the dispersed spectrum is almost always desirable [3–5], but the crosstalk between different spectral components inevitably occurs owing to either the device’s intrinsic transfer function or various practical limitations, such as finite finesse in a tilted Fabry—Perot etalon [6], or stray light in a ruled diffraction grating. In this Letter, we demonstrate a simple technique to enhance the spectral contrast from conventional dispersive elements. The technique is based on cascading multiple elements with orthogonal dispersion axes and is thus termed cross-axis cascade (CAS). Using a double-grating cascade in conjunction with a detector array and a measurement algorithm, we demonstrate a spectrograph with high dynamic range of up to 75 dB, which represents more than a thousandfold improvement over conventional spectrographs and commercially available parallel spectrometers.
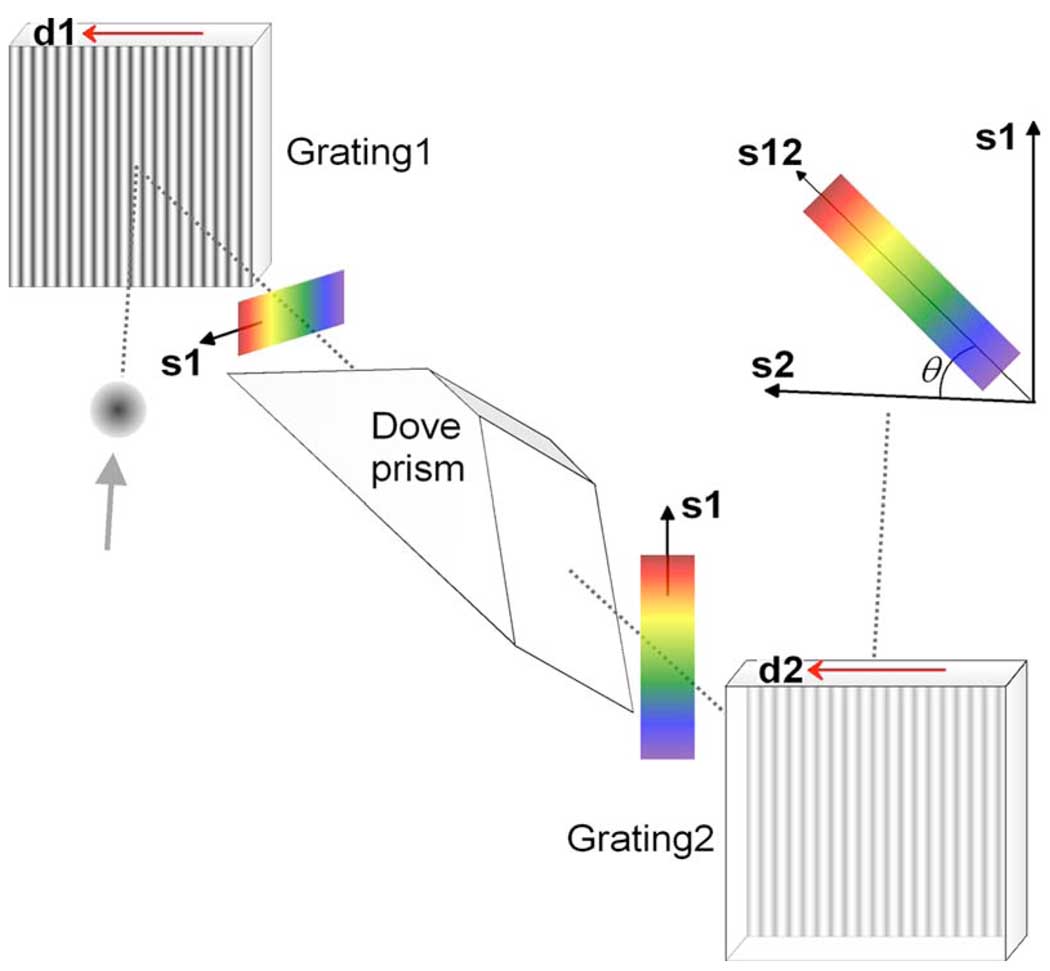
Figure 1 shows a schematic of a two-stage grating cascade. The basic design concept is that the spectral axis (s1) of the optical beam after a grating, Grating1, is made orthogonal to the dispersion axis (d2) of the next grating, Grating2. Simply rotating the orientation of the second grating by 90° would make the beam diffract vertically and complicate the optical alignment. We employed a 45°-tilted Dove prism (image rotator) so that the beam propagation direction (through the center of the spectrum) remains on the horizontal plane of the setup. After Grating2 the final output spectrum is dispersed along an oblique axis (s12) rather than the intrinsic spectral axis (s2) of Grating2. Improvement of spectral contrast stems from the fact that the stray light produced by the nonuniformity of a grating is mostly confined to the line along its dispersion axis. The stray light after Grating1 is overlapped with the dispersed spectrum (i.e., signal) on the s1 axis. However, at each spatial location along the axis, the frequency of stray light is different from that of the dispersed spectrum, so after Grating2 they are spatially separated from each other. Similarly, the stray light generated by Grating2 itself is dispersed horizontally in the s2 axis, which likewise is separated from the final spectrum dispersed in the s12 axis. Consequently, the CAS grating spreads the stray light in two dimensions while keeping the signal in one dimension (s12). In contrast, cascading two gratings with the parallel axes would merely shuffle the stray light within the same dispersion axis and thus does not improve the contrast (see, e.g., Fig. 5). In scanning monochromators, the parallel-axis multistage grating can improve the dynamic range. In this case, the signal at each stage is focused to zero dimension (a point) and isolated from the stray light that is spread in one dimension (a line). Although high dynamic ranges of >80 dB [7] have been achieved, the scanning instruments can measure only one specific wavelength at a time. The CAS extends the filtering mechanism to the higher dimensions, allowing the entire spectrum to be processed simultaneously and more rapidly without scanning.
Fig. 1.
(Color online) Configuration of a two-stage CAS grating using a Dove prism.
Fig. 5.
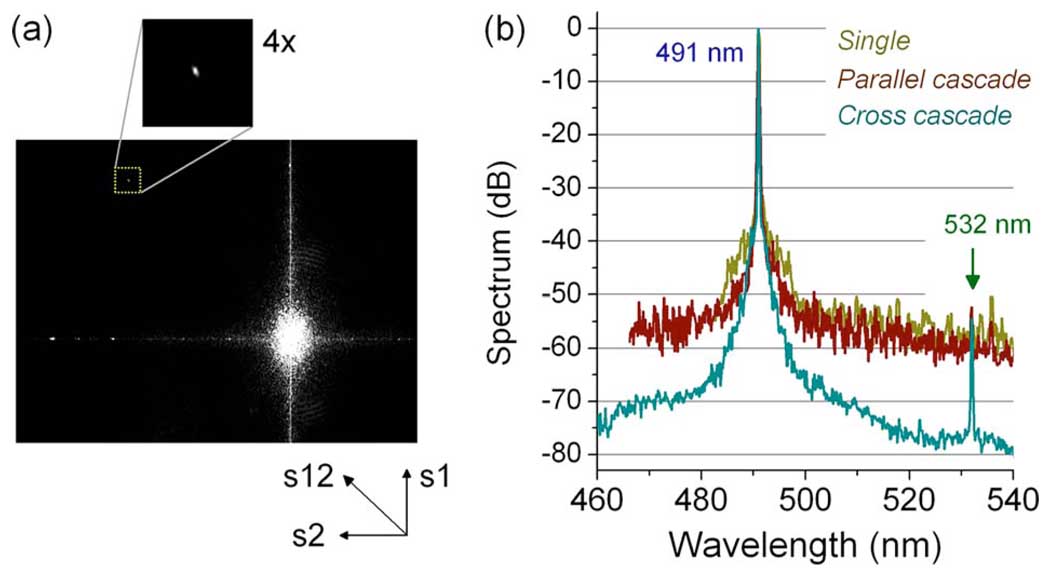
(Color online) Comparisons of spectrographs. (a) Typical diffraction pattern recorded by the camera in the cross-axis double-grating spectrograph. Inset shows the signal at 532 nm separated from the strong saturated signal at 532 nm. (b) Measured spectra.
Consider the following grating equation: mλ =p(sin α+sin β), where m denotes the diffraction order, λ denotes the optical wavelength, and p denotes the grating pitch; α and β are the input and output incident angles. The angle θ between the s12 and the horizontal s2 axes can be calculated to be tan θ=(p2/p1)(cos β2/cos β1)(l1/l2)(m1/m2). Here, the subscripts refer to Grating1 and Grating2, and l1,2 are the distances of the measurement plane from the gratings. We find θ=90° on the surface of Grating2 (∵l2=0), and θ=45° at infinity (l1=l2) for two identical stages. The resolving power increases with √N for N identical gratings. The use of Dove prisms facilitates cascading more than two gratings to further enhance the spectral contrast. For example, a second 22.5°-tilted Dove prism can be used to rotate the 45° s12 axis to be vertical, followed by a vertical slit and a third grating. A tilted Dove prism causes some polarization change owing to phase shifts upon total internal reflection within the prism. However, the maximum energy conversion between the polarization states is less than 1% [8]. The finite aperture size of the prisms may limit the measurable spectral range [9], but this problem can be mitigated by employing relay imaging optics between the gratings.
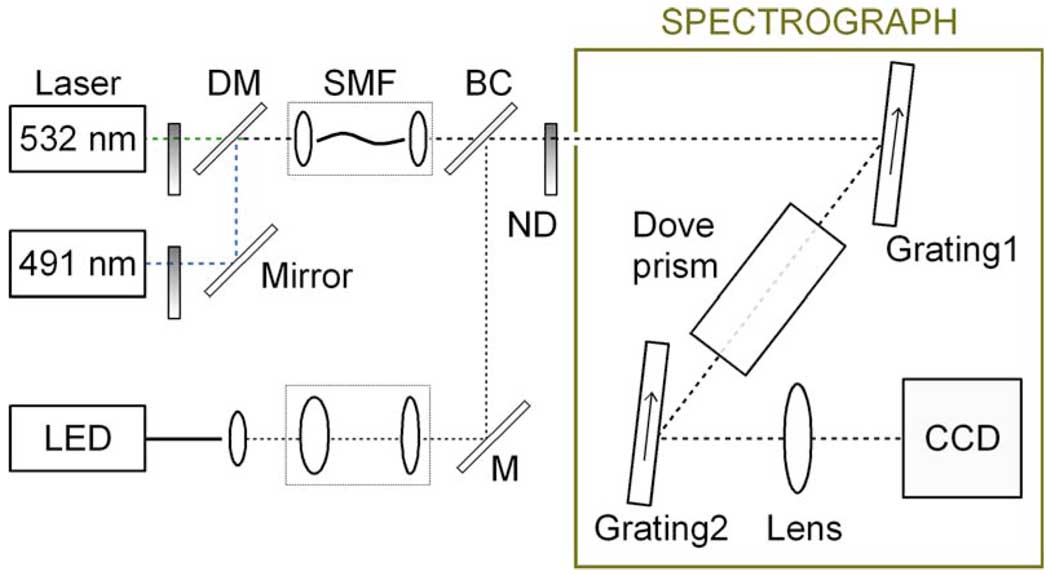
Figure 2 shows a schematic of the experimental setup. For light sources, we used a fiber-bundle-pigtailed white-light-emitting diode (LED) and two single-frequency lasers at 491 and 532 nm (Cobolt), multiplexed by a broadband pellicle beam combiner and dichroic mirror. We employed neutral density (ND) filters to vary the laser power and a single-mode fiber to improve the spatial beam quality (1/e2 diameter of ~2 mm). For the spectrograph, we used two identical ruled diffraction gratings (Edmund Optics) with p=833 nm and a 45-mm-long Dove prism with a 15 mm×15 mm input aperture. The diffraction efficiency at m = 1 was about 10% at 491 nm and 17% at 532 nm owing to unoptimized groove density and blazed angle.
Fig. 2.
(Color online) Experimental setup. ND, neutral density filter; DM, dichroic mirror; SMF, single-mode fiber; BC, beam combiner; M, mirror.
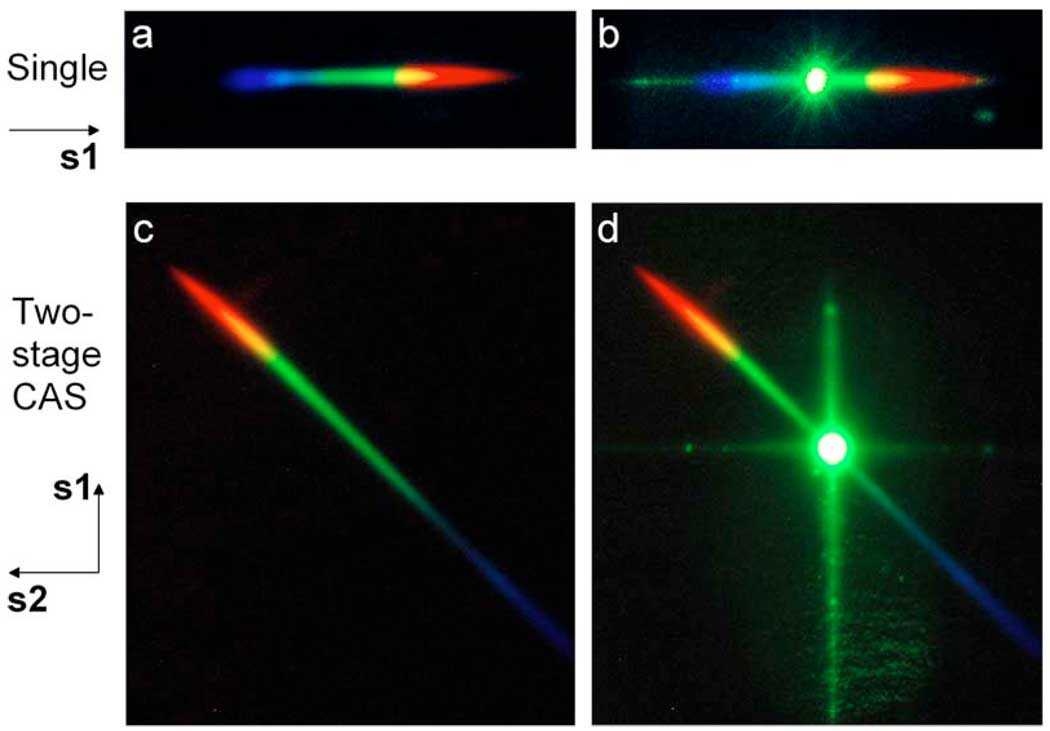
Figure 3 shows the digital photographs (DS200, Nikon) of the diffracted beam after each grating focused on a white glossy paper. Figures 3(a) and 3(c) feature the rainbow spectra of the LED white light (5 µW) alone after Grating1 and Grating2, respectively. When both the LED and green laser light (150 µW) were used, the output spectrum after Grating1 contains the stray light leaked from the intense green beam at Grating1 [Fig. 3(b)]. In contrast, in CAS [Fig. 3(d)], Grating1 stray light remains along the vertical axis (s1), Grating2 stray light is displaced horizontally (s2), while the LED spectrum is dispersed along the oblique axis (s12). This result demonstrates the principle of contrast enhancement in CAS grating.
Fig. 3.
(Color online) Optical spectra in the two-stage cross-axis spectrograph. (a),(b) Spectra measured after Grating1 (a) with only LED light as an input and (b) with both LED and intense green laser light. Green stray light produced by Grating1 is overlapped with the rainbow spectrum. (c),(d) Spectra measured after Grating2 (c) with only the LED input and (d) with both the LED and laser. The stray light lies along the vertical and horizontal lines, easily separable from the spectrum along the oblique axis at about 45°.
To quantify the contrast improvement, we used a CCD camera (Cascade 650, Photometrics) in the spectrograph. Although a linear camera mounted at 45° angle may be used, the two-dimensional camera with 653×492 pixels facilitated the experiments. The camera was operated with an integration time of 33 or 100 ms and a linear full well depth of about 24,000 electrons (~48,000 photons). The output beam after Grating2 was focused onto the camera by a lens with 45 mm focal length for a dispersion slope of 0.2 nm per pixel. This and other typical cameras offer a dynamic range—the ratio of full well depth and readout noise—of 30–40 dB, which limits the measurable spectral contrast. To overcome this limitation, we devised a method of recording the spectrum at various optical power levels and subsequently reconstructing the spectrum with full optical dynamic range.
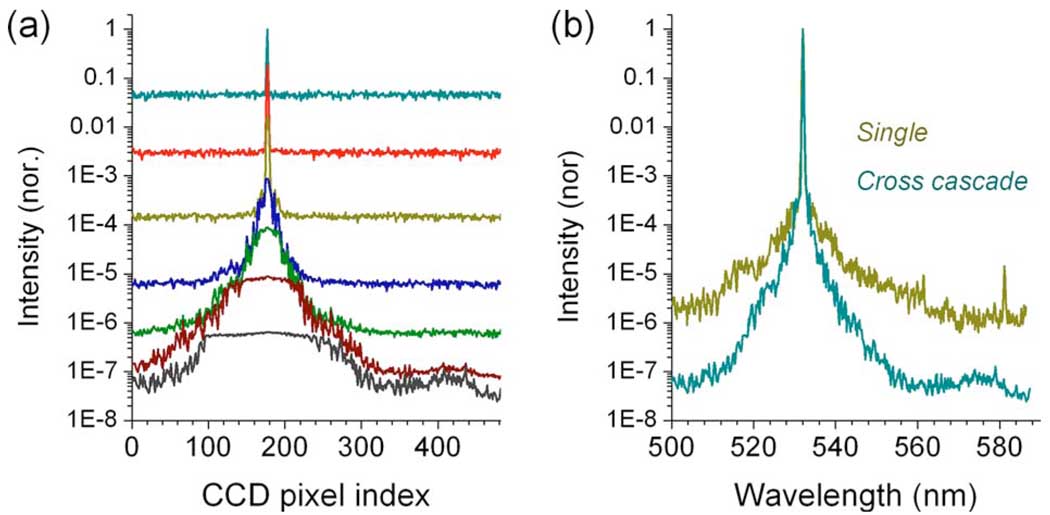
Figure 4(a) illustrates the measurement method. We measured a set of data with a green laser input (1 mW) after attenuation by various ND filters (0 to 7 optical densities). The spectra were rescaled according to the respective attenuation levels. The data measured with large attenuation show the narrow laser line at 532 nm, whereas the spectra obtained with low attenuation highlight the background owing to stray light. We implemented a simple algorithm in MATLAB to retrieve the full features of the optical spectrum by enveloping the measured curves. Figure 4(b) shows the reconstructed spectra over a 90 nm span. The pedestal around the 532 nm line is probably due to the focal profile of the imperfect Gaussian beam. The noise floor appears at about −75 dB level, limited by grating stray light and light scattered from other optical components. For comparison, we repeated the same measurement with a single-stage spectrograph. The result depicted in Fig. 4(b) clearly shows a reduction of the noise floor by 10 to 20 dB in the cross-axis spectrograph. We did not correct for the wavelength dependence of the grating efficiency in Fig. 4(b). The noise floor at longer wavelengths is underestimated by about 2 dB for single and 4 dB for double grating.
Fig. 4.
(Color online) Measured spectrum. (a) Spectra of laser line at 532 nm measured with various ND filters of OD=0, 1.2, 2.5, 3.9, 4.9, 5.9, and 7, respectively. (b) Full-range spectra reconstructed from the datasets obtained with double cross-axis gratings and single grating only.
Finally, we tested the ability to detect a weak laser line at 532 nm in the presence of a much stronger line at 491 nm. Figure 5(a) shows a typical CCD output in the cross-axis two-stage spectrograph, showing highly saturated signal due to the blue laser light (0.3 µW on the CCD). The image also shows horizontal (s2) and vertical (s1) stray light lines and a vertical streak artifact due to CCD saturation. The signal corresponding to the much weaker green laser (0.3 pW) is in the space marked by a dotted box, distinctly separated from the stray lines. Figure 5(b) depicts the spectrum measured along the diagonal dispersive axis (s12). For comparison, we performed the same measurements with single-grating and parallel-axis double-grating spectrographs. The results, plotted in Fig. 5(b), clearly show that the parallel-axis cascade offers no advantage in terms of spectral contrast. The resulting dynamic range of 60 dB is insufficient to discern the green laser line, whereas CAS clearly resolves the signal at 532 nm.
The CAS spectrograph is reminiscent of echelle spectrographs [10], where multiple diffraction orders of a high resolution disperser (e.g., echelle grating) are separated by a perpendicular diffraction grating or prism [11]. In these instruments, though, contrast is not improved, because spectrum and stray light occupy the same two-dimensional space.
In conclusion, we have shown that cascading multiple diffraction gratings improves the spectral purity in the output. Using this technique and a multistep measurement algorithm, we have demonstrated a spectrograph with a high dynamic range comparable with that of the state-of-the-art multistage grating monochromators but without compromising the capability of parallel detection. The technique is simple to implement with any type of spectral disperser and is expected to be useful in many instrumentations and laboratory experiments involving parallel spectral splitting, combining, and measurement.
Acknowledgments
This work was funded in part by the United States Department of Defense (FA9550-04-1-0079), Tosteson Postdoctoral Fellowship (G. Scarcelli), and Cross Disciplinary Fellowship from the Human Frontier Science Program (P. Kim).
References
- 1.Demtröder W. Laser Spectroscopy. Springer-Verlag; 2003. [Google Scholar]
- 2.Weiner AM. Rev. Sci. Instrum. 2000;71:1929. [Google Scholar]
- 3.Khosravani R, Hayee MI, Hoanca B, Willner AE. IEEE Photon. Technol. Lett. 1999;11:134. [Google Scholar]
- 4.Arshinov YF, Bobrovnikov SM, Zuev VE, Mitev VM. Appl. Opt. 1983;22:2984. doi: 10.1364/ao.22.002984. [DOI] [PubMed] [Google Scholar]
- 5.Kerr JB, McElroy CT. Science. 1993;262:1032. doi: 10.1126/science.262.5136.1032. [DOI] [PubMed] [Google Scholar]
- 6.Scarcelli G, Yun SH. Nat. Photonics. 2008;2:39. doi: 10.1038/nphoton.2007.250. [DOI] [PMC free article] [PubMed] [Google Scholar]
- 7.Ohana I, Yacoby Y, Bezalel M. Rev. Sci. Instrum. 1986;57:9. [Google Scholar]
- 8.Moreno I. Appl. Opt. 2004;43:3373. doi: 10.1364/ao.43.003373. [DOI] [PubMed] [Google Scholar]
- 9.Moreno I, Paez G, Strojnik M. Appl. Opt. 2003;42:4514. doi: 10.1364/ao.42.004514. [DOI] [PubMed] [Google Scholar]
- 10.Voigt SS, Allen SL, Bigelow BC, Bresee L, Pardeilhan GH, Pfister T, Ricketts T, Robinson LB, Stover RJ, Tucker D, Ward JM, Wei MI. Proc. SPIE. 1994;2198:362. [Google Scholar]
- 11.Xiao S, Weiner A. Opt. Express. 2004;12:2895. doi: 10.1364/opex.12.002895. [DOI] [PubMed] [Google Scholar]


