

Abstract
We present a database of copy number variations (CNVs) detected in 2026 disease-free individuals, using high-density, SNP-based oligonucleotide microarrays. This large cohort, comprised mainly of Caucasians (65.2%) and African-Americans (34.2%), was analyzed for CNVs in a single study using a uniform array platform and computational process. We have catalogued and characterized 54,462 individual CNVs, 77.8% of which were identified in multiple unrelated individuals. These nonunique CNVs mapped to 3272 distinct regions of genomic variation spanning 5.9% of the genome; 51.5% of these were previously unreported, and >85% are rare. Our annotation and analysis confirmed and extended previously reported correlations between CNVs and several genomic features such as repetitive DNA elements, segmental duplications, and genes. We demonstrate the utility of this data set in distinguishing CNVs with pathologic significance from normal variants. Together, this analysis and annotation provides a useful resource to assist with the assessment of CNVs in the contexts of human variation, disease susceptibility, and clinical molecular diagnostics.
Copy number variation (CNV) in the human genome significantly influences human diversity and predisposition to disease (Sebat et al. 2004, 2007; Sharp et al. 2005; Conrad et al. 2006; Feuk et al. 2006; Hinds et al. 2006; McCarroll et al. 2006; Redon et al. 2006; Kidd et al. 2008; Perry et al. 2008; Walsh et al. 2008). CNVs arise from genomic rearrangements, primarily owing to deletion, duplication, insertion, and unbalanced translocation events. The pathogenic role of CNVs in genetic disorders has been well documented (Lupski and Stankiewicz 2005), yet the extent to which CNVs contribute to phenotypic variation and complex disease predisposition remains poorly understood. CNVs have been known to contribute to genetic disease through different mechanisms, resulting in either imbalance of gene dosage or gene disruption in most cases. In addition to their direct correlation with genetic disorders, CNVs are known to mediate phenotypic changes that can be deleterious (Feuk et al. 2006; Freeman et al. 2006). Recently, several studies have reported an increased burden of rare or de novo CNVs in complex disorders such as Autism, ADHD, and schizophrenia as compared to normal controls, highlighting the potential pathogenicity of rare or unique CNVs (Sebat et al. 2007; International Schizophrenia Consortium 2008; Stefansson et al. 2008; Walsh et al. 2008; Xu et al. 2008; Elia et al. 2009). Thus, more thorough analysis of genomic CNVs is necessary in order to determine their role in conveying disease risk.
Several approaches have been used to examine CNVs in the genome, including array CGH and genotyping microarrays (Albertson and Pinkel 2003; Iafrate et al. 2004; Sebat et al. 2004; Sharp et al. 2005; Redon et al. 2006; Wong et al. 2007). Results from more than 30 studies comprising 21,000 CNVs have been reported in public repositories (Iafrate et al. 2004). However, a majority of these studies have been performed on limited numbers of individuals using a variety of nonuniform technologies, reporting methods, and disease states. In addition, these data are both substantially reiterative and enriched in CNV events that are frequently observed in one or more populations. Thus, extreme care is needed in determining whether a particular structural variant plays a role in disease susceptibility or progression. To address these challenges, we identified and characterized the constellation of CNVs observed in a large cohort of healthy children and their parents, when available. This study uses uniform measures to detect and assess CNVs within the context of genomic and functional annotations, as well as to demonstrate the utility of this information in assessing their impact on abnormal phenotypes. Our analysis and annotation provide a useful resource to assist with the assessment of structural variants in the contexts of human variation, disease susceptibility, and clinical molecular diagnostics.
Results
Assessment of copy number variation in 2026 healthy individuals
DNA samples analyzed in our study were obtained from the whole blood of healthy subjects routinely seen at primary care and well-child clinic practices within the Children's Hospital of Philadelphia (CHOP) Health Care Network. All samples were uniformly genotyped using the Illumina HumanHap 550 BeadChip. Genotype data were analyzed for CNVs using Illumina's BeadStudio software in combination with CNV detection methodologies developed by our group. Data from 2026 individuals were used for CNV analysis, comprising 1320 Caucasians (65.2%), 694 African-Americans (34.2%), and 12 Asian-Americans (0.6%). Overall, we detected a total of 54,462 CNVs, with an average of 26.9 CNVs per individual (range 4–79) (Supplemental Table 1). Collectively, these CNVs spanned 551,995,356 unique base pairs, or ∼19.4% of the total human genome.
A majority of the CNVs detected (77.8%) were classified as nonunique CNVs as they were observed in more than one unrelated individual (Table 1). Although it is likely that some nonunique CNVs may represent false-positives due to platform-specific artifacts, a vast majority of them are hypothesized to be real as they were detected independently in more than one unrelated individual. This is supported by our experimental validation of nonunique CNVs using quantitative PCR (see below). We selected nonunique CNVs sharing at least 80% overlap in SNP content for further analysis and annotation. Mean and median sizes of nonunique CNVs were 38.3 kb and 7.2 kb, respectively. A vast majority (93.8%) of these nonunique events shared identical start and end positions with at least one additional CNV.
Table 1.
Summary characteristics of nonunique CNVs

The remaining 22.2% of events were classified as unique CNVs since each event was detected in just one individual. The unique CNV set likely includes rare, individual-specific variants as well as potential false-positives. The unique and nonunique data sets are available for download at http://cnv.chop.edu.
We used a combination of experimental methods to provide validation for a representative set of CNVs detected in our population, including CNVs of different size classes (Table 2). Methods included cross-platform validation with the Affymetrix 6.0 array, quantitative PCR, fluorescent in situ hybridization (FISH), multiplex ligation-dependent probe amplification (MLPA), and comparison with reported fosmid end-sequencing results (Table 2; Methods; Supplemental Methods). The array-based comparison suggested an overall validation rate of 72.7% (Table 2). For CNVs represented by more than 10 probes on the Illumina platform, our validation rate was >96% with a gradual decrease in validation with reducing numbers of probes. This analysis provides a conservative estimate of the true positive rate of CNVs, categorized by probe content, detected using our methods. The validation rate for nonunique CNVs, spanning two to nine probes, as measured by quantitative PCR, was 80%. All deletions (12/12) spanning two to nine probes were validated, while duplications spanning two to nine probes had a much lower validation rate of 50%. This combined with the array-based comparison results yields a conservative false discovery rate upper bound of 50% for CNVs spanning two to nine probes.
Table 2.
Validation of CNVs

aTotal number validated/total number tested.
(NT) Not tested; (NA) not applicable.
Generation of CNV database and web-based resource
All CNVs identified in this study are available at http://cnv.chop.edu. A database and query engine allows users to search for and sort CNVs by a variety of criteria. Results are presented in a web-based tabular format and as a set of study-wide file downloads for all CNV determinations. The CNV database can be queried for all CNVs within a selected region defined either by chromosomal coordinates or individual gene names (Fig. 1). The user can visualize all CNVs within a given interval or just focus on either the nonunique or unique CNVs. Additionally, the web browser allows further classification of the CNVs by ethnicity, size, number of SNPs within, and individual variation types, which comprises duplications and both homozygous and heterozygous deletions. Resulting CNVs can be displayed in either a tabular, graphical, or combined format (Fig. 1; Supplemental Fig. 1). Furthermore, the “Map it” link allows the visualization of a particular CNV in the context of all available annotations within the UCSC Genome Browser (http://genome.ucsc.edu), while the “Toronto DB” link accesses the corresponding CNV data in the Database of Genomic Variants (DGV) (http://projects.tcag.ca/variation) (Fig. 1; Supplemental Fig. 1). A link for “downloads” of all CNV data from a given display is available at the bottom of the web page.
Figure 1.

Copy number variation database web portal (http://cnv.chop.edu). This view shows the “combined” output of nonunique CNVs in our data set within chromosomal “position” chr1:1–2,000,000. The graphical view shows the extent and type of CNVs; (het del) heterozygous deletion; (dup) duplication. The CNVR is indicated, and the frequency graph of the CNV blocks is also shown. The tabular view lists additional information for each individual CNV, including subject ethnicity, chromosomal band (Chr), sequence start and end positions, size in base pairs, type of event, and number of SNPs within (SNPs). The interface also provides links to associated CNVRs and CNV Blocks, the Database of Genomic Variants (Toronto DB), genes within or overlapping the CNV (Genes), and the UCSC Genome Browser (Map It!).
The contemporary Database of Genomic Variants serves as a valuable repository of CNVs, with more than 21,000 CNVs from 31 studies represented currently. Overall comparison with this public variant set revealed that 73.1% of our nonunique CNVs overlapped with CNVs reported in DGV. In addition, the frequency of overlap increased as a function of population frequency: 54.9% of CNV blocks with <1% frequency overlapped with DGV CNVRs, compared to 98.8% overlap with DGV for CNV blocks with frequencies >10% (Supplemental Table 2). Conversely, only 34.4% of DGV CNVs overlapped with our nonunique CNVs. Taken together, these results indicate that the CNVs we have identified are more likely to be rare events in comparison with previously reported structural variant collections. This is consistent with the notion that platform and methodological variations may contribute significantly to these differentials.
We have also examined whether the genomic distributions of various classes of structural and functional elements were correlated with the presence or absence of CNV regions. Our results extended upon previously reported correlations and are available in the Supplemental material under “CNV analysis and annotations” and in Supplemental Tables 3–7 and Supplemental Figure 3. Ethnic-specific CNV analysis was also performed for samples of Caucasian and African ancestries, the results of which are available in the Supplemental material (Supplemental Results; Supplemental Tables 8–10; Supplemental Figs. 4–6).
Applications
Interpretation of CNVs
Differences in genome coverage, resolution, technologies, cohort characteristics, and CNV reporting metrics used in prior studies can prove challenging for successfully interpreting the biological significance of particular events. In comparing our results with previously reported CNVs, data from the latter often appeared to overstate the genomic extent of actual variation, as well as to underestimate variation among individuals. One typical illustration of these effects is represented by CNVs encompassing the putative tumor suppressor gene CSMD1 (Fig. 2). Studies from DGV collectively report 49 CNVs within this gene (mean size: 347 kb; median size: 9560 bp), including seven duplications spanning large stretches of the gene (all derived from HapMap cell lines) and an additional five CNVs predicted to disrupt one or more CSMD1 exons (12/49, 24.5%). Interpretation of these results might lead to the conclusion that genomic alterations of this gene are frequent and do not necessarily predispose to disease risk. However, while our CNV set identifies 507 CNVs within this region, the mean and median sizes are 7535 bp and 3445 bp, respectively. Moreover, only four of our CNVs (0.8%) in this region are predicted to disrupt exonic sequence, and we did not detect any of the large duplications previously reported, suggesting the possibility that these are rare variants or in vitro artifacts. We observed numerous additional genomic regions with CNV distributions similar to the CSMD1 example. Thus, our data set should facilitate further delineation of the true extent of structural variation within a given genomic region, leading to improved interpretation of the biological significance of particular events.
Figure 2.

Comparison of CNVs detected in the current cohort with DGV CNVs within the CSMD1 gene. (Top row) Chromosome 8 genomic sequence coordinates for the CSMD1 gene. (Second row) Exonic structure of the 70-exon CSMD1 gene. (Red vertical lines) Exons; (black horizontal line) the extent of the mRNA transcript. Owing to the scale of the diagram, each exon is treated as an equivalent size, and exons with short intervening sequences are drawn adjacent to each other. (Third row) CNVs within the CSMD1 gene reported in the Database of Genomic Variants. CNVs with a lighter shade of blue overlap one or more CSMD1 exons. (Bottom row) CNVs within the CSMD1 gene reported in this study. Numbers adjacent to two CNVs (designated by asterisks) indicate the number of instances in which that exact CNV is reported. CNVs with a lighter shade of purple overlap one or more CSMD1 exons.
Assessment of pathogenicity in clinical samples
A CNV data set generated from healthy controls has the potential to be very useful in clinical applications as a comparator with CNVs identified in diseased individuals. We demonstrate the clinical utility of our CNV collection using the example of a patient with multiple congenital anomalies, including global developmental delay and brain malformations. Interestingly, 32 of 35 CNVs identified in this individual were transmitted from a healthy parent or had been previously detected in healthy controls, many of them at frequencies >1% (Table 3). Of the remaining three CNVs, two included olfactory receptor genes and were relatively small in size. The third unique CNV, the second largest CNV detected (915 kb), was a deletion in 17p13 that entirely encompasses 51 genes, including several genes involved in early embryonal development. The 915-kb deletion was validated by fluorescent in situ hybridization (data not shown). Analysis of parental samples showed that while 32 of the 35 proband CNVs were found to be inherited from a parent, the 17p13 deletion was apparently de novo, providing support for the potential pathogenicity of this variant based solely on control CNV evidence.
Table 3.
Assessment of CNVs detected in a patient with multiple congenital anomalies

(OR gene) Olfactory receptor gene; (SD region) region of known segmental duplication (RefSeq gene transcript overlap was used for gene assessment); (P.T.) parental transmission. Boldface indicates the putative pathogenic CNV.
To further assess the utility of our CNV database, we examined two microdeletions recently implicated in neurological disorders. A recurrent 1.5-Mb microdeletion in 15q13.3 has been associated with a recently recognized syndrome characterized by mental retardation and seizures (Sharp et al. 2008). This microdeletion contains at least six genes, including the CHRNA7 gene that has been implicated in epilepsy (Sharp et al. 2008). An assessment of our database for CNVs in the region (chr15:28723577–30192473, hg17, NCBI build 35) yielded 36 nonunique CNVs in this region, comprising 16 deletions and 20 duplications (Fig. 3); five of these CNVs were unique (all duplications; available at http://cnv.chop.edu). Most of the control CNVs were relatively smaller, and none encompassed the entire critical region implicated in the syndrome (Fig. 3), except for one unique duplication encompassing the entire region (data not shown). The high prevalence of this 15q13.3 microdeletion in affected individuals along with its absence in healthy controls strongly supports a role for this deletion in the etiology of the patients' phenotypes. Furthermore, duplication CNVs in controls outnumbered the deletion CNVs, were larger in size, and more frequently affected coding sequences. This may suggest that gain in copy number of genes within this region may not be as detrimental as loss due to deletion.
Figure 3.

Copy number variation within 15q13.3. Nonunique CNVs detected in our control data set that map within 15q13.3 (chr15:28,700,577–30,302,218, hg17, NCBI build 35) are shown as custom tracks within the UCSC Genome Browser (http://genome.ucsc.edu/). (Red rectangles) Deletions; (blue rectangles) duplications; (green rectangle) the CNV reported by Sharp et al. (2008). The UCSC known genes and segmental duplication tracks are also shown.
In sharp contrast to the above example, CNVs seen in our database contradict the genotype–phenotype correlation made between a microdeletion in 15q11.2 and a patient with a neurological disorder and speech impairment (Murthy et al. 2007). In this report, an ∼400-kb deletion in 15q11.2 encompassing four genes was implicated in the etiology of the patient's phenotype. An assessment of our CNV set for the region (chr15:20300000–20800000, hg17, NCBI build 35) yielded 22 CNVs (both unique and nonunique), including 15 deletions and seven duplications. Interestingly, 12 out of 22 (55%) of the control CNVs encompassed the entire critical region implicated in the syndrome (Fig. 4). Although our data do not provide conclusive evidence for or against a role for this microdeletion in abnormal phenotypes, it cautions against relying strictly on assessment of disease-derived CNVs for genotype–phenotype correlations. These findings underscore the utility of our CNV data set in clinical diagnostics.
Figure 4.

Copy number variation within 15q11.2. Nonunique CNVs detected in our control data set that map within 15q11.2 (chr15:20,300,000–20,800,000, hg17, NCBI build 35) are shown as custom tracks within the UCSC Genome Browser (http://genome.ucsc.edu/). (Red rectangles) Deletions; (blue rectangles) duplications; (green rectangle) and the CNV reported by Murthy et al. (2007). The UCSC known genes and segmental duplication tracks are also shown.
Discussion
We present here a data set consisting primarily of relatively rare human genomic CNVs that were derived from 2026 healthy individuals. The generation of this resource is aimed at serving as a reference to aid in the investigation of the clinical significance of CNVs detected in disease cohorts. We believe that this will be a valuable resource to other investigators for applications in clinical diagnostics as well as in CNV enrichment and association studies for particular disease cohorts. Currently, there are several databases, including DECIPHER (https://decipher.sanger.ac.uk/) and ECARUCA (http://agserver01.azn.nl:8080/ecaruca/ecaruca.jsp), that provide cytogenetic and clinical information on disorders known to result from CNVs. We envision a pathway in which CNV data derived from clinical samples can be compared to these clinical databases, DGV, and our data set for each CNV detected. The clinical significance of CNVs detected in the sample can then be better evaluated using several criteria, including the occurrence and frequency in healthy controls, gene content, and the phenotype being studied.
Genome-wide analyses such as ours are highly dependent on the resolution and content of the discovery platform used. The platform used in our study provides lower SNP coverage in regions of known common CNVs, regions of segmental duplication, and both the X and Y chromosomes, and as such is by no means comprehensive. Interestingly, our nonunique CNV rate was much higher than those reported in previous studies (Redon et al. 2006). The higher rate of nonunique CNVs observed in our study can be attributed at least in part to our larger study cohort. The relationship between nonunique rate and sample size approaches a plateau as more samples are surveyed (Supplemental Fig. 7), suggesting that the majority of events detectable by our methods and platform are being captured. However, recent sequence-based analyses of CNVs, such as the fosmid end-sequencing study of nine HapMap individuals (Kidd et al. 2008), indicate that a large number of as-yet-undiscovered variants are present in the human genome. Thus, we conclude that although not comprehensive, our survey is identifying a substantial proportion of moderately common and rare genomic variations existing in the Caucasian and African-American populations, and a considerably larger set of variants than currently exists in DGV. This observation further highlights the utility of our CNV collection for clinical applications, as moderately recurrent and rare CNVs are more likely to cause erroneous genotype–phenotype correlations.
Furthermore, analyses such as ours are also highly dependent on computational algorithms used for detection and platform-specific experimental errors. As the large set of CNV predictions has precluded exhaustive validation, we focused validation efforts on establishing general quality guidelines for guiding users. We have used a combination of computational and experimental techniques to carefully evaluate selected CNVs. Our analyses predict low false discovery and false-negative rates, especially for nonunique CNVs, deletions, and CNVs spanning four or more SNPs. Furthermore, the fact that most of our nonunique CNVs overlapped with those reported by DGV from multiple studies suggests that they represent authentic CNVs. While we have provided access to all CNV predictions, we recommend particular caution in using the unique CNV data, particularly those that are represented by fewer than four SNPs, where independent validation using experimental methods is advised.
Our analyses largely reiterated prior associations between genomic features and CNV distributions in a larger, more uniform sample set. The presence of ethnic-specific CNV signatures is in keeping with the demonstration of greater genomic diversity among individuals of African descent from HapMap data (The International HapMap Consortium 2003, 2007; Sebat et al. 2007). Similarly, our results confirmed that CNV distributions are positively correlated with regions of segmental duplication (Redon et al. 2006). The role of segmental duplications (SDs) in generating pathogenic chromosomal rearrangements by nonallelic homologous recombination is well documented (Lupski 2007). Our findings support a proposed model wherein CNV generation is promoted by close proximity to SDs (Sharp et al. 2005; Redon et al. 2006).
As CNV determinations continue to improve in-depth resolution and inclusion, the results will empower both biological discovery and clinical application. Greater resolution will especially be important for precisely determining the extent of each CNV, the frequency with which specific genomic regions are disrupted in healthy and disease cohorts, and the biological implications of particular variants. Based on our current CNV map, it is evident that the CNVs in public collections, which are based in part on clone-based array data, may be inflated in size consistent with other recent studies (Kidd et al. 2008). This finding is highly significant especially since use of current CNV databases in clinical applications enhances the possibility of erroneously excluding disease-causing variation in patient samples. We envision that the CNV resource described here will assist investigators performing such genomic studies on medical disorders with a genomic component.
Methods
Sample population and SNP genotyping
Subjects were primarily recruited from the Philadelphia region through the Hospital's Health Care Network, including four primary care clinics and several group practices and outpatient practices that performed well child visits. Eligibility criteria for this study included all of the following: (1) disease-free children and parents of these children in the age range of 0–18 yr of age who had high quality, genome-wide genotyping data from blood samples (defined in Supplemental Methods); (2) self-reported ethnic background; and (3) no serious underlying medical disorder, including but not limited to neurodevelopmental disorders, cancer, chromosomal abnormalities, and known metabolic or genetic disorders. Genotypes from a small set of parents of the participating children were used to assess CNV heritability patterns. All subjects and/or their parents signed an informed consent permitting the use of their genotypes and healthcare records for the study. Ancestry informative markers (AIMs) available on the HumanHap550 BeadChip (Yang et al. 2005) were used to evaluate eligible subjects to determine ethnicity. Where the AIMs markers contradicted self-reported ethnicity, the AIMs marker status was used in the analysis. The cohort comprised 1320 Caucasians, 694 African-Americans, and 12 Asian-Americans. This cohort contained 80 complete mother–father–child trios. Furthermore, there were 325 mother–child, 140 father–child, 59 sibling, and 10 twin relationships confirmed by genotype concordance. The remaining 1492 samples shared no relatedness with other samples in this data set.
Samples were assayed on the Illumina Infinium II HumanHap550 BeadChip (Gunderson et al. 2005; Steemers et al. 2006) (Illumina), as previously described in our laboratory (Hakonarson et al. 2007). A total of 2026 individuals passed all quality control (QC) measures, which included >98% SNP call rate and LRR standard deviation <0.35, and qualified for the study. The version of Illumina Infinium BeadChip is consistent for all samples in this study. The standard Illumina cluster file was used for the analysis, which is generated at Illumina by running 120 HapMap samples, running the BeadStudio clustering algorithm, and reviewing SNPs with poor performance statistics, including call frequency, cluster separation, and Hardy-Weinberg equilibrium. We reviewed this clustering in reference to our typed samples to robustly establish a reference normal diploid state for each SNP. This optimization was essential to establish the true baseline from which theta (ratio of green color corresponding to genotype) and R (intensity) are calculated into B allele frequency (BAF) and Log R ratio values (LRRs). We reviewed the raw theta and R-values of each SNP in called CNV regions to ensure proper clustering of normal samples and deviation of samples with a CNV call across the region. Spurious single SNP-driven signals were rejected.
CNV detection and initial analysis
The Illumina BeadStudio 3.0 software package was used for initial CNV detection analysis. LRRs and BAFs were first exported from BeadStudio. LRR values were used as an additional sample-wide genotype quality control measure, and LRRs with a standard deviation above 0.35 were excluded from the study. In our experience, Log R ratio standard deviation provides a robust quality metric; as demonstrated in Supplemental Figure 8, samples with LRR SDs <0.35 have similar numbers of CNVs detected with our method. Furthermore, samples with LRR SDs >0.35 had significantly higher numbers of detected CNVs, a majority of which are expected to be false-positives resulting from background.
CNV detections were then performed for the remaining genotypes using a customized analysis workflow. Briefly, chromosomes were segmented based on LRRs using the Circular Binary Segmentation algorithm implemented in the R statistical package module DNAcopy 1.7. Default parameters were used (i.e., nperm = 10,000; alpha = 0.01; kmax = 25; nmin = 200; eta = 0.05; overlap = 0.25; trim = 0.025; undo.splits = “none”). Segments were then filtered based on their average LRRs and additional devised BAF statistics:
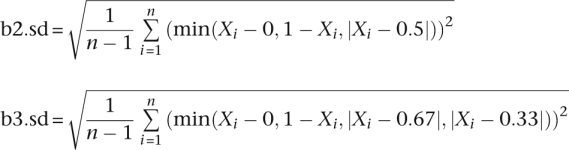 |
The b2.sd and b3.sd for each segment were used to measure whether the BAF pattern of a segment fits the two-copy mode better than a three-copy mode, or vice versa. The paucity of AB alleles in the segment was used to filter for deletions. For autosomal chromosomes, the thresholds used are listed in Table 4.
Table 4.
Thresholds used for autosomal chromosomes

Different LRR cutoffs were used for the X chromosome. For males, X chromosome thresholds of −2 and 0.1 were used for hemizygous deletions and duplications, respectively. For females, X chromosome thresholds of −1.5, −0.1, and 0.6 were used for homozygous deletions, heterozygous deletions, and duplications, respectively. Female X duplications and homozygous deletions were also required to have b2.sd ≥ b3.sd. The percentage of SNPs with BAFs between 0.6 and 0.4 in the segment ≤4% was a requirement for calling the segment a heterozygous deletion for females as well.
CNV validation
CNV validation was conducted by a combination of experimental methods (experimental details are available in Supplemental Methods). Briefly, cross-platform validation was performed on 112 HapMap samples to provide an unbiased assessment of the accuracy and robustness of our computational methods. Illumina HumanHap550K genotypes of these HapMap samples were obtained from Illumina and analyzed with our computational methods. Affymetrix 6.0 genotyping data sets from these same HapMap samples were obtained from Affymetrix and analyzed for CNVs using a commercial software package (Partek Genomics Suite; Partek Incorporated; Supplemental Table 11). Quantitative PCR was used to validate a representative sample of nonunique CNVs containing fewer than 10 SNPs (Supplemental Table 12). Finally, CNV calls made by our method were compared to those from a HapMap individual (NA12878) that was analyzed by fosmid end-sequence pairs in a recently published study by Kidd and colleagues (2008).
Data availability and access
The CNV data reported here are available at http://cnv.chop.edu. These data are also available in the Database of Genomic Variants (DGV). The individual level intensity data from the Illumina arrays will be available in dbGaP under accession phs000199.v1.p1.
Acknowledgments
This work was supported in part by NIH grant GM081519 (to T.H.S), Pennsylvania Department of Health grant SAP 4100037707 (to P.S.W.), a Developmental Research Award from the Cotswold Foundation (to H.H. and S.F.G), funds from the David Lawrence Altschuler Chair in Genomics and Computational Biology (to P.S.W.), and Institutional Awards to the Center for Applied Genomics (to H.H.) and the Center for Biomedical Informatics (to P.S.W.) from the Children's Hospital of Philadelphia. We thank all participating subjects and families for making this study possible. Alexandre Belisle, Alejandrina Estevez, Kenya Fain, Rosalie Frechette, Alexandria Thomas, and LaShea Williams provided expert assistance with data collection and management. We also acknowledge Allen Ladd and Peter Witzleb of CHOP and Smari Kristinsson, Larus Arni Hermannsson, and Asbjörn Krisbjörnsson of Raförninn ehf for informatics support. The Children's Hospital of Philadelphia Institutional Review Board has approved this study.
Footnotes
[Supplemental material is available online at http://www.genome.org. The CNV data reported here are available at http://cnv.chop.edu. These data are also available in the Database of Genomic Variants (DGV) (http://projects.tcag.ca/variation). The individual level intensity data from the Illumina arrays are available in dbGaP (http://www.ncbi.nlm.nih.gov/dbgap) under accession phs000199.v1.p1.]
Article published online before print. Article and publication date are at http://www.genome.org/cgi/doi/10.1101/gr.083501.108.
References
- Albertson DG, Pinkel D. Genomic microarrays in human genetic disease and cancer. Hum. Mol. Genet. 2003;12:R145–R152. doi: 10.1093/hmg/ddg261. [DOI] [PubMed] [Google Scholar]
- Conrad DF, Andrews TD, Carter NP, Hurles ME, Pritchard JK. A high-resolution survey of deletion polymorphism in the human genome. Nat Genet. 2006;38:75–81. doi: 10.1038/ng1697. [DOI] [PubMed] [Google Scholar]
- Elia J, Gai X, Xie HM, Perin JC, Geiger E, Glessner JT, D'arcy M, deBerardinis R, Frackelton E, Kim C, et al. Rare structural variants found in attention-deficit hyperactivity disorder are preferentially associated with neurodevelopmental genes. Mol Psychiatry. 2009;14:doi: 10.1038/mp.2009.57. doi: 10.1038/mp.2009.57. [DOI] [PMC free article] [PubMed] [Google Scholar]
- Feuk L, Carson AR, Scherer SW. Structural variation in the human genome. Nat Rev Genet. 2006;7:85–97. doi: 10.1038/nrg1767. [DOI] [PubMed] [Google Scholar]
- Freeman JL, Perry GH, Feuk L, Redon R, McCarroll SA, Altshuler DM, Aburatani H, Jones KW, Tyler-Smith C, Hurles ME, et al. Copy number variation: New insights in genome diversity. Genome Res. 2006;16:949–961. doi: 10.1101/gr.3677206. [DOI] [PubMed] [Google Scholar]
- Gunderson KL, Steemers FJ, Lee G, Mendoza LG, Chee MS. A genome-wide scalable SNP genotyping assay using microarray technology. Nat Genet. 2005;37:549–554. doi: 10.1038/ng1547. [DOI] [PubMed] [Google Scholar]
- Hakonarson H, Grant SF, Bradfield JP, Marchand L, Kim CE, Glessner JT, Grabs R, Casalunovo T, Taback SP, Frackelton EC, et al. A genome-wide association study identifies KIAA0350 as a type 1 diabetes gene. Nature. 2007;448:591–594. doi: 10.1038/nature06010. [DOI] [PubMed] [Google Scholar]
- Hinds DA, Kloek AP, Jen M, Chen X, Frazer KA. Common deletions and SNPs are in linkage disequilibrium in the human genome. Nat Genet. 2006;38:82–85. doi: 10.1038/ng1695. [DOI] [PubMed] [Google Scholar]
- Iafrate AJ, Feuk L, Rivera MN, Listewnik ML, Donahoe PK, Qi Y, Scherer SW, Lee C. Detection of large-scale variation in the human genome. Nat Genet. 2004;36:949–951. doi: 10.1038/ng1416. [DOI] [PubMed] [Google Scholar]
- The International HapMap Consortium. The International HapMap Project. Nature. 2003;426:789–796. doi: 10.1038/nature02168. [DOI] [PubMed] [Google Scholar]
- The International HapMap Consortium. A second generation human haplotype map of over 3.1 million SNPs. Nature. 2007;449:851–861. doi: 10.1038/nature06258. [DOI] [PMC free article] [PubMed] [Google Scholar]
- International Schizophrenia Consortium. Rare chromosomal deletions and duplications increase risk of schizophrenia. Nature. 2008;455:237–241. doi: 10.1038/nature07239. [DOI] [PMC free article] [PubMed] [Google Scholar]
- Kidd JM, Cooper GM, Donahue WF, Hayden HS, Sampas N, Graves T, Hansen N, Teague B, Alkan C, Antonacci F, et al. Mapping and sequencing of structural variation from eight human genomes. Nature. 2008;453:56–64. doi: 10.1038/nature06862. [DOI] [PMC free article] [PubMed] [Google Scholar]
- Lupski JR. Genomic rearrangements and sporadic disease. Nat Genet. 2007;39:S43–S47. doi: 10.1038/ng2084. [DOI] [PubMed] [Google Scholar]
- Lupski JR, Stankiewicz P. Genomic disorders: Molecular mechanisms for rearrangements and conveyed phenotypes. PLoS Genet. 2005;1:e49. doi: 10.1371/journal.pgen.0010049. [DOI] [PMC free article] [PubMed] [Google Scholar]
- McCarroll SA, Hadnott TN, Perry GH, Sabeti PC, Zody MC, Barrett JC, Dallaire S, Gabriel SB, Lee C, Daly MJ, The International HapMap Consortium et al. Common deletion polymorphisms in the human genome. Nat Genet. 2006;38:86–92. doi: 10.1038/ng1696. [DOI] [PubMed] [Google Scholar]
- Murthy SK, Nguyen AOH, El Shakankiry HM, Schouten JP, Al Khayat AI, Ridha A, Al Ali MT. Detection of a novel familial deletion of four genes between BP1 and BP2 of the Prader-Willi/Angelman syndrome critical region by oligo-array CGH in a child with neurological disorder and speech impairment. Cytogenet Genome Res. 2007;116:135–140. doi: 10.1159/000097433. [DOI] [PubMed] [Google Scholar]
- Perry GH, Ben-Dor A, Tsalenko A, Sampas N, Rodriguez-Revenga L, Tran CW, Scheffer A, Steinfeld I, Tsang P, Yamada NA, et al. The fine-scale and complex architecture of human copy-number variation. Am J Hum Genet. 2008;82:685–695. doi: 10.1016/j.ajhg.2007.12.010. [DOI] [PMC free article] [PubMed] [Google Scholar]
- Redon R, Ishikawa S, Fitch KR, Feuk L, Perry GH, Andrews TD, Fiegler H, Shapero MH, Carson AR, Chen W, et al. Global variation in copy number in the human genome. Nature. 2006;444:444–454. doi: 10.1038/nature05329. [DOI] [PMC free article] [PubMed] [Google Scholar]
- Sebat J, Lakshmi B, Troge J, Alexander J, Young J, Lundin P, Månér S, Massa H, Walker M, Chi M, et al. Large-scale copy number polymorphism in the human genome. Science. 2004;305:525–528. doi: 10.1126/science.1098918. [DOI] [PubMed] [Google Scholar]
- Sebat J, Lakshmi B, Malhotra D, Troge J, Lese-Martin C, Walsh T, Yamrom B, Yoon S, Krasnitz A, Kendall J, et al. Strong association of de novo copy number mutations with autism. Science. 2007;316:445–449. doi: 10.1126/science.1138659. [DOI] [PMC free article] [PubMed] [Google Scholar]
- Sharp AJ, Locke DP, McGrath SD, Cheng Z, Bailey JA, Vallente RU, Pertz LM, Clark RA, Schwartz S, Segraves R, et al. Segmental duplications and copy-number variation in the human genome. Am J Hum Genet. 2005;77:78–88. doi: 10.1086/431652. [DOI] [PMC free article] [PubMed] [Google Scholar]
- Sharp AJ, Mefford HC, Li K, Baker C, Skinner C, Stevenson RE, Schroer RJ, Novara F, De Gregori M, Ciccone R, et al. A recurrent 15q13.3 microdeletion syndrome associated with mental retardation and seizures. Nat Genet. 2008;40:322–328. doi: 10.1038/ng.93. [DOI] [PMC free article] [PubMed] [Google Scholar]
- Steemers FJ, Chang W, Lee G, Barker DL, Shen R, Gunderson KL. Whole-genome genotyping with the single-base extension assay. Nat Methods. 2006;3:31–33. doi: 10.1038/nmeth842. [DOI] [PubMed] [Google Scholar]
- Stefansson H, Rujescu D, Cichon S, Pietilainen OP, Ingason A, Steinberg S, Fossdal R, Sigurdsson E, Sigmundsson T, Buizer-Voskamp JE, et al. Large recurrent microdeletions associated with schizophrenia. Nature. 2008;455:232–236. doi: 10.1038/nature07229. [DOI] [PMC free article] [PubMed] [Google Scholar]
- Walsh T, McClellan JM, McCarthy SE, Addington AM, Pierce SB, Cooper GM, Nord AS, Kusenda M, Malhotra D, Bhandari A, et al. Rare structural variants disrupt multiple genes in neurodevelopmental pathways in schizophrenia. Science. 2008;320:539–543. doi: 10.1126/science.1155174. [DOI] [PubMed] [Google Scholar]
- Wong KK, deLeeuw RJ, Dosanjh NS, Kimm LR, Cheng Z, Horsman DE, MacAulay C, Ng RT, Brown CJ, Eichler EE, et al. A comprehensive analysis of common copy-number variations in the human genome. Am J Hum Genet. 2007;80:91–104. doi: 10.1086/510560. [DOI] [PMC free article] [PubMed] [Google Scholar]
- Yang N, Li H, Criswell LA, Gregersen PK, Alarcon-Riquelme ME, Kittles R, Shigeta R, Silva G, Patel PI, Belmont JW, et al. Examination of ancestry and ethnic affiliation using highly informative diallelic DNA markers: Application to diverse and admixed populations and implications for clinical epidemiology and forensic medicine. Hum Genet. 2005;118:382–392. doi: 10.1007/s00439-005-0012-1. [DOI] [PubMed] [Google Scholar]
- Xu B, Roos JL, Levy S, van Rensburg EJ, Gogos JA, Karayiorgou M. Strong association of de novo copy number mutations with sporadic schizophrenia. Nat Genet. 2008;40:880–885. doi: 10.1038/ng.162. [DOI] [PubMed] [Google Scholar]
Associated Data
This section collects any data citations, data availability statements, or supplementary materials included in this article.
Data Availability Statement
The CNV data reported here are available at http://cnv.chop.edu. These data are also available in the Database of Genomic Variants (DGV). The individual level intensity data from the Illumina arrays will be available in dbGaP under accession phs000199.v1.p1.