Abstract
DNA methylation stabilizes developmentally programmed gene expression states. Aberrant methylation is associated with disease progression and is a common feature of cancer genomes. Presently, few methods enable quantitative, large-scale, single-base resolution mapping of DNA methylation states in desired regions of a complex mammalian genome. Here, we present an approach that combines array-based hybrid selection and massively parallel bisulfite sequencing to profile DNA methylation in genomic regions spanning hundreds of thousands of bases. This single molecule strategy enables methylation variable positions to be quantitatively examined with high sampling precision. Using bisulfite capture, we assessed methylation patterns across 324 randomly selected CpG islands (CGI) representing more than 25,000 CpG sites. A single lane of Illumina sequencing permitted methylation states to be definitively called for >90% of target sties. The accuracy of the hybrid-selection approach was verified using conventional bisulfite capillary sequencing of cloned PCR products amplified from a subset of the selected regions. This confirmed that even partially methylated states could be successfully called. A comparison of human primary and cancer cells revealed multiple differentially methylated regions. More than 25% of islands showed complex methylation patterns either with partial methylation states defining the entire CGI or with contrasting methylation states appearing in specific regional blocks within the island. We observed that transitions in methylation state often correlate with genomic landmarks, including transcriptional start sites and intron-exon junctions. Methylation, along with specific histone marks, was enriched in exonic regions, suggesting that chromatin states can foreshadow the content of mature mRNAs.
It has long been known that changes in cellular and organismal characteristics can be inherited without accompanying alterations in genomic sequence (Waddington 1942). This phenomenon, known as epigenetic inheritance, has been proposed to occur through a number of mechanisms, including histone modification and DNA methylation (Holliday and Pugh 1975).
In mammals, DNA methylation is observed mainly at CpG dinucleotides. This modification is propagated via a maintenance methyltransferase, DNMT1 (Bestor et al. 1988), which preferentially recognizes and modifies hemi-methylated CpGs (Bestor 1992). While the vast majority of CpGs are methylated in differentiated mammalian cells (Bird and Taggart 1980), most methylation undergoes waves of erasure and reestablishment during gametogenesis and preimplantation development (Monk et al. 1987; Sanford et al. 1987; Chaillet et al. 1991). The reestablishment of methylation is carried out by de novo methyltransferases, DNMT3A and DNMT3B (Okano et al. 1998).
Although CpG dinucleotides are significantly underrepresented in mammalian genomes, certain regions are relatively rich in CpGs, called CpG islands (CGIs) (Bird 1986). While CGIs are found throughout the genome, they are often associated with promoter regions, with >70% of annotated genes having CGI-related promoters (Saxonov et al. 2006). Hypermethylation of promoters is correlated with heterochromatin formation and silenced transcription (Keshet et al. 1986).
Studies of Dnmt1- and Dnmt3-mutant mice indicate an essential role for methylation in normal development (Li et al. 1992; Okano et al. 1999). Current models suggest that the regulated and mitotically inherited methylation of specific genomic regions, through the developmental history of a cell, functions to restrict potency and guide cell fate (Reik 2007; Shen et al. 2007). Aberrant DNA methylation is associated with disease development and progression.
Despite its importance, mechanisms that guide DNA methylation and the biological impact of global modification patterns remain poorly understood, due in part to the limitations of current methylation profiling technologies. Current profiling methods can be classified roughly into two categories: those that measure methylation at high nucleotide resolution for a modest number of genomic intervals and those capable of surveying the whole genome at low to moderate resolution.
Existing genome-wide approaches typically involve comparative microarray hybridization following fractionation of the genome based upon methyl-cytosine specific antibodies/protein complexes (MeDIP, MIRA) or methylation responsive enzymes (e.g., MspI/HpaI or McrBc) with sites in CpG-rich regions (Lippman et al. 2004; Weber et al. 2005; Khulan et al. 2006; Shen et al. 2007; Rauch et al. 2009). The sensitivity of the enzymatic approach is limited by the sequence context of the digestion site and by the number of sites available. Moreover, microarray-based approaches produce an average snapshot of methylation across genomic windows. As a result, resolution of methylation states at individual sites is generally imprecise and can be strongly influenced by CpG density and fragment size (Irizarry et al. 2008). This drawback hampers the use of such methods for the analysis of imprinted loci and regions with complex methylation patterns.
High-resolution strategies can distinguish methylation states in a semi-quantitative, allele-specific manner at individual CpGs within a defined region. Established protocols that positively identify 5-methylcytosine residues in single strands of genomic DNA exploit the sodium bisulfite-induced deamination of cytosine to uracil. Under denaturing conditions, only methylated cytosines are protected from conversion. To measure methylation levels, bisulfite conversion has been combined with restriction analysis (COBRA) (Xiong and Laird 1997), base-specific cleavage and mass spectrometry (Ehrich et al. 2005, 2008), real-time PCR (MethyLight) (Eads et al. 2000), and pyrosequencing (Dupont et al. 2004). However, these methods are generally limited by their scalability and cost.
Bisulfite sequencing represents the most comprehensive, high-resolution method for determining DNA methylation states. Like SNP detection, the accurate quantification of variable methylation frequencies requires high sampling of individual molecules. High-throughput, single-molecule sequencing instruments have facilitated the genome-wide application of this approach. For example, direct shotgun bisulfite sequencing provided adequate coverage depth and proved cost-effective for a small genome like Arabidopsis (119 Mbp) (Cokus et al. 2008). However, these approaches are currently impractical for routine application in complex mammalian genomes, and simplification of DNA fragment populations (genome partitioning) is still required to boost sampling depth of individual CpG sites (Taylor et al. 2007; Meissner et al. 2008). This problem becomes compounded as one considers that, within a multicellular organism, there are probably at least as many epigenomic states as there are cell types. Therefore, to understand the impact of epigenetic variation will require both detailed reference maps and the ability to interrogate regions of those reference maps in many samples and cell types at high resolution. Recent strategies for addressing methylation in large genomes have included enzyme directed reduced genomic representation (Meissner et al. 2008; Brunner et al. 2009) and padlock probe assisted multiplex amplification (Ball et al. 2009; Deng et al. 2009) followed by massively parallel sequencing.
To this end, we have developed bisulfite capture, a technology platform that combines bisulfite conversion with hybrid selection techniques and deep sequencing. Our profiling method is capable of achieving single nucleotide resolution while simultaneously examining methylation frequencies in tens of thousands of CpGs. Bisulfite capture directs focus to specified CpG regions in a highly parallelized process designed to selectively enhance sequence information content by deeper sampling of targeted bases. Unlike other reduced representation schemes, the selection process is independent of methylation status and the substrate may be tailored to include any non-repeat genomic interval. Here, we describe the application of this approach to determine DNA methylation frequencies in CGIs sampled from a variety of genomic settings including promoters, exons, introns, and intergenic loci. To discern the sensitivity of our approach to detect differential methylation patterns, bisulfite capture was carried out on two model cell lines, a primary skin cell line and a breast cancer cell line. For our study, 324 randomly selected CpG islands encompassing nearly 300 kb of genomic space and 25,000 CpG sites were examined in parallel. While global comparison of the two cell lines recapitulates previously described trends, detailed analysis reveals many examples of unexpected complexity in methylation states and instances where sharp transitions from methylated to unmethylated intervals could be finely mapped. Our results demonstrate the capacity of the bisulfite capture system to detect site-specific switches in methylation on a readily scalable, cost effective platform.
Results
Experimental design
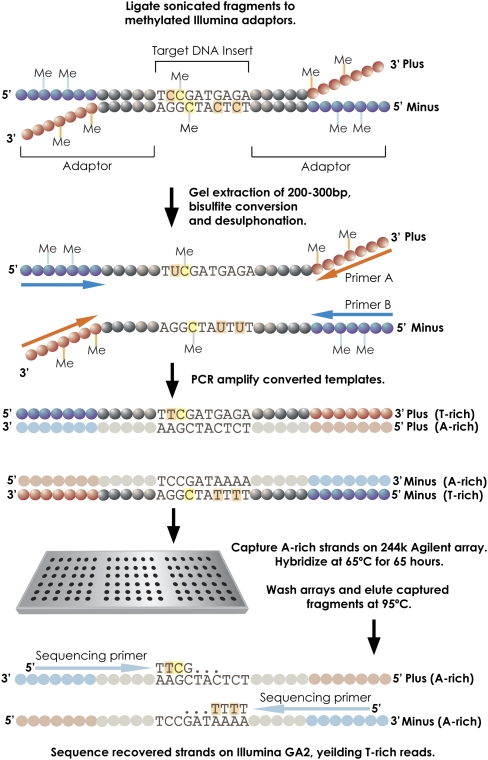
Recently, others and we have described the use of custom microarrays as substrates for hybrid selection of high interest regions from complex genomes (Albert et al. 2007; Hodges et al. 2007; Okou et al. 2007). This massively parallel focused resequencing method permits identification of sequence variants within selected genomic intervals spanning thousands to millions of bases. Here, we sought to adapt the same approach for the determination of DNA methylation states. To accomplish this, we integrated bisulfite conversion of genomic DNA into our capture scheme (Fig. 1).
Figure 1.
Bisulfite capture procedure. Genomic DNA was randomly fragmented according to the standard Illumina protocol and ligated to custom-synthesized adaptors in which each C was replaced by 5-meC. The ligation was size-fractionated to select material from 150–300 bases in length. The gel-eluted material was treated with sodium bisulfite (see Methods) and then PCR-enriched using Illumina paired-end PCR primers. The resulting products were hybridized to custom-synthesized Agilent 244K arrays containing probes complementary to the A-rich strands. Hybridizations were carried out with Agilent array CGH buffers under standard conditions. After washing, captured fragments were eluted in water at 95°C and amplified again prior to quantification and sequencing on the Illumina GA2 platform.
There are, in principle, several ways in which bisulfite conversion could be coupled with hybrid selection. One logical option would be to capture relevant regions of native genomic DNA followed by sodium bisulfite treatment and sequencing. However, this strategy has a major shortcoming in that the hybrid selection step requires large amounts of native, unamplified DNA to be readily available as input (Albert et al. 2007; Hodges et al. 2007; Okou et al. 2007). Substantial amounts of DNA can also be lost during the harsh process of bisulfite conversion. Because very small amounts of material are generally eluted from the capture arrays, bisulfite conversion post-capture could restrict the number of individually sampled molecules for each variable methylation site. Moreover, for many applications, we desired a method suitable for the analysis of relatively small cell numbers, such as tissue stem cells, or microdissected or laser-captured tumor cells. For these reasons, we developed a platform that permits the use of minimal amounts of starting material, subjecting these samples to bisulfite conversion and amplification prior to hybridization.
We tested our approach using DNA from normal, dermal fibroblast cells (CHP-SKN-1) commonly used as a reference in our array CGH studies (Sebat et al. 2004; Hicks et al. 2006) and the invasive breast tumor cell line, MDA-MB-231 (ATCC no. HTB-26). To prepare samples for sequencing on the Illumina GA2, genomic DNA libraries were generated as previously described with a few important modifications (Fig. 1). First, DNA fragments were ligated to Illumina-compatible adaptors synthesized with 5′-methyl-cytosine instead of cytosine to prevent their conversion by bisulfite treatment. A similar strategy was applied previously for shotgun bisulfite sequencing of the Arabidopsis genome (Cokus et al. 2008). Second, following size selection and gel purification, the fragments were denatured and bisulfite converted, so that the status of each CpG site became fixed in the sample. Last, the adaptor-ligated fragments were PCR-enriched with a polymerase capable of amplifying uracil-rich templates. The amplification process produces ample amounts of input material for hybridization. Ultimately, the library preparation procedure generates four strands (Fig. 1). Two are derived from the original plus and minus strands of the genome. Since these were treated with bisulfite, they are depleted of C, and are designated the T-rich strands. The complements of the converted genomic strands are designated the A-rich strands.
Array design
There are ∼28,000 annotated CGIs in the human genome. CGIs are defined herein as intervals of >200 bp with >50% GC content and significant CpG density (Gardiner-Garden and Frommer 1987). As CGIs are potentially relevant targets for DNA methylation, we randomly selected 324 islands between 300 and 2000 bp representing 258,895 bases of genomic space and 25,000 CpG sites (∼0.1% of all CpG sites in the genome). The set was distributed among all autosomes and chromosome X, including 170 islands located within 1500 bp upstream of annotated protein coding genes and 154 islands outside of annotated promoter regions, both intra- and intergenic.
Bisulfite conversion creates a layer of variability between the reference genome and converted template. Therefore, our strategy required an array design that anticipated the range of possible changes to DNA sequence resulting from cytosine depletion. Standard 60-nucleotide (nt) array capture probes are typically designed for one strand of the genomic template (Hodges et al. 2007). However, bisulfite conversion and amplification result in four strands comprising two unique double-stranded templates. In principle, it is possible to capture any of the four converted single strands. For symmetric CpG methylation, capture of one of the four products should allow inference of a complete methylation map. However, there have been reports of asymmetric (non-CpG) methylation in some mammalian cell types (Haines et al. 2001). Although not the focus of this study, detecting such modifications would simply require separate analysis of products of both genomic strands. Additionally, capturing more than one strand increases coverage and thus confidence in determining methylation states, but the trade-off is a reduction in the total genomic area that could be tiled on an array of a given capacity. As a compromise, we chose to capture two strands, the A-rich derivatives of both plus and minus genomic strands (Fig. 1); however, depending upon the biological question, capture of one strand would certainly be sufficient.
For each CpG island, two sets of capture probes were designed: one that assumed full methylation of all CpG residues and one that assumed full conversion of CpGs to TpGs. Thus, even with a completely random pattern of CpG methylation, only half of the CpG sites within a given probe would contribute a mismatch. Previous studies have quantified the effect of mismatches on hybridization to 60-nt probes printed on Agilent custom arrays (Hughes et al. 2001), the same selection substrate that we now use in our capture studies (Hodges et al. 2009). These reports suggest that up to six distributed mismatches are tolerated without a substantial impact on hybridization efficiency. Our previous studies also indicated that the presence of SNPs did not impact the efficiency of capture (Hodges et al. 2007). Therefore, we were confident that efficient hybridization could be achieved despite uncertainty in the exact sequence of the A-rich target strands. The mean number of CpGs within probe sequences to the 324 selected CpG islands is 4.68, and the maximum in any probe is 15. Thus, the vast majority of probes are well within the predicted margin of safety for efficient capture (Supplemental Fig. S1). The designed 60-nt selection probes were tiled every six bases across our contiguous target intervals and synthesized on Agilent 244k arrays.
Mapping bisulfite-treated reads
Mapping short sequenced reads requires identifying the genomic locations at which the reference sequence most closely matches that of the read. A small number of mismatches are typically allowed, and when the best match for a given read occurs at two distinct locations, that read is said to map ambiguously. We infer methylation states only from reads with unambiguous mappings. Bisulfite sequence conversion presents a significant challenge to mapping short reads because the inherent information content of converted DNA is reduced. Since we capture the A-rich strand, and sequence its complement, a T observed in a read may map to a T or a C in the reference genome.
We developed an algorithm for rapidly mapping bisulfite-treated reads while accounting for both the C-to-T conversion at unmethylated cytosines and for the retention of C when a residue is either protected from conversion or unconverted by chance. Our algorithm is based on RMAP (Smith et al. 2008) and follows the conventional strategy used in approximate matching. First, we used an “exclusion” stage, requiring candidate mapping locations to have an exact match to the read in a specific subset of positions (“seed” positions). Because the exclusion stage used exact matching, it assumed all Cs in both read and genome sequences have been converted to T. This assumption resulted in a substantial loss of efficiency to the exclusion, and we compensated for this loss by designing tiled seeds. This had the effect of the multiple filtration strategy of Pevzner and Waterman (1995) but permitted a highly efficient implementation. In contrast with mapping methods that preprocess the genome, this strategy required relatively little memory and was therefore appropriate for use on nodes of scientific clusters commonly used for analysis of sequencing data.
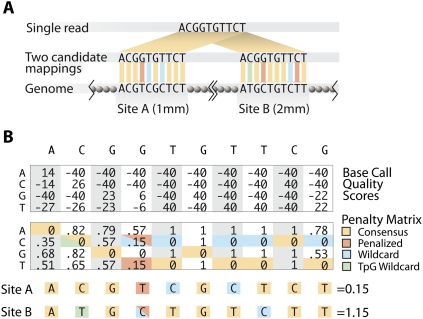
The algorithm was also designed to take advantage of sequencing quality scores by assigning fractional mismatch penalties based upon the certainty of a base call and by taking into account the fact that a large fraction of Cs are converted to Ts (Fig. 2B). For example, in the comparison of site A versus site B in Figure 2, a clear high quality call of G, C, or A resulted in a strong penalty for any mismatch. A less high quality call of G, C, or A provided an intermediate penalty whose quantitative weight was a function of the individual probabilities of each alternative call (e.g., Fig. 2B, site B, position 2). Since we were sequencing bisulfite-converted DNA, potential T calls had a nearly equal probability of originating from a genomic T or C. Thus, for cases in which there was a higher probability of a T call than a C call, the lower mismatch penalty for T was also assigned to C (e.g., Fig. 2B, site B, position 4). A detailed description of the algorithm, along with a discussion of how to exploit unconverted cytosines without introducing bias, is given in Supplemental Information.
Figure 2.
Mapping bisulfite treated reads. (A) Reads were mapped to the reference genome by minimizing the number of potential mismatches. Any T in a read incurred no penalty for aligning with a C in the genome, and any C in a read was penalized for aligning with a T in the genome. (B) Quality scores were converted to mismatch penalties by assigning a penalty of 0 to the consensus base, and penalizing non-consensus bases proportionately to the difference between their quality score and the consensus base score. A difference of 80 (representing the maximum possible range at a single position) was equated with a penalty of 1.
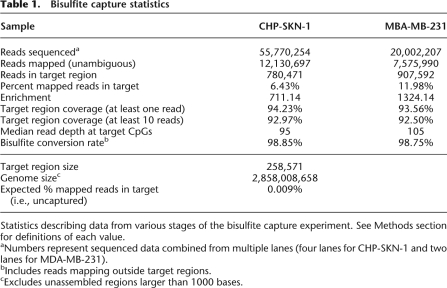
Following bisulfite capture, deep sequencing of the CGI-enriched material generated 20,002,407 raw 36 base reads for MDA-MB-231 and 55,770,254 for CHP-SKN-1 cells (Table 1). Using our mapping algorithm, unique genomic locations were assigned to 7,575,990 and 12,130,697 reads for tumor and normal cells, respectively. We used stringent criteria in mapping, permitting the equivalent, in terms of quality scores, of at most one mismatch per 36-base read. A standard sequencing run on unconverted DNA generally yields 50%–60% uniquely mappable reads. In this case, the unsuccessful assignment of more than half of the reads can be attributed to a combination of highly stringent mapping criteria with reduced sequence complexity following bisulfite conversion and poor read quality in some Illumina runs. Overall, 6.43% to 11.98% of the reads mapped unambiguously within the targeted CpG islands, corresponding to a substantial enrichment of up to 1324-fold for the selected regions from total genomic DNA (Table 1).
Table 1.
Bisulfite capture statistics
Statistics describing data from various stages of the bisulfite capture experiment. See Methods section for definitions of each value.
aNumbers represent sequenced data combined from multiple lanes (four lanes for CHP-SKN-1 and two lanes for MDA-MB-231).
bIncludes reads mapping outside target regions.
cExcludes unassembled regions larger than 1000 bases.
Methylation status of individual CpGs
An important indication of success for bisulfite capture was that sufficient coverage of the targeted bases was achieved with minimal amounts of sequencing. Using a single Illumina flow cell lane to sequence captured material, 86%–91% of the targeted nucleotides were covered by at least 10 reads for each cell line. This is sufficient depth for a confident measure of methylation frequency (see below). It should be noted, however, that both coverage and enrichment rates likely underestimate the performance of the approach, since certain reads from within the target areas cannot be uniquely mapped. For an estimate of the extent of such “dead zones” and their relationship to read length, see Supplemental Table 1.
Variations in coverage depth, the relatively high rate of sequencing error, and the fact that individual cytosine residues can be both methylated and unmethylated within a given population of cells necessitated rigorous statistical methods for calling methylation status. We started with two values: the fraction of unconverted cytosines mapping over a CpG and the total number of reads mapping over the CpG. For these studies, we focused on symmetric CpG methylation and therefore collapsed information obtained from both genomic strands. All reads having anything other than a C or T at a given CpG were excluded from analysis. Thus, the “methylated proportion” was defined as the number of reads with a C at a given CpG divided by the number of informative reads. We calculated confidence intervals for the methylated proportion according to Wilson (1927) and used these in conjunction with the methylated proportion to call methylation status. Our method assigned methylation states of unmethylated, methylated, partially methylated, or “no call” (to indicate insufficient information). See Methods and Supplemental Figure S2 for details.
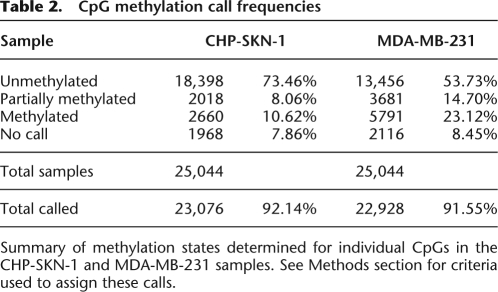
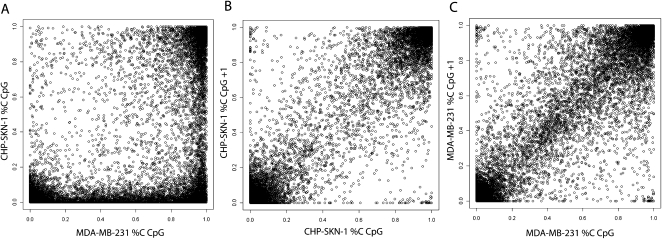
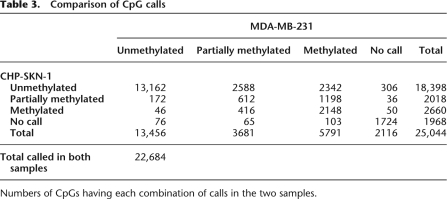
This strategy resulted in confident calls for the vast majority of CpGs in the islands we examined. The increased sequencing depth that is accruing from regular software and hardware upgrades to next-gen sequencers will lead to an increase in the number of confidently called CpGs. Of the 25,044 CpG dinucleotides investigated in this analysis, 91.6% in MDA-MB-231 and 92.1% in CHP-SKN-1 could be given a confident call, either methylated, unmethylated, or partially methylated, using the stringent criteria outlined above (Table 2). In both samples, a majority of CpG sites was called either methylated or unmethylated, with only 7% and 12% classified as partially methylated in the normal and tumor cells, respectively. A comparison of methylation frequencies between the two samples showed that the state of many CpG sites closely corresponded in both cell types (Fig. 3A). Of the discordant calls, a higher number were either fully or partially methylated in the tumor sample (Table 3; Fig. 3A). It is notable that, among the 22,684 CpGs receiving a confident call in both samples, only 0.2% were called methylated in the normal cell line and unmethylated in the tumor cell line, while 10.3% were unmethylated in CHP-SKN-1 and methylated in MDA-MB-231. When the methylation calling method was applied to non-CpG cytosines, none were identified as methylated in CHP-SKN-1 and two of the nearly 250,000 interrogated were called as methylated in MDA-MB-231.
Table 2.
CpG methylation call frequencies
Summary of methylation states determined for individual CpGs in the CHP-SKN-1 and MDA-MB-231 samples. See Methods section for criteria used to assign these calls.
Figure 3.
Distribution of CpG methylation frequencies. (A) A pairwise comparison of methylation at individual CpG sites between the two samples is shown. (B,C) For each sample, scatter plots of the proportion methylated for each CpG (x-axis) and the subsequent neighboring CpG within an island (y-axis, CpG+1) is displayed. This analysis was restricted to those CpGs with at least 40 reads in both samples.
Table 3.
Comparison of CpG calls
Numbers of CpGs having each combination of calls in the two samples.
Significant correlation between the methylation states of adjacent CpG sites and a high incidence of short-range comethylation has been reported previously (Eckhardt et al. 2006; Irizarry et al. 2008). Therefore, we examined the methylation state of one CpG site as a function of methylation at the subsequent CpG site within our selected CGIs (Fig. 3B,C). There was clearly autocorrelation of methylation frequencies through a CGI (0.949 for MDA-MB-231; 0.944 for CHP-SKN-1). Specifically, if a CpG is highly methylated, then the neighboring CpG is more likely to be methylated, and vice versa (Fig. 3B,C). Furthermore, the concentration of points along the diagonal indicates that partially methylated CpGs are also highly autocorrelated within islands, and will therefore likely reside in a neighborhood of partial methylation.
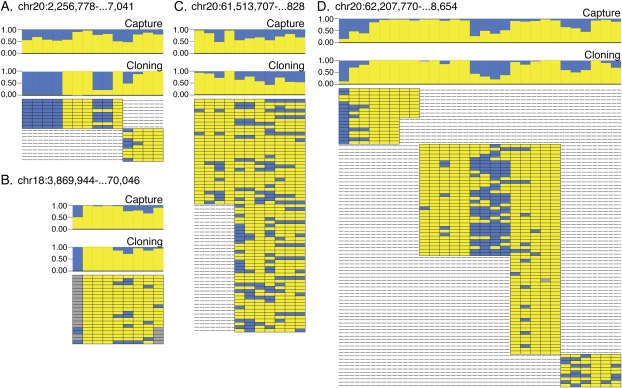
To validate the accuracy of results obtained with hybrid selection and single molecule sequencing, we selected four CGIs to profile independently with traditional bisulfite cloning and sequencing. The CGIs were specifically selected to validate estimates of intermediate methylation frequency. For each of the four CGIs, multiple overlapping PCR products were generated from the bisulfite converted tumor cell line DNA. Purified amplicons were cloned, and individual colonies were sequenced by traditional capillary sequencing, generating 202 high quality reads. The methylation status of each CpG within each sequenced clone is depicted in Figure 4, along with histograms of CpG methylation frequencies for both traditional bisulfite cloning and bisulfite capture. Excluding the region in Figure 4A, for which too few traditional bisulfite reads were obtained, the methylation frequencies estimated from both methods correspond very closely. We obtained 90% confidence intervals on the methylation proportion at 62 CpGs using traditional bisulfite reads. The confidence intervals overlapped those based on the bisulfite capture at 81% of the CpGs (see Supplemental Table 2). Of the 12 for which the intervals did not overlap, the methylation level estimated using bisulfite capture was closer to 50% on all but two CpG sites. This demonstrates that the hypo/hyper-methylated probe-pair strategy used in bisulfite capture does not bias the capture toward extreme states. In addition, these results also indicate that the higher sampling rates achieved with capture and single molecule sequencing contribute to higher accuracy in calling methylation status.
Figure 4.
Methylation status of bisulfite sequenced clones. (A–D) Four independent CGI loci are shown. Two histograms plot methylation frequencies at individual CpG sites for both the bisulfite capture data (upper) and the conventional bisulfite cloning data (lower) for all four loci. The block diagrams illustrate methylation state at each CpG site for each individually analyzed clone.
Patterns of CpG island methylation
Changes in DNA methylation patterns have been associated with a number of human diseases, and aberrant DNA methylation contributes causally to tumorigenesis. For example, a significantly elevated proportion of somatic mutations in the tumor suppressor TP53 (also known as p53) have been found at CpG sites (Rideout et al. 1990). Moreover, tumor genomes are generally hypomethylated, which may contribute to genome instability, perhaps in part by releasing constraints on mobile genetic elements (Lengauer et al. 1997). The global reduction in methylation is accompanied by hypermethylation of individual CGIs, some of which are associated with tumor suppressor genes (Herman and Baylin 2003).
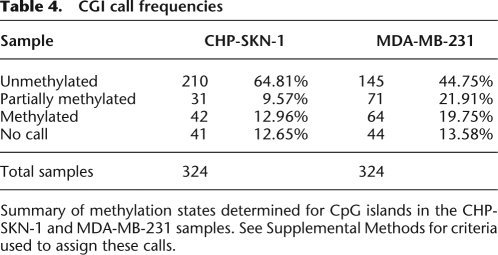
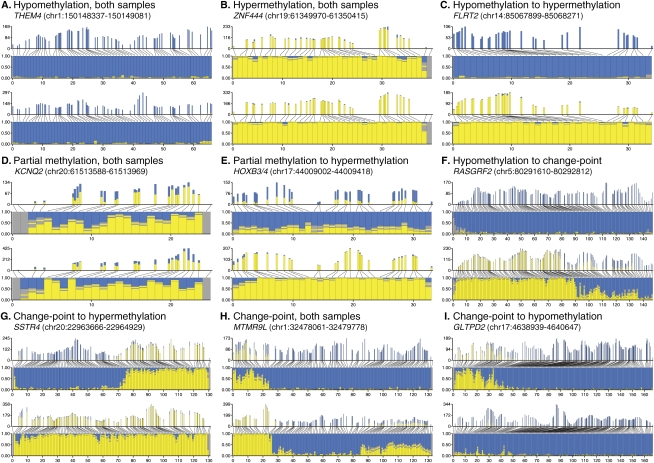
We, therefore, compared patterns of CpG methylation in our normal fibroblast and breast tumor cell lines (Table 4). Consistent with previously observed trends, the distribution of CpG methylation frequencies was largely bimodal (Fig. 3B,C; Supplemental Figs. S3, S4) with more CGI CpGs in the tumor cell line exhibiting high methylation frequency as compared to the normal fibroblast sample. The aggregate results on individual CpGs in our sampled islands suggest a picture of mostly unmethylated CGIs in the normal cell line and elevated methylation in the tumor cell line. While a little over half of the islands fall into expected categories of fully methylated or fully unmethylated, a surprising number of CGIs displayed more complex methylation profiles. A closer inspection of the individual islands, examples of which are shown in Figure 5 and Supplemental Figure S5, revealed a rich substructure in many islands that might not be apparent without their examination at the single-nucleotide level.
Table 4.
CGI call frequencies
Summary of methylation states determined for CpG islands in the CHP-SKN-1 and MDA-MB-231 samples. See Supplemental Methods for criteria used to assign these calls.
Figure 5.
Patterns of methylation in CpG islands. Graphical representation of methylation patterns in nine CpG islands. A pair of graphics represents each CpG island, one graphic for each sample (top, CHP-SKN-1; bottom, MDA-MB-231). Each graphic shows a pair of plots, both with bars indicating the amount of methylated (yellow) and unmethylated (blue) reads mapping over each CpG. The upper plot shows the absolute numbers of reads and spacing between CpGs. The lower plot shows the proportions of methylated and unmethylated reads. Confidence intervals are indicated in gray, and the yellow bar inside the confidence interval indicates the exact methylation frequency. Similar plots for the remaining CGIs are given in Supplemental Figure S5.
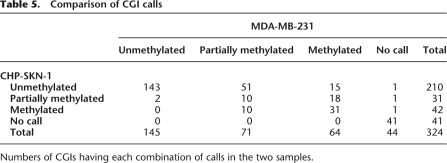
Around 54% of the CGIs showed clearly defined and consistent methylation states across the entire island in both samples. The most common were “unmethylated” islands, with few CGIs assigned as methylated in either the MDA-MB-231 or the CHP-SKN-1 sample (143 cases) (Table 5; Fig. 5A). A smaller subset (31 cases) showed nearly complete methylation in both samples (Table 5; Fig. 5B). We observed 15 cases that were virtually unmethylated in CHP-SKN-1 but completely methylated in the tumor line, as exemplified by the island at the transcription start site (TSS) of the cell adhesion associated gene FLRT2 (Fig. 5C). We did not observe the converse, where a completely methylated island in CHP-SKN-1 was completely unmethylated in MDA-MB-231; however, there were multiple cases in which methylation was clearly reduced in the tumor line, either in subregional blocks or across an entire island (Fig. 5). For ∼13% of the islands in this study (41/324), states could not be assigned because all or a large portion of the island overlapped repetitive elements in the genome, and a sufficient proportion of reads could not be uniquely mapped.
Table 5.
Comparison of CGI calls
Numbers of CGIs having each combination of calls in the two samples.
Approximately 28% (92 cases) of the investigated CGIs displayed methylation signatures other than simple all or none methylation across the island. These heterogeneous profiles appear in two distinct topologies. First, mixed methylation assignments for individual CpG sites give rise to partial or intermediate methylation, either across the whole island or in subregional blocks (Fig. 5D–F,H). This pattern is exemplified by an island located near the 3′ end of KCNQ2, a putatively imprinted gene (Luedi et al. 2007), where both samples are partially methylated across the entire island (Fig. 5D). Note that the solid gray bars at the ends of the island represent unassigned CpGs due to their location in the repetitive sequence that often flanks CpG islands. A CGI overlapping the HOXB4 promoter and lying in the HOXB3 transcript appears to be partially methylated in CHP-SKN-1, consistent with its prediction to be imprinted (Luedi et al. 2007), but is fully methylated in MDA-MB-231, consistent with reports that HOX clusters are often methylated in breast cancer (Fig. 5E; Rauch et al. 2007).
A second topology is defined by sharp transitions from one methylation state to another within an island (Fig. 5F–I). Figure 5G–I illustrates such structural complexity. Many islands showed some degree of methylation in localized, contiguous blocks. These switches are striking and often define domains of the CGI with respect to methylation. In a number of cases these regions, or blocks of methylation, occupy the same position in both samples. These observations indicate the presence of “punctuation marks” within CpG islands that likely reflect underlying biological mechanisms.
We noted that islands displaying these transitions often overlap TSS and exon junctions. As examples, for islands spanning significant portions of the SSTR4 and RASGRF2 genes, the transitions in methylation occur around or close to the TSS. Likewise, the CGI fully overlapping the GLTPD2 gene locus contains a short domain of mostly methylated CpGs in CHP-SKN-1 that covers the 5′UTR of the gene. Interestingly, the transition to hypomethylation closely corresponds with the first coding exon of the gene.
To complement the comprehensive overview of methylation states in the two cell lines, we also categorized CpG methylation by genomic annotation, examining promoter-associated, genic, and intergenic sites (Supplemental Fig. S6; Supplemental Table 3). As expected, the fibroblast cells displayed a higher number of fully unmethylated CpGs/CGIs in each of the specified regions and the tumor cell line had consistently higher methylation. For promoter regions, the highest proportion of differentially methylated CGIs was heterogeneously methylated in MDA-MB-231. Remarkably, a significant fraction of intragenic CGIs was methylated to some degree in both cell lines, and nearly half of the intragenic CGIs in MDA-MB-231 were fully methylated. This observation is supported by numerous other studies in which gene body methylation, an evolutionarily conserved phenomenon, was detected (Suzuki and Bird 2008).
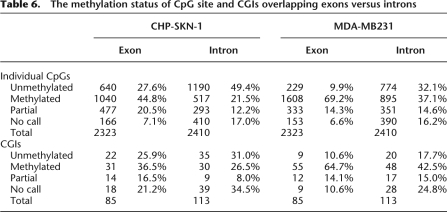
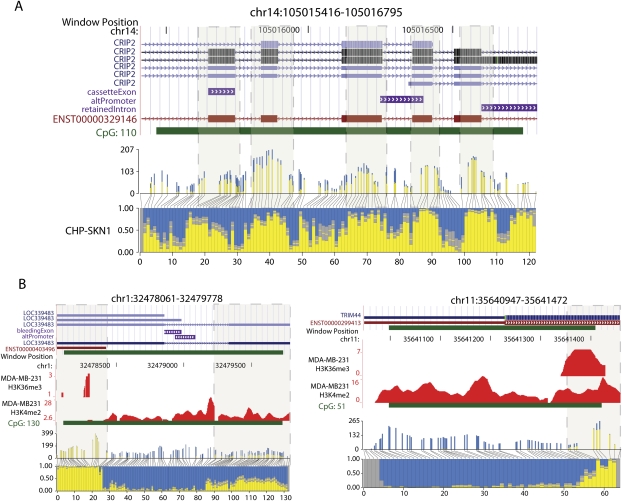
The occurrence of gene body methylation in our data, combined with the notable overlap between methylation breakpoints and transcriptional units, led us to examine the relationship between DNA methylation and local gene structure. Surprisingly, we observed enrichment for methylated CpG sites within exons as compared to introns (Table 6). This trend was quite pronounced in the cancer cell line where methylation levels were higher overall. In fact, we identified several examples for which methylation blocks closely imitate exon arrangements within the gene (Fig. 6A). These results suggest an ordered configuration in DNA methylation domains that occurs not only within promoters and 5′UTRs but also within gene bodies. While DNA methylation within transcribed genes has been reported, enrichment for DNA methylation in exons has not been previously described. This insight underscores the value of single base resolution methods for mapping methylation, without which such detail may have been overlooked.
Table 6.
The methylation status of CpG site and CGIs overlapping exons versus introns
Figure 6.
Blocks of DNA methylation overlap exons, histone H3K36me3, and histone H3K4me2 marks. (A) An example of a CGI that overlaps multiple exons. Annotated gene tracks were downloaded from the UCSC Genome Browser. The gene tracks are displayed above a histogram plotting methylation frequencies at specific CpG sites positioned along the region shown. Absolute read counts and actual distance between CpG sites are depicted in the upper histogram, whereas the lower histogram shows the proportion of methylated and unmethylated Cs at each site. Boxes with dashed borders highlight blocks of methylation overlapping exons. The edges of the block are defined by the point at which the proportion of reads methylated is at least 0.5. (B) Two examples for which the distribution of histone marks along the CGI reflects DNA methylation status. To display the ChIP-seq data, a wiggle track was created for each histone mark by counting reads mapped in five-base windows across the genome.
Patterns of histone modification closely correlate with DNA methylation (Meissner et al. 2008). We therefore performed chromatin immunoprecipitation with massively parallel sequencing (ChIP-seq) for two histone modifications, H3K4me2 and H3K36me3, that reflect different genomic elements. H3K4 is primarily associated with promoter regions, TSS and transcriptionally permissive chromatin, while histone H3K36 modifications are located primarily within the gene bodies of actively transcribed genes. Recently, a study describing H3K36me3 ChIP with microarray hybridization (ChIP-chip) in Caenorhabditis elegans noted a preferential marking of exons relative to introns (Kolasinska-Zwierz et al. 2009). Surprisingly, not only did our data corroborate this finding, but we also found a strong correlation between H3K36me3 and DNA methylation (Supplemental Table 4). This is further supported by the observation that exons are enriched with DNA methylation. Conversely, we found that, as expected, H3K4me2 is correlated with lack of DNA methylation. Finally, we noted that, in many cases, the distribution of the two histone marks closely reflects the subregional patterns of DNA methylation within CpG islands (Fig. 6B; Supplemental Fig. S7).
Finally, we examined the relationship between dinucleotide frequencies and overall methylation in CGIs. Consistent with earlier reports, a strong negative correlation (−0.39 in CHP-SKN-1 and −0.32 in MDA-MB-231) between CpG density and total CGI methylation was observed (Zhang et al. 2009). However, we also observed a strong positive correlation (0.69 in CHP-SKN-1 and 0.54 in MDA-MB-231) between CA/TG frequency and total methylation of the CGIs. Furthermore, sharp cutoffs for frequencies of these dinucleotides can accurately distinguish hypomethylated islands from those showing partial or full methylation, with both strong sensitivity and specificity (see Supplemental Tables 5,6; Supplemental Methods). This suggests existing definitions may not accurately capture the relationship between CpG density and protection from CpG depletion over evolutionary time scales. It is likely that more sophisticated definitions, which may account for characteristics beyond base composition, will be required to define the underlying evolutionary phenomena that produce CGIs.
Discussion
Existing methods for profiling DNA methylation are largely CGI centric and fail to examine methylation in regions beyond those defined as canonical islands (or islands significantly enriched in CpGs). However, the bisulfite capture method is readily programmable, and with the sensitivity and scale achieved here, this approach could be extended to any non-repeat, CpG-containing region in the genome, regardless of CpG density. Bisulfite sequencing of cloned DNA fragments is a well-established gold standard for mapping methylation at high resolution, as exemplified by a recent study of DNA methylation across gene promoter regions on human chromosome 21 (Zhang et al. 2009). This study highlights many of the same features of DNA methylation discussed here. In fact, our method is designed to provide a similar high level of resolution for hundreds of genomic regions without the need for creating individual PCR amplicons and sequencing individual clones. It is currently very costly to perform clone sequencing on the scale necessary to sample thousands of sites in multiple individual samples. Bisulfite capture provided both qualitative and quantitative methylation measurements that were nearly identical to bisulfite sequencing while permitting the highly parallel analysis necessary to understand the biological impact of changes across the epigenome in many cell types and/or individual specimens.
Despite their close correlation, there were a few subtle differences in the extent of CpG methylation detected by capture and conventional PCR bisulfite sequencing in our validation studies (see Fig. 4). Notably several CpGs showed full methylation in conventional PCR products but small fractions of unmodified CpGs in the capture sample. These discrepancies could arise in several ways. Principally, the next-generation approach with its higher coverage could provide a more accurate measurement than that obtained with the more limited clone sequencing. Artifacts could arise if some unmethylated Cs were not converted or if the next-gen platforms, with their intrinsically higher error rates, erroneously reported T at a fully methylated position. The magnitudes of both of these effects are expected to be small. Both capture and conventional measurements are each also likely subject to biases that are intrinsic to each methodology. Both are expected to under-represent highly GC-rich sequences in the initial PCR amplifications and next-gen platforms may compound this problem. Capture bisulfite may compensate for this shortcoming by permitting discrimination of independent founder molecules, based on the random 5′ ends of sequenced fragments.
While we directed the focus of our arrays to CGI regions, this method would apply equally well when profiling methylation in non-CGI target regions, as the hybridization properties of the bisulfite-treated sample will generally be very similar both inside and outside of CGIs. Presently the bisulfite capture method cannot be applied to individual repeat copies, since these would be ambiguous in both capture and mapping. However, it is conceivable that capture could be used to determine the overall state or repeat families.
Our approach requires no a priori knowledge of the methylation state of target loci. By designing probes corresponding to extreme states, with all CpGs in the target region either fully methylated or unmethylated, we created a probe set that would sufficiently hybridize the selected regions, even if CpG dinucleotides in target fragments were methylated randomly. Since most studies find local correlation between the methylation states of neighboring CpGs, the overall extent of the mismatch problem is likely to be much lower than the theoretical maximum we anticipated. Nevertheless, recovery of fragments containing both methylated and unmethylated residues provided clear evidence for the unbiased capture of molecules with mixed methylation states. Independent validation using conventional bisulfite sequencing of regions with partial methylation frequencies verified that our approach did not significantly bias the determination of methylation patterns toward local uniformity in CpG status.
Despite its initial success, our current protocol does have room for improvement in enrichment, completeness, and uniformity of coverage. While longer reads and increased sequencing depth will improve CpG calling to some extent, the largest gains will likely be made in probe design and array structure. Presently, we capture two genomic strands. However, it is clear that the number of target CpG can be doubled simply by assaying only one strand. Moreover, array densities continue to increase. Recently, the number of probes on the array platform we most commonly use has quadrupled. Finally, we have covered the target CGIs at relatively high tiling density, and improvements in probe design/selection may allow longer tiling intervals and capture of more extensive genomic regions on a single array. Even without significant changes to our protocols, it is likely that a 10-fold increase in covered sites can easily be achieved. Besides allowing larger target regions to be examined at greater coverage, more efficient capture arrays, when combined with sample indexing for multiplex captures, will enable targeted profiling of DNA methylation in large numbers of samples, opening the door to potential clinical applications (Laird 2003). Although increased sequencing throughput will eventually enable shotgun bisulfite sequencing of mammalian genomes at relatively deep coverage, it will always remain important to profile many samples simultaneously (for example, tumor samples from large numbers of patients). Bisulfite capture will enable increases in sequencing throughput to be directed toward a broader sampling of individual variation while maintaining sufficient coverage at genomic regions of clinical interest.
Previously, we found that genomic repeats could confound efficient capture. To combat this, we eliminate multicopy capture probes based upon average representation of their constituent 15mers in the genome. Because of the reduction in complexity following bisulfite treatment, the same rules could not be directly applied and repeats were not suppressed in these initial studies. Moreover, inclusion of Cot-1 DNA in hybridizations improves enrichment in conventional captures. Though we did use Cot-1 in these studies, it was unconverted and thus might not compete effectively with the repeat sequences present in our samples.
Approximately 19% of the selected CpG islands displayed localized shifts between hyper- and hypomethylated states. In a number of cases, these subregional domains were differentially methylated in the two cell populations. Previously, variation in DNA methylation has been characterized as uncommon in CpG islands when compared to nearby regions, called CpG shores, which are classified as outside of the dense CpG content that define islands (Irizarry et al. 2009). Similarly, we and others describe the correlation with CpG content and methylation states, finding that, overall, methylation is inversely correlated with CpG density (Zhang et al. 2009). However, the complex patterns that we observed within islands could not be explained by differential CpG density or by the imperfect criteria that define CpG islands. Instead, we suggest that both genomic context (i.e., gene bodies, promoters, repeat regions) and local chromatin conformation as determined by histone modifications can dictate localized DNA methylation states. This proposal is consistent with previous findings that histone modifications are better correlated with DNA methylation than is sequence context. Indeed, the unexpected enrichment for DNA methylation in exons combined with the correlation between DNA methylation and trimethyl histone H3K36 may suggest a link between DNA methylation, the regulation of transcription initiation, and RNA processing (Carrozza et al. 2005; Keogh et al. 2005).
Here, we examined clonal cell lines, whose methylation patterns are relatively homogeneous. Tissue-derived samples likely contain multiple methylation states at a given locus, in part because of imprinting and X-inactivation, but mainly because of cell-type heterogeneity in even the most purified populations. Thus, variations in methylation patterns could represent a mixture of several distinct “epitypes,” each of which is a signature of the cell type from which it was derived. The depth of coverage achieved in bisulfite capture, combined with increases in read length, may permit assembly of such epitypes—a procedure analogous to metagenomic assembly. Ultimately, approaches that deeply sample the epigenome at single-nucleotide resolution and at the single-molecule level may allow us to detect the presence of rare stem cell populations and to track the epigenetic reprogramming that correlates with the commitment and fate specification of such multipotent cells to differentiated cell fates.
Methods
DNA library preparation and bisulfite conversion
Genomic DNA libraries were generated as previously described with a few important modifications (Hodges et al. 2007). Briefly, purified cell-line DNA was randomly fragmented by sonication and subsequently treated with a mixture of T4 DNA Polymerase, Escherichia coli DNA polymerase I Klenow fragment, and T4 polynucleotide kinase to repair, blunt and phosphorylate ends according to the manufacturer's instructions (Illumina). The repaired DNA fragments were subsequently 3′ adenylated using Klenow exo-fragment (Illumina). After each step, the DNA was recovered using the QIAquick PCR Purification kit (Qiagen). Adenylated fragments were ligated to Illumina-compatible paired-end adaptors synthesized with 5′-methyl-cytosine instead of cytosine (Illumina) and fragments ranging from 150 to 300 bp were extracted by gel purification using the QIAquick gel extraction kit (Qiagen) followed by elution in 30 μL elution buffer. Following size selection and gel purification, the adaptor-ligated DNA was divided into two separate reactions to ensure optimal DNA concentration for subsequent cytosine conversion reactions. Fragments were denatured and treated with sodium bisulfite using the EZ DNA methylation gold kit according to the manufacturer's instructions (Zymo). Lastly, the sample was desulfonated and the converted, adaptor-ligated fragments were PCR-enriched using paired-end adaptor-compatible primers 1.0 and 2.0 (Illumina) and Expand High Fidelity PLUS PCR system (Roche), a specialized polymerase capable of amplifying the highly denatured, uracil-rich templates. PCR reactions contained 1× Expand HiFi PLUS reaction buffer, 200 μM each dNTP, 1 μM each primer, 2.5 mM MgCl2, and 2.5 U Expand HiFi PLUS enzyme. The reactions were performed under the following conditions: 94°C for 2 min, 25 cycles of 94°C for 15 sec, 65°C for 30 sec, and 72°C for 30 sec, followed by 72°C for 7 min. Following amplification, the samples were hybridized to both arrays and captured fragments were recovered and sequenced.
CpG island array capture
Twenty micrograms of bisulfite-treated DNA was hybridized to custom Agilent 244K microarrays according to the Agilent aCGH protocol with several recently descried modifications (Hodges et al. 2009). Firstly, in addition to 20-μg sample DNA, 50-μg human Cot-1 DNA (Invitrogen) and Agilent blocking agent, Agilent aCGH/ChIP Hi-RPM hybridization buffer was supplemented with ∼1 nmol each of four blocking oligonucleotides (IDT; see Supplemental Table 7) before denaturing at 95°C. The samples were hybridized at 65°C for 65 h in a rotating microarray oven (SciGene). After hybridization, the arrays were washed at room temperature for 10 min with aCGH wash buffer 1 (Agilent) and washed with aCGH wash buffer 2 (Agilent) at 37°C for 5 min. Slides were briefly dried at low speed in a slide rack using a centrifuge with a microplate adaptor. Captured bilsulfite-treated DNA fragments hybridized to the arrays were immediately eluted with 490 μL nuclease-free water at 95°C for 5 min in the rotating microarray oven. The fragments were removed from the chamber assembly using a 18-1/2 G syringe (BD Biosciences). Samples were subsequently lyophilized and resuspended for amplification. Five 18-cycle PCR amplifications were performed in parallel for each eluate using Expand high fidelity plus PCR system (Roche). Following amplification, the PCR reactions were pooled and purified on Qiagen purification columns.
Single molecule sequencing
The DNA was quantified using the Nanodrop 7500 and diluted to a working concentration of 10 nM. Cluster generation was performed for samples representing each array capture in individual lanes of the Illumina GA2 flow cell. An adaptor-compatible sequencing primer (Illumina) was hybridized to the prepared flow cell and 36 cycles of base incorporation were carried out on the Illumina GA2 genome analyzer.
Conventional bisulfite cloning and Sanger sequencing
Specific regions of bisulfite treated CHP-SKN-1 and MDA-MB-231 DNA were PCR-amplified and their products cloned and sequenced using conventional Sanger sequencing. Briefly, CHP-SKN-1 and MDA-MB-231 genomic DNA was bisulfite-converted using the Qiagen Epitect bisulfite kit according to manufacturer's instructions. The forward and reverse primers were designed for the forward strand using the online primer design tool Methprimer (Li and Dahiya 2002) followed by manual selection of primer sets to satisfy Tm and other requirements. Primer sequences are provided in Supplemental materials (Supplemental Table 8). Thermal cycling was performed as follows: 40 cycles each of denaturation at 92°C for 50 sec, annealing at 52°C for 1 min and extension at 72°C for 1 min followed by 10 min at 72°C. The PCR products were analyzed on a 2% agarose gel and the reaction mixtures were purified using a PCR purification kit (Qiagen). Purified PCR products were subcloned into the pCR 2.1-TOPO vector using the TOPO TA cloning kit (Invitrogen) according to the manufacturer's recommendations. Clones were transformed into Top10 competent cells and subsequent colonies were isolated, cultured overnight, and bacterial DNA was purified using the DirectPrep 96 Miniprep kit (Qiagen) according to the provided instructions. The sequencing reaction was performed directly on the purified clones using the M13 Forward and Reverse primers and BigDye version 3.1 DyeDeoxy terminator reaction mixture (Applied Biosystems). Sequences were analyzed on a 3100 genetic Analyzer (Applied Biosystems).
ChIP-seq
CHP-SKN-1 cells were grown in 15 cm plates with DMEM medium containing 20% FBS supplemented with L-glutamine, nonessential amino acids and penicillin/streptomycin. MDA-MB-231 cells were grown in DMEM containing 15% FBS, L-glutamine, nonessential amino acids, and penicillin/streptomycin. Chromatin immunoprecipitation was performed with rabbit anti-trimethyl histone H3K36 (Abcam, ab32356) and rabbit anti-dimethyl histone H3K4 (Abcam, ab9050) according to previously described methods (Steger et al. 2008). Following elution, IP samples were treated with RNaseA at 65°C overnight followed by proteinase K at 42°C for 2 h. DNA was isolated by phenol:chloroform extraction and ethanol precipitation.
To prepare ChIP DNA for Illumina sequencing, we adapted the protocol described by Robertson et al. (2007). Prior to starting the library construction, each sample was brought up to 75 μL using nuclease-free water. The DNA ends were then treated with a mixture of T4 DNA Polymerase, E. coli DNA polymerase I Klenow fragment, and T4 polynucleotide kinase to repair, blunt and phosphorylate ends according to the manufacturer's instructions (Illumina). After a 30-min incubation at 20°C, 150 μL of 0.5 M NaCl was added to the 100 μL end-repair reactions. The mixtures were subjected to a phenol-choloroform-isoamyl alcohol (pH 8; 250 μL; Sigma) extraction in 1.5 mL microcentrifuge tubes (Eppendorf) and subsequently precipitated with 625 μL 100% ethanol for 20 min at −20°C. The DNA was recovered by centrifuging at 21,000g for 15 min at 4°C in a desktop refrigerated centrifuge and washed with 1 mL 70% ethanol. The pellets were resuspended in 32 μL prewarmed EB buffer (Qiagen; 50°C) and adenylated using Klenow exo-fragment following the manufacturer's instructions (Illumina). After a 30-min incubation at 37°C, the reaction volumes were brought up to 100 μL using EB buffer. The reaction mixtures were phenol-cholorform-isoamyl alcohol extracted and precipitated as above and resuspended in 10 μL prewarmed EB buffer. Illumina single end adaptors were then ligated to the adenylated fragments using the Roche Rapid Ligation Kit according to the manufacturer's recommendations. For the inputs and immunoprecipitated samples, the adaptor oligonucleotide mix was diluted 1/10 and 1/100, respectively. The DNA was recovered using the QIAquick PCR Purification Kit (Qiagen) according to the manufacturer's instructions and eluted in 30 μL prewarmed EB buffer. The adaptor-ligated DNA was enriched by PCR using Phusion polymerase (Finnzymes) and PCR primers 1.1 and 2.1 (Illumina) following the manufacturer's instructions. One PCR reaction was prepared for the input libraries and six to seven parallel reactions for the immunoprecipitated libraries. The enriched input libraries were purified using a QIAquick MinElute PCR Purification Kit (Qiagen) according to the manufacturer's instructions and eluted in 15 μL prewarmed EB buffer. The parallel reactions of the enriched immunoprecipitated DNA were combined, treated with 20 μL 5 M NaCl, and phenol-cholorform-isoamyl alcohol extracted and precipitated, as described above. The pellets were resuspended in 60 μL prewarmed EB buffer and gel-extracted using the MinElute Gel Extraction Kit (Qiagen) following the manufacturer's instructions. A 200–350-bp region was size-selected and the DNA was eluted in 15 μL prewarmed EB buffer.
Computational data analysis
Reads were mapped with the RMAPBS program, freely available from the authors as Open Source software under the GNU Public License. A suite of software tools was implemented (also available from the authors) to estimate methylation frequencies of individual CpGs, tabulate statistics about methylation in each CpG island, and compile diagnostic statistics about bisulfite capture experiments. Details are provided in the Supplemental material.
Enrichment was computed as (reads mapped to genome/reads overlapping target regions)/(size of target regions/size of mappable genome). The bisulfite conversion rate was estimated as the ratio of thymines over the sum of cytosines and thymines mapping over genomic non-CpG cytosines. Bisulfite conversion rate was determined using reads mapping anywhere in the genome. Coverage was determined by counting the number of reads mapping over each base in the target regions.
Assigning CpG methylation status
Methylation status of individual CpGs were called using the frequency of methylated reads mapping over each CpG and the total number of reads mapping over the CpG, making use of a binomial confidence interval. If the upper 0.95 confidence bound was <0.25, then we called that CpG unmethylated in the sample. If the lower 0.95 confidence bound was at least 0.75, then we called that CpG methylated in the sample. For the remaining CpGs, if the difference between the upper and lower 0.95 confidence bounds was ≤0.25, then we called the CpG “partially methylated” in that sample. Regardless of the observed frequency of Cs and Ts mapping over a CpG, if the difference between the upper and lower confidence bounds was >0.25, we concluded that a confident call could not be made. Additional details are given along with graphical description in Supplemental Methods and Supplemental Figure S1.
Acknowledgments
We thank Danea Rebolini, Laura Cardone, and Melissa Kramer for help with Illumina sequencing, and Jeremy Hicks and Patty Bird for help in preparing the manuscript and illustrations. We also thank Stephanie Muller for Sanger sequencing of bisulfite PCR clones, and Chris Vakoc for sharing his expertise in ChIP-seq. E.H. is supported by training grant T32 CA00917631. This work was supported by grants from the Department of the Army W81XWH04-10477, the DOD Breast Cancer Research Program (G.J.H.), The Breast Cancer Research Foundation (J.B.H., M.W.), by grants from the NIH (G.J.H., M.Q.Z., W.R.M.), and by a kind gift from Kathryn W. Davis (G.J.H.). M.W. is an American Cancer Research Professor and G.J.H. is an Investigator of the Howard Hughes Medical Institute.
Footnotes
[Supplemental material is available online at http://www.genome.org. The ChIP-seq and bisulfite sequence data from this study have been submitted to NCBI Gene Expression Omnibus (GEO) (http://www.ncbi.nlm.nih.gov/geo/) under series accession no. GSE17001.]
Article published online before print. Article and publication date are at http://www.genome.org/cgi/doi/10.1101/gr.095190.109.
References
- Albert TJ, Molla MN, Muzny DM, Nazareth L, Wheeler D, Song X, Richmond TA, Middle CM, Rodesch MJ, Packard CJ, et al. Direct selection of human genomic loci by microarray hybridization. Nat Methods. 2007;4:903–905. doi: 10.1038/nmeth1111. [DOI] [PubMed] [Google Scholar]
- Ball MP, Li JB, Gao Y, Lee JH, LeProust EM, Park IH, Xie B, Daley GQ, Church GM. Targeted and genome-scale strategies reveal gene-body methylation signatures in human cells. Nat Biotechnol. 2009;27:361–368. doi: 10.1038/nbt.1533. [DOI] [PMC free article] [PubMed] [Google Scholar]
- Bestor TH. Activation of mammalian DNA methyltransferase by cleavage of a Zn binding regulatory domain. EMBO J. 1992;11:2611–2617. doi: 10.1002/j.1460-2075.1992.tb05326.x. [DOI] [PMC free article] [PubMed] [Google Scholar]
- Bestor T, Laudano A, Mattaliano R, Ingram V. Cloning and sequencing of a cDNA encoding DNA methyltransferase of mouse cells. The carboxyl-terminal domain of the mammalian enzymes is related to bacterial restriction methyltransferases. J Mol Biol. 1988;203:971–983. doi: 10.1016/0022-2836(88)90122-2. [DOI] [PubMed] [Google Scholar]
- Bird AP. CpG-rich islands and the function of DNA methylation. Nature. 1986;321:209–213. doi: 10.1038/321209a0. [DOI] [PubMed] [Google Scholar]
- Bird AP, Taggart MH. Variable patterns of total DNA and rDNA methylation in animals. Nucleic Acids Res. 1980;8:1485–1497. doi: 10.1093/nar/8.7.1485. [DOI] [PMC free article] [PubMed] [Google Scholar]
- Brunner AL, Johnson DS, Kim SW, Valouev A, Reddy TE, Neff NF, Anton E, Medina C, Nguyen L, Chiao E, et al. Distinct DNA methylation patterns characterize differentiated human embryonic stem cells and developing human fetal liver. Genome Res. 2009;19:1044–1056. doi: 10.1101/gr.088773.108. [DOI] [PMC free article] [PubMed] [Google Scholar]
- Carrozza MJ, Li B, Florens L, Suganuma T, Swanson SK, Lee KK, Shia WJ, Anderson S, Yates J, Washburn MP, et al. Histone H3 methylation by Set2 directs deacetylation of coding regions by Rpd3S to suppress spurious intragenic transcription. Cell. 2005;123:581–592. doi: 10.1016/j.cell.2005.10.023. [DOI] [PubMed] [Google Scholar]
- Chaillet JR, Vogt TF, Beier DR, Leder P. Parental-specific methylation of an imprinted transgene is established during gametogenesis and progressively changes during embryogenesis. Cell. 1991;66:77–83. doi: 10.1016/0092-8674(91)90140-t. [DOI] [PubMed] [Google Scholar]
- Cokus SJ, Feng S, Zhang X, Chen Z, Merriman B, Haudenschild CD, Pradhan S, Nelson SF, Pellegrini M, Jacobsen SE. Shotgun bisulphite sequencing of the Arabidopsis genome reveals DNA methylation patterning. Nature. 2008;452:215–219. doi: 10.1038/nature06745. [DOI] [PMC free article] [PubMed] [Google Scholar]
- Deng J, Shoemaker R, Xie B, Gore A, LeProust EM, Antosiewicz-Bourget J, Egli D, Maherali N, Park IH, Yu J, et al. Targeted bisulfite sequencing reveals changes in DNA methylation associated with nuclear reprogramming. Nat Biotechnol. 2009;27:353–360. doi: 10.1038/nbt.1530. [DOI] [PMC free article] [PubMed] [Google Scholar]
- Dupont JM, Tost J, Jammes H, Gut IG. De novo quantitative bisulfite sequencing using the pyrosequencing technology. Anal Biochem. 2004;333:119–127. doi: 10.1016/j.ab.2004.05.007. [DOI] [PubMed] [Google Scholar]
- Eads CA, Danenberg KD, Kawakami K, Saltz LB, Blake C, Shibata D, Danenberg PV, Laird PW. MethyLight: A high-throughput assay to measure DNA methylation. Nucleic Acids Res. 2000;28:e32. doi: 10.1093/nar/28.8.e32. [DOI] [PMC free article] [PubMed] [Google Scholar]
- Eckhardt F, Lewin J, Cortese R, Rakyan VK, Attwood J, Burger M, Burton J, Cox TV, Davies R, Down TA, et al. DNA methylation profiling of human chromosomes 6, 20 and 22. Nat Genet. 2006;38:1378–1385. doi: 10.1038/ng1909. [DOI] [PMC free article] [PubMed] [Google Scholar]
- Ehrich M, Nelson MR, Stanssens P, Zabeau M, Liloglou T, Xinarianos G, Cantor CR, Field JK, van den Boom D. Quantitative high-throughput analysis of DNA methylation patterns by base-specific cleavage and mass spectrometry. Proc Natl Acad Sci. 2005;102:15785–15790. doi: 10.1073/pnas.0507816102. [DOI] [PMC free article] [PubMed] [Google Scholar]
- Ehrich M, Turner J, Gibbs P, Lipton L, Giovanneti M, Cantor C, van den Boom D. Cytosine methylation profiling of cancer cell lines. Proc Natl Acad Sci. 2008;105:4844–4849. doi: 10.1073/pnas.0712251105. [DOI] [PMC free article] [PubMed] [Google Scholar]
- Gardiner-Garden M, Frommer M. CpG islands in vertebrate genomes. J Mol Biol. 1987;196:261–282. doi: 10.1016/0022-2836(87)90689-9. [DOI] [PubMed] [Google Scholar]
- Haines TR, Rodenhiser DI, Ainsworth PJ. Allele-specific non-CpG methylation of the Nf1 gene during early mouse development. Dev Biol. 2001;240:585–598. doi: 10.1006/dbio.2001.0504. [DOI] [PubMed] [Google Scholar]
- Herman JG, Baylin SB. Gene silencing in cancer in association with promoter hypermethylation. N Engl J Med. 2003;349:2042–2054. doi: 10.1056/NEJMra023075. [DOI] [PubMed] [Google Scholar]
- Hicks J, Krasnitz A, Lakshmi B, Navin NE, Riggs M, Leibu E, Esposito D, Alexander J, Troge J, Grubor V, et al. Novel patterns of genome rearrangement and their association with survival in breast cancer. Genome Res. 2006;16:1465–1479. doi: 10.1101/gr.5460106. [DOI] [PMC free article] [PubMed] [Google Scholar]
- Hodges E, Xuan Z, Balija V, Kramer M, Molla MN, Smith SW, Middle CM, Rodesch MJ, Albert TJ, Hannon GJ, et al. Genome-wide in situ exon capture for selective resequencing. Nat Genet. 2007;39:1522–1527. doi: 10.1038/ng.2007.42. [DOI] [PubMed] [Google Scholar]
- Hodges E, Rooks M, Xuan Z, Bhattacharjee A, Benjamin Gordon D, Brizuela L, McCombie WR, Hannon GJ. Hybrid selection of discrete genomic intervals on custom-designed microarrays for massively parallel sequencing. Nat Protocols. 2009;4:960–974. doi: 10.1038/nprot.2009.68. [DOI] [PMC free article] [PubMed] [Google Scholar]
- Holliday R, Pugh JE. DNA modification mechanisms and gene activity during development. Science. 1975;187:226–232. [PubMed] [Google Scholar]
- Hughes TR, Mao M, Jones AR, Burchard J, Marton MJ, Shannon KW, Lefkowitz SM, Ziman M, Schelter JM, Meyer MR, et al. Expression profiling using microarrays fabricated by an ink-jet oligonucleotide synthesizer. Nat Biotechnol. 2001;19:342–347. doi: 10.1038/86730. [DOI] [PubMed] [Google Scholar]
- Irizarry RA, Ladd-Acosta C, Carvalho B, Wu H, Brandenburg SA, Jeddeloh JA, Wen B, Feinberg AP. Comprehensive high-throughput arrays for relative methylation (CHARM) Genome Res. 2008;18:780–790. doi: 10.1101/gr.7301508. [DOI] [PMC free article] [PubMed] [Google Scholar]
- Irizarry RA, Ladd-Acosta C, Wen B, Wu Z, Montano C, Onyango P, Cui H, Gabo K, Rongione M, Webster M, et al. The human colon cancer methylome shows similar hypo- and hypermethylation at conserved tissue-specific CpG island shores. Nat Genet. 2009;41:178–186. doi: 10.1038/ng.298. [DOI] [PMC free article] [PubMed] [Google Scholar]
- Keogh MC, Kurdistani SK, Morris SA, Ahn SH, Podolny V, Collins SR, Schuldiner M, Chin K, Punna T, Thompson NJ, et al. Cotranscriptional Set2 methylation of histone H3 lysine 36 recruits a repressive Rpd3 complex. Cell. 2005;123:593–605. doi: 10.1016/j.cell.2005.10.025. [DOI] [PubMed] [Google Scholar]
- Keshet I, Lieman-Hurwitz J, Cedar H. DNA methylation affects the formation of active chromatin. Cell. 1986;44:535–543. doi: 10.1016/0092-8674(86)90263-1. [DOI] [PubMed] [Google Scholar]
- Khulan B, Thompson RF, Ye K, Fazzari MJ, Suzuki M, Stasiek E, Figueroa ME, Glass JL, Chen Q, Montagna C, et al. Comparative isoschizomer profiling of cytosine methylation: The HELP assay. Genome Res. 2006;16:1046–1055. doi: 10.1101/gr.5273806. [DOI] [PMC free article] [PubMed] [Google Scholar]
- Kolasinska-Zwierz P, Down T, Latorre I, Liu T, Liu XS, Ahringer J. Differential chromatin marking of introns and expressed exons by H3K36me3. Nat Genet. 2009;41:376–381. doi: 10.1038/ng.322. [DOI] [PMC free article] [PubMed] [Google Scholar]
- Laird PW. The power and the promise of DNA methylation markers. Nat Rev Cancer. 2003;3:253–266. doi: 10.1038/nrc1045. [DOI] [PubMed] [Google Scholar]
- Lengauer C, Kinzler KW, Vogelstein B. DNA methylation and genetic instability in colorectal cancer cells. Proc Natl Acad Sci. 1997;94:2545–2550. doi: 10.1073/pnas.94.6.2545. [DOI] [PMC free article] [PubMed] [Google Scholar]
- Li LC, Dahiya R. MethPrimer: Designing primers for methylation PCRs. Bioinformatics. 2002;18:1427–1431. doi: 10.1093/bioinformatics/18.11.1427. [DOI] [PubMed] [Google Scholar]
- Li E, Bestor TH, Jaenisch R. Targeted mutation of the DNA methyltransferase gene results in embryonic lethality. Cell. 1992;69:915–926. doi: 10.1016/0092-8674(92)90611-f. [DOI] [PubMed] [Google Scholar]
- Lippman Z, Gendrel AV, Black M, Vaughn MW, Dedhia N, McCombie WR, Lavine K, Mittal V, May B, Kasschau KD, et al. Role of transposable elements in heterochromatin and epigenetic control. Nature. 2004;430:471–476. doi: 10.1038/nature02651. [DOI] [PubMed] [Google Scholar]
- Luedi PP, Dietrich FS, Weidman JR, Bosko JM, Jirtle RL, Hartemink AJ. Computational and experimental identification of novel human imprinted genes. Genome Res. 2007;17:1723–1730. doi: 10.1101/gr.6584707. [DOI] [PMC free article] [PubMed] [Google Scholar]
- Meissner A, Mikkelsen TS, Gu H, Wernig M, Hanna J, Sivachenko A, Zhang X, Bernstein BE, Nusbaum C, Jaffe DB, et al. Genome-scale DNA methylation maps of pluripotent and differentiated cells. Nature. 2008;454:766–770. doi: 10.1038/nature07107. [DOI] [PMC free article] [PubMed] [Google Scholar]
- Monk M, Boubelik M, Lehnert S. Temporal and regional changes in DNA methylation in the embryonic, extraembryonic and germ cell lineages during mouse embryo development. Development. 1987;99:371–382. doi: 10.1242/dev.99.3.371. [DOI] [PubMed] [Google Scholar]
- Okano M, Xie S, Li E. Cloning and characterization of a family of novel mammalian DNA (cytosine-5) methyltransferases. Nat Genet. 1998;19:219–220. doi: 10.1038/890. [DOI] [PubMed] [Google Scholar]
- Okano M, Bell DW, Haber DA, Li E. DNA methyltransferases Dnmt3a and Dnmt3b are essential for de novo methylation and mammalian development. Cell. 1999;99:247–257. doi: 10.1016/s0092-8674(00)81656-6. [DOI] [PubMed] [Google Scholar]
- Okou DT, Steinberg KM, Middle C, Cutler DJ, Albert TJ, Zwick ME. Microarray-based genomic selection for high-throughput resequencing. Nat Methods. 2007;4:907–909. doi: 10.1038/nmeth1109. [DOI] [PubMed] [Google Scholar]
- Pevzner PA, Waterman MS. Multiple filtration and approximate pattern matching. Algorithmica. 1995;13:135–154. [Google Scholar]
- Rauch T, Wang Z, Zhang X, Zhong X, Wu X, Lau SK, Kernstine KH, Riggs AD, Pfeifer GP. Homeobox gene methylation in lung cancer studied by genome-wide analysis with a microarray-based methylated CpG island recovery assay. Proc Natl Acad Sci. 2007;104:5527–5532. doi: 10.1073/pnas.0701059104. [DOI] [PMC free article] [PubMed] [Google Scholar]
- Rauch TA, Wu X, Zhong X, Riggs AD, Pfeifer GP. A human B cell methylome at 100-base pair resolution. Proc Natl Acad Sci. 2009;106:671–678. doi: 10.1073/pnas.0812399106. [DOI] [PMC free article] [PubMed] [Google Scholar]
- Reik W. Stability and flexibility of epigenetic gene regulation in mammalian development. Nature. 2007;447:425–432. doi: 10.1038/nature05918. [DOI] [PubMed] [Google Scholar]
- Rideout WM, III, Coetzee GA, Olumi AF, Jones PA. 5-Methylcytosine as an endogenous mutagen in the human LDL receptor and p53 genes. Science. 1990;249:1288–1290. doi: 10.1126/science.1697983. [DOI] [PubMed] [Google Scholar]
- Robertson G, Hirst M, Bainbridge M, Bilenky M, Zhao Y, Zeng T, Euskirchen G, Bernier B, Varhol R, Delaney A, et al. Genome-wide profiles of STAT1 DNA association using chromatin immunoprecipitation and massively parallel sequencing. Nat Methods. 2007;4:651–657. doi: 10.1038/nmeth1068. [DOI] [PubMed] [Google Scholar]
- Sanford JP, Clark HJ, Chapman VM, Rossant J. Differences in DNA methylation during oogenesis and spermatogenesis and their persistence during early embryogenesis in the mouse. Genes & Dev. 1987;1:1039–1046. doi: 10.1101/gad.1.10.1039. [DOI] [PubMed] [Google Scholar]
- Saxonov S, Berg P, Brutlag DL. A genome-wide analysis of CpG dinucleotides in the human genome distinguishes two distinct classes of promoters. Proc Natl Acad Sci. 2006;103:1412–1417. doi: 10.1073/pnas.0510310103. [DOI] [PMC free article] [PubMed] [Google Scholar]
- Sebat J, Lakshmi B, Troge J, Alexander J, Young J, Lundin P, Maner S, Massa H, Walker M, Chi M, et al. Large-scale copy number polymorphism in the human genome. Science. 2004;305:525–528. doi: 10.1126/science.1098918. [DOI] [PubMed] [Google Scholar]
- Shen L, Kondo Y, Guo Y, Zhang J, Zhang L, Ahmed S, Shu J, Chen X, Waterland RA, Issa JP. Genome-wide profiling of DNA methylation reveals a class of normally methylated CpG island promoters. PLoS Genet. 2007;3:2023–2036. doi: 10.1371/journal.pgen.0030181. [DOI] [PMC free article] [PubMed] [Google Scholar]
- Smith A, Xuan Z, Zhang M. Using quality scores and longer reads improves accuracy of Solexa read mapping. BMC Bioinformatics. 2008;9:128. doi: 10.1186/1471-2105-9-128. [DOI] [PMC free article] [PubMed] [Google Scholar]
- Steger DJ, Lefterova MI, Ying L, Stonestrom AJ, Schupp M, Zhuo D, Vakoc AL, Kim JE, Chen J, Lazar MA, et al. DOT1L/KMT4 recruitment and H3K79 methylation are ubiquitously coupled with gene transcription in mammalian cells. Mol Cell Biol. 2008;28:2825–2839. doi: 10.1128/MCB.02076-07. [DOI] [PMC free article] [PubMed] [Google Scholar]
- Suzuki MM, Bird A. DNA methylation landscapes: Provocative insights from epigenomics. Nat Rev Genet. 2008;9:465–476. doi: 10.1038/nrg2341. [DOI] [PubMed] [Google Scholar]
- Taylor KH, Kramer RS, Davis JW, Guo J, Duff DJ, Xu D, Caldwell CW, Shi H. Ultradeep bisulfite sequencing analysis of DNA methylation patterns in multiple gene promoters by 454 sequencing. Cancer Res. 2007;67:8511–8518. doi: 10.1158/0008-5472.CAN-07-1016. [DOI] [PubMed] [Google Scholar]
- Waddington C. The epigenotype. Endeavour. 1942;1:18–20. [Google Scholar]
- Weber M, Davies JJ, Wittig D, Oakeley EJ, Haase M, Lam WL, Schubeler D. Chromosome-wide and promoter-specific analyses identify sites of differential DNA methylation in normal and transformed human cells. Nat Genet. 2005;37:853–862. doi: 10.1038/ng1598. [DOI] [PubMed] [Google Scholar]
- Wilson EB. Probable inference, the law of succession, and statistical inference. J Am Stat Assoc. 1927;22:209–212. [Google Scholar]
- Xiong Z, Laird PW. COBRA: A sensitive and quantitative DNA methylation assay. Nucleic Acids Res. 1997;25:2532–2534. doi: 10.1093/nar/25.12.2532. [DOI] [PMC free article] [PubMed] [Google Scholar]
- Zhang Y, Rohde C, Tierling S, Jurkowski TP, Bock C, Santacruz D, Ragozin S, Reinhardt R, Groth M, Walter J, et al. DNA methylation analysis of chromosome 21 gene promoters at single base pair and single allele resolution. PLoS Genet. 2009;5:e1000438. doi: 10.1371/journal.pgen.1000438. [DOI] [PMC free article] [PubMed] [Google Scholar]


