Abstract
We present the first Korean individual genome sequence (SJK) and analysis results. The diploid genome of a Korean male was sequenced to 28.95-fold redundancy using the Illumina paired-end sequencing method. SJK covered 99.9% of the NCBI human reference genome. We identified 420,083 novel single nucleotide polymorphisms (SNPs) that are not in the dbSNP database. Despite a close similarity, significant differences were observed between the Chinese genome (YH), the only other Asian genome available, and SJK: (1) 39.87% (1,371,239 out of 3,439,107) SNPs were SJK-specific (49.51% against Venter's, 46.94% against Watson's, and 44.17% against the Yoruba genomes); (2) 99.5% (22,495 out of 22,605) of short indels (< 4 bp) discovered on the same loci had the same size and type as YH; and (3) 11.3% (331 out of 2920) deletion structural variants were SJK-specific. Even after attempting to map unmapped reads of SJK to unanchored NCBI scaffolds, HGSV, and available personal genomes, there were still 5.77% SJK reads that could not be mapped. All these findings indicate that the overall genetic differences among individuals from closely related ethnic groups may be significant. Hence, constructing reference genomes for minor socio-ethnic groups will be useful for massive individual genome sequencing.
In 1977, the first full viral genome sequence was published (Sanger et al. 1977), and 3 yr later the same group (Anderson et al. 1981) sequenced the complete human mitochondrial genome. These early and subsequent genome projects lay the foundation for sequencing the first human genome that was completed in 2004 (International Human Genome Sequencing) (Lander et al. 2001; Venter et al. 2001; International Human Genome Sequencing Consortium 2004). Since then, we have seen astounding progress in sequencing technology which has opened a way for personal genomics (Church 2005; Shendure and Ji 2008; von Bubnoff 2008). The first personal genome (HuRef, Venter) was sequenced by the conventional Sanger dideoxy method, which is still the method of choice for de novo sequencing due to its long read-lengths of up to ∼1000 bp and per-base accuracies as high as 99.999% (Shendure and Ji 2008). Using this method, Levy et al. (2007) assembled diploid sequences with phase information that has not been performed in other genomes published. Despite limitations in read length, which is extremely important for the assembly of contigs and final genomes (Sundquist et al. 2007), it is the next-generation sequencing (NGS) technology that has made personal genomics possible by dramatically reducing the cost and increasing the efficiency (Mardis 2008; Shendure and Ji 2008). To date, at least four individual genome sequences, analyzed by NGS, have been published (Bentley et al. 2008; Ley et al. 2008; Wang et al. 2008; Wheeler et al. 2008). Using NGS for resequencing, researchers can simply map short read NGS data to known reference genomes, avoiding expensive and laborious long fragment based de novo assembly. As demonstrated by a large percentage of unmapped data in previous human genome resequencing projects, however, it should be noted that a resequenced genome may not fully reflect ethnic and individual genetic differences because its assembly is dependent on the previously sequenced genome. After the introduction of NGS, the genome sequencing bottleneck of a whole population or people is not the sequencing process itself, but the bioinformatics process of fast and accurate mapping to known data, structural variation analyses, phylogenetic analyses, association study, and application to phenotypes such as diseases.
The full analysis of a human genome is far from complete, contrary to the case of phi X 174 by the Sanger group in the 1970s. For example, the NCBI human reference genome, an essential tool for resequencing genome by NGS, does not reflect an ideal picture of a human genome in terms of the number of base pairs sequenced and of genes determined. Furthermore, in a recent study, it was reported that 13% of sequence reads were not mapped to the NCBI reference genome (Wang et al. 2008). This is one of the reasons the Korean reference genome construction project was initiated. Koreans and Chinese are thought to have originated from the same ancestors and admixed for thousands of years. Comparing the two genome scale variations in relation to other already known individual genomes has given us insight about how distinct they are from each other.
Here, we report SJK, the first full-length Korean individual genome sequence (SJK from Seong-Jin Kim, the genome donor), accompanied by genotype information of the donor and his mother. The SJK sequence was first released in December 2008 as the result of the Korean reference genome construction project and has been freely available at ftp://ftp.kobic.kr/pub/KOBIC-KoreanGenome/.
Results
Data production and mapping to the NCBI reference genome
The genomic DNA used in this study came from a male Korean. The blood sample was collected with informed consent. The cytogenetic analysis of the donor's peripheral blood lymphocytes, which was performed to check the structural suitability of his DNA as a reference genome at the chromosomal level, revealed a normal karyotype of 46, XY (Supplemental Fig. 1). We also acquired his genotyping results using Illumina 1M-duo and Affymetrix 6.0 single nucleotide polymorphism (SNP) chips. We constructed three paired-end libraries that had span sizes of 100, 200, and 300 bases. We generated 82.73 Gb of sequence (about 1248 million paired 36-base reads and about 504 million 75-base reads) (Table 1). Using the MAQ (Mapping and Assembly with Qualities) (Li et al. 2008) program, 82.73 Gb of sequence was aligned to the NCBI human genome reference (build 36, without Ns, 2,858,029,377 bp). In total, 99.9% of the NCBI reference genome was covered with a 25.92-fold average depth (sequencing depth was 28.95-fold); 5.97% of SJK (104,661,382 reads) were not mapped to the NCBI reference. Using MAQ, we mapped these reads to unanchored NCBI human scaffolds and the reported novel sequences of Venter's HuRef, Watson's, YH, and HGSV (Kidd et al. 2008). Compared to NCBI's, we found only 1.2% of unmapped reads were mapped (0.39% by Wang et al. [2008] using the YH genome). Overall, 96.59% of the 105 million reads could not be mapped to all the above known genomes. This does not mean that 5.77% (reduced from 5.97%) of the SJK sequencing reads account for ethnical or individual uniqueness, as there could be other factors affecting the mapping such as sequencing error or contamination (Supplemental Table 1).
Table 1.
Summary of data production and mapping to the NCBI reference genome
Using unmapped reads, we performed de novo assembly and sequence comparison with several databases. We selected a high-quality 24,618,280 from 41,242,033 reads of 75 bp in length, of which 539,873 (2.2%) were assembled into 28,696 contigs. Among the contigs, 3286 (11.5%) had significant homology with unanchored scaffolds in the NCBI reference genome. BLASTX analysis against mammalian proteins revealed that 91 contigs were homologous to human, 185 to chimpanzee, and 57 to mouse RefSeq protein sequences, with an E-value cut off of 0.0001.
SNP identification and comparison of individual genomes
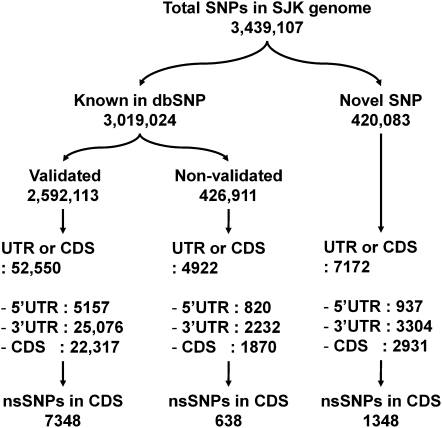
A total of 3,439,107 SNPs were identified in SJK; 3,019,024 SNP variants were found to be in silico concordant with dbSNP (2,592,113 as validated and 426,911 as nonvalidated SNPs), and the remaining 420,083 SNPs were novel (Fig. 1). The quantitative and qualitative evaluation of identified variants was carried out by comparing the overlap and uniqueness of those variants with known SNPs in dbSNP version 129. There was a high level of agreement of the SNP calling between genome sequencing and SNP genotyping results: 1,115,555 SNP calls (99.69%) from Illumina 1M-duo and 880,431 SNP calls (99.43%) from Affymetrix 6.0 were in agreement with the sequencing data (Table 2). We found 29 SJK-specific novel homozygous alleles, out of 3,439,107 SNPs, when we compared them with dbSNP entries and experimentally validated them using PCR amplification and Sanger dideoxy sequencing to see if they were from errors or not. Twenty-one out of 29 were experimentally validated. Eight of them were inconclusive as the experiments were not successful (Supplemental Table 2).
Figure 1.
Classification and number of intragenic SNPs. Intragenic SNPs identified in SJK were classified as known or novel according to their presence in dbSNP. Then, the SNPs were further classified based on their locations within genic regions. nsSNPs indicate nonsynonymous SNPs.
Table 2.
Experimental evaluation of SJK SNP calls using two genotyping chips
aHomozygous genotype for reference allele.
bHomozygous genotype different from reference allele.
cHeterozygous genotype with one reference allele.
dSNP genotypes that are not identical between the two chips were removed (1903 out of 300,139 common markers between the two chips).
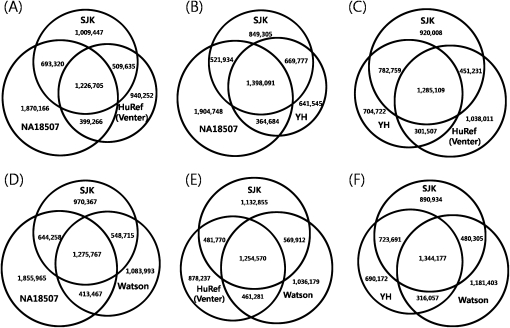
As for the validated SNPs, 52,550 were located in gene regions, 5157 in 5′ untranslated regions (UTRs), 25,076 in 3′ UTRs, and 22,317 in coding sequence (CDS) regions that contained 7348 nonsynonymous SNPs. As for the nonvalidated SNPs, 820 were located in 5′ UTRs, 2232 in 3′ UTRs, and 1870 in CDS regions. Six-hundred-thirty-eight nonsynonymous SNPs were found in the nonvalidated SNPs located in CDS. As for the novel variants (420,083), only 1.7% were located in the known genes: 937 variants were in 5′ UTRs, 3304 in 3′ UTRs, and 2931 in CDS regions that contained 1348 nonsynonymous SNPs (Fig. 1). The total number of nonsynonymous SNPs was 9334 in 5365 genes. The full list of nonsynonymous SNPs can be found in Supplemental Table 3. The SNPs of SJK were compared with those of HuRef (Venter), Watson, YH (Chinese), and NA18507 (Yoruba) (Fig. 2) (Levy et al. 2007; Bentley et al. 2008; Wang et al. 2008). SJK shared 60% of SNPs with the YH genome, 50% with the HuRef (Venter) genome, 53% with Watson genome, and 56% with the NA18507 (Yoruba) genome; the YH genome shared 52% with HuRef (Venter) genome, 54% with Watson genome, and 57% with NA18507 (Yoruba) genome; and HuRef (Venter) genome shared 56% with Watson genome and 53% with NA18507 (Yoruba) genome.
Figure 2.
Comparisons of SNPs among (A) SJK, NA18507 (Yoruba), and HuRef (Venter's); (B) SJK, NA18507, and YH (Chinese); (C) SJK, YH, and HuRef; (D) SJK, NA18507, and Watson; (E) SJK, HuRef, and Watson; and (F) SJK, YH, and Watson.
Indel detection and identification
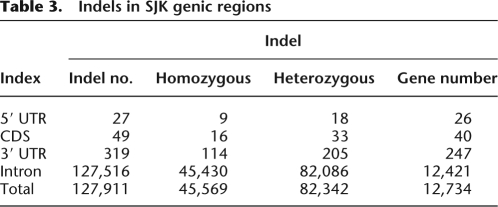
Using MAQ, we identified 342,965 short indels (−29 to +14 bp) (Supplemental Fig. 2). Indels that co-occurred within a window size of 20 bp were filtered out, since they were mostly from length polymorphisms in homopolymeric tracts of A or T. Examining the distribution of total indels that are associated with gene regions and repeat elements, we found that 127,911 indels were located within known genes. Using a protein-coding gene set from the UCSC genome browser database (Kuhn et al. 2009), we investigated the frequency of indels in CDSs, UTRs, and introns in SJK. Of the 342,965 indels detected, 37.3% were located in the intragenic regions, including 27 indels in 5′ UTRs, 319 in 3′ UTRs, 49 in CDS, and 127,516 in intron (Table 3). We selected nine coding-region indels and validated them (with 100% success) by using PCR amplification and Sanger dideoxy sequencing (Supplemental Table 4). For the 49 indels found in CDS, 27 genes were affected in their open reading frames with potentially disrupted protein functions.
Table 3.
Indels in SJK genic regions
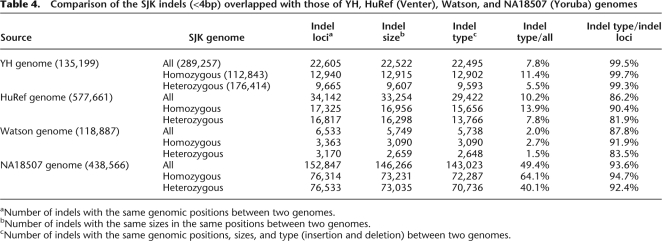
By examining indels identified in SJK against dbSNP, we found that only 247 indels (0.1%) were validated and 113,287 (33.0%) were nonvalidated. The remaining 229,431 (66.9%) indels were not found in dbSNP. This is probably because indels are underrepresented in dbSNP, even though they are important genomic variations. Table 4 summarizes indel patterns of SJK, YH, HuRef (Venter), Watson, and NA18507 genomes. SJK shared 11.4% homozygous and 5.5% heterozygous short indels with YH, 13.9% homozygous and 7.8% heterozygous indels with HuRef, 2.7% homozygous and 1.5% heterozygous indels with Watson, 64.1% homozygous and 40.1% heterozygous with NA18507. YH and SJK showed the highest level of commonality in indel size and type as expected (99.5% identity). Compared with NA18507, SJK shared with 143,023 (49.4%) indels of the same loci, size, and type. This percentage is much higher than that shared by YH (7.8%), HuRef (10.2%), or Watson (2.0%). This discrepancy seems to result from the method used rather than from the ethnic similarities between SJK and NA18507 (i.e., because paired-end sequencing was used for SJK and NA18507). Of note is that all pairwise comparisons between genomes are relative to the NCBI reference genome. This may partially explain why HuRef and Watson, which are Caucasian as the NCBI reference, have lower levels (86.2% and 87.8%) of common indels against SJK.
Table 4.
Comparison of the SJK indels (<4bp) overlapped with those of YH, HuRef (Venter), Watson, and NA18507 (Yoruba) genomes
aNumber of indels with the same genomic positions between two genomes.
bNumber of indels with the same sizes in the same positions between two genomes.
cNumber of indels with the same genomic positions, sizes, and type (insertion and deletion) between two genomes.
Size distribution of indels in SJK
Short indels, with 62.6% being single nucleotide changes, predominated in SJK (Supplemental Fig. 2). We found that indels were distributed throughout the human genome at an average density of one indel per 9 kb.
Detection and identification of structural variants
Using paired-end reads, we found 2920 deletions and 415 inversion structural variants (SVs) in the range of 0.1∼100 kb (Supplemental Table 5).
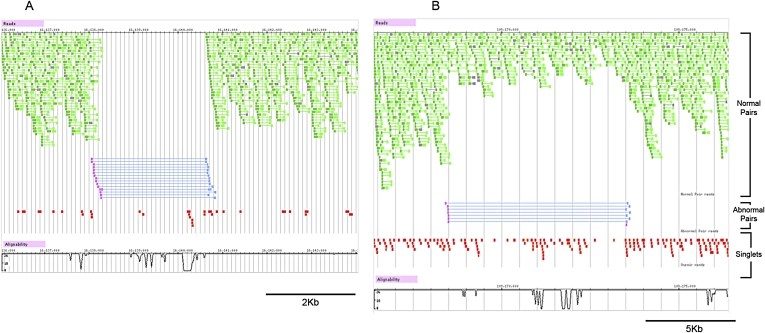
Figure 3 illustrates the patterns of genomic deletions in SJK. Among the total deletion variants, 2344 (80.3%) were found in DGV (Database of Genomic Variants) (Iafrate et al. 2004), 1775 (60.8%) were shared with the YH genome, 680 (23.3%) were shared with the HuRef genome, 958 (32.8%) were shared with the Watson genome, and 792 (27.1%) were shared with the NA18507 (Yoruba) genome. Three-hundred-thirty-one (11.3%) were SJK-specific novel SVs that did not overlap with DGV, YH, or HuRef genomes. Supplemental Figure 3 summarizes the size distribution and repeat composition of deletion variants. This shows two relative enrichment events in the ranges of 300–400 bp and 6–7 kb in length, as the insertion polymorphism of short interspersed nuclear elements (SINEs) and long interspersed nuclear elements (LINEs), respectively. We found deletion SVs in 21 coding genes (AP3S1, BCLAF1, C1orf62, CACNA1B, CDC27, COL22A1, FAM104B, HYDIN, IRAK2, KIAA1881, MUC21, MUC6, OVCH2, PCDHA4, PDE4DIP, PRKG1, PRKRA, SETD8, SLC36A3, TDG, and ZNF717), which may disrupt normal protein structures and functions. In addition, we detected 963 insertion events in the range of 175∼250 bp. These insertions are present in the SJK genome but absent in the NCBI reference genome.
Figure 3.
Homo- and heterozygous deletions in SJK genome detected by anomalously spaced read pairs. (A) Homozygous 2.3-kb genomic deletion; (B) heterozygous 5-kb genomic deletion. Pink and blue bars, large deletions detected by anomalously spaced read pairs; green bars, regularly spaced read pairs mapped by the ungapped alignment algorithm in MAQ; gray bars, regularly spaced read pairs mapped by Smith-Waterman gapped alignment algorithm in MAQ; and red bars, singletons (reads without mate pairs).
Genetic ancestry of the SJK donor
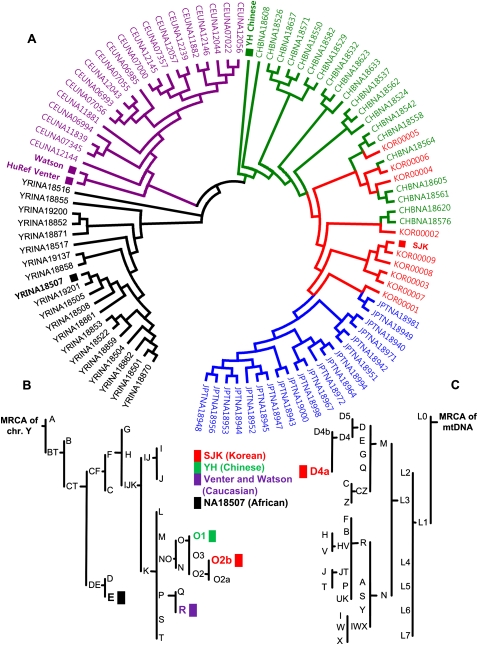
Three types of lineage SNP markers on mitochondrial DNA (mtDNA), chromosome Y, and autosome clearly indicated that SJK belongs to well-established Korean lineages (Fig. 4; Supplemental Table 6): (1) Observed Y chromosomal SNPs were annotated as markers for the “O2b” subhaplogroup (Karafet et al. 2001). The O2b subgroup is prominent in Korea, Japan, and Manchuria. (2) Fifteen mtDNA variations were annotated as the marker of “D4” haplogroup, which is prevalent in Korea (Umetsu et al. 2005; Lee et al. 2006). (3) A phylogenic tree drawn with 31,460 autosomal common SNPs within 93 individuals indicated that SJK has a common Korean autosomal makeup.
Figure 4.
SJK's genetic lineage. (A) Autosomal phylogenic tree. The sample, KOR00009, is SJK's mother. Colors indicate populations: black, YRI (Yoruba in Ibadan, Nigeria); blue, JPT (Japanese in Tokyo, Japan); green, CHB (Han Chinese in Beijing, China); red, KOR (Korean in South Korea); and violet, CEU (Utah residents with northern and western European ancestry from the CEPH collection). (B) Chromosome Y haplogroup lineage. Personal genome abbreviations and subhaplogroup information: E (E3b, NA18507: Yoruba), R (R1b*, HuRef (Venter): Caucasian), R (R1 (or P), James Watson: Caucasian), O2b (SJK: Korean), and O1 (O1a, YH genome: Han Chinese), (C) SJK's mtDNA ethno-geographic lineage. Only the mtDNA of SJK was annotated.
mtDNA analysis
We mapped the entire mitochondrial genome of SJK with an average of ∼16,356-fold depth based on rCRS (revised Cambridge Reference Sequence). The SJK mtDNA average depth was much higher than that of a nuclear genome, since a human cell contains hundreds of copies of mtDNA. To examine mtDNA sequencing quality, we compared the base composition of the SJK mtDNA genome with that of rCRS, which revealed similar patterns (56% of AT content for SJK and 55.6% for rCRS) (Supplemental Table 7). The SJK mitochondrial genome did not contain deleterious stop codons in its 37 genes (two ribosomal RNAs, 22 tRNAs, and 13 protein-coding genes) (Supplemental Table 8). We found 44 novel SNPs by comparing SNPs with rCRS. Three insertions and one deletion were detected with nine nonsynonymous SNPs (Supplemental Table 9).
Discussion
In the present study, we identified 3.4 million SNPs, out of which over 0.4 million (12.2%) SNPs were found to be novel. Although the first Asian genome based on the genome sequencing of a Han Chinese was recently reported (Wang et al. 2008), various SNP studies have shown that ethnic groups in Asia, including the Chinese, the Japanese, and the Korean, have genetically diverged relatively recently (Karafet et al. 2001; Jin et al. 2003, 2009; Hammer et al. 2006). As shown in Figure 2, SJK shares more SNPs with YH than against Caucasian and Yoruba genomes, HuRef (Venter), Watson, and NA18507 (Yoruba). However, there is still the significant genetic difference of more than 1.3 million SNPs (∼40% of the total SNPs) between the two individuals (SJK and YH). In addition, the comparison of indels between SJK and YH (Table 4) showed that the two genomes shared the same type of indels by 99.5% on the same genomic loci (SJK and HuRef shared 86.2%, SJK and Watson shared 87.8%, SJK and NA18507 shared 93.6%). In terms of structural variation, large deletions (100 bp∼100 kbp) were shared by 60.8% (1775 out of 2920) between SJK and YH. This overlap is more than two times the overlaps between SJK and the others (Venter: 23.3%, Watson: 32.8%, and NA18507: 27.1%). Of particular note, 5.97% of sequence reads from our data was not mapped to the NCBI reference genome. Even after attempting to map unmapped reads of SJK to unanchored NCBI scaffolds, HGSV, and available personal genomes, still 5.77% of sequence reads was not mapped, which may be influenced by several factors: (1) genetic difference between different ethnic groups may affect the mapping efficiency; (2) differences among individuals of the same ethnic origin may be large enough to cause a relatively large percentage of sequencing reads to remain unmapped; and (3) different sequencing methods (i.e., different read lengths, error rates, and data quality) and mapping methods may impact the analysis. It will take a large number of personal genomes to estimate the ethnic distinction between closely related populations. However, the above interpersonal genome differences and the amount of unmapped sequence reads may indicate that building reference genomes for populations can be useful in reducing the cost and time in mapping and analyzing very large numbers of personal genomes.
Perspectives
SJK is another demonstration of the importance of inexpensive complete human genome sequencing. The amount of SNP information we have extracted in the last 6 mo is many times more than all the Korean SNPs mapped in the past years. Despite advantages in cost and efficiency, resequencing has a limitation in building a truly diploid reference genome representing more accurate individual and ethnic differences. For a truly diploid reference, SJK will be further analyzed by the combination of conventional de novo genome assembly and targeted gap filling.
Methods
DNA extraction, library preparation, and massively parallel sequencing
Genomic DNA (gDNA) was extracted from whole blood with a QIAamp DNA blood kit according to the manufacturer's instructions (Qiagen).
Libraries were prepared according to the manufacturer's instructions (Illumina). Briefly, 5 μg of gDNA in 200 μL of nuclease free water was fragmented by bioruptor (Diagenode) at high power for 30 min. (30 sec on and 30 sec off). Overhangs of fragmented gDNA were converted to blunt ends using T4 DNA ligase and Klenow enzyme. Subsequently, an A base was added to the ends of double-stranded DNA using Klenow exo (3′ to 5′ exo minus). The paired end adaptor (Illumina) with a single T base overhang at the 3′ end was ligated to the above products. The PE adaptor ligated products were separated on a 2% agarose gel and excised from the gel at positions approximately for span size ranges (100 bp, 200 bp, and 300 bp). Size-selected DNA fragments were enriched by PCR with PE primers 1.1 and 2.1 (Illumina). The concentration of libraries was measured by both nanodrop (Thermo) and Qubit IT (Invitrogen). Finally, the libraries were validated by Experion (Bio-Rad). The gDNA library was sequenced using the Illumina 1G genome analyzer according to the manufacturer's instructions.
Short read alignment
We used a fast short read alignment program, MAQ (version 0.7) with default parameters. MAQ utilizes the read-pair information of paired-end reads. Using the read-pair information, MAQ corrects wrong alignments, adds confidence to correct alignments, and accurately maps reads to repetitive sequences if their mate pairs are confidently aligned.
Calling SNPs
Using MAQ, we aligned short reads to the NCBI reference genome and produced a consensus genotype sequence from the alignment. The options used for SNP calling were: minimum four read depth (-d 4), maximum depth (-D 100) to filter out randomly placed repetitive hits, consensus quality (Q20), adjacent sequence quality (Q20), and no SNP call if any indel occurred in the 3-bp flanking region.
De novo assembly of unmapped reads and mapping assembled contigs
Velvet version 0.7.27 (Zerbino and Birney 2008) was used to assemble unmapped reads into contigs with hash length 25, coverage cutoff 2, and minimum contigs length 100.
Among 41.2 million unmapped 75-bp reads, we selected 24.6 million high-quality reads. We filtered out low quality reads with total scores below 1500 or reads with N.
Assembled contigs were aligned against the unanchored scaffolds of NCBI build 36 to find homologous sequence regions using the BLAT alignment algorithm (Kent 2002). Before the alignment, the repeat sequences of contigs were masked by RepeatMasker (http://www.repeatmasker.org/). To select significantly homologous alignments, thresholds with >95% identity and >80% coverage of contigs were used as thresholds.
We performed a BLASTX alignment against the NCBI RefSeq protein database of human (NCBI build 36, 37,742 proteins), chimpanzee (NCBI build 2, 51,947 proteins), and mouse (NCBI build 37, 34,966 proteins). Hits with E-value < 0.0001, percentage identity > 40%, and protein coverage > 40% were used as significance thresholds.
Detection of short indels
We called short indels (from 29-bp deletion to 14-bp insertion) by using the MAQ paired-end indel detection method. Short indels were confirmed when they were identified in both strands with a minimum of three reads. When more than one indel candidates co-occurred in a window size of 20 bp, they were filtered out because alignment errors were found to represent most cases.
Detection of SVs
We detected SVs based on span size and orientation information of each paired-end read. Paired-end reads with an anomalously long span size (more than double the average span size of each DNA library) were identified as SV candidates (deletion and inversion), especially when they had a minimum of three reads in the region, maximum 100 read depth and mapping quality (Q20). SV candidates either found in repeat regions of the genome or having more than 100 kb of genomic deletions were filtered out. For insertion detection larger than the short indels (−29 to +14 bp), the longest 300-bp span size of our paired-end libraries was used. Thus, we could fill 175-bp to 250-bp insert gaps between short inserts and large inserts. The criteria used for detecting these insertions absent from the reference genome in the range of 175∼250 bp were minimum four read depth, maximum 60 read depth to filter out randomly placed hits in a repetitive structure region, and mapping quality (Q20).
Genetic ancestry
The chromosome Y haplotype data from the Y Chromosomal Consortium (YCC) were used for the paternal lineage analysis. The mtDNA sequence was aligned with rCRS (revised Cambridge Reference Sequence of the human mtDNA) (Andrews et al. 1999), and identified variations were mapped to a MitoVariome set (http://variome.kobic.re.kr/MitoVariome), which is an extended set of Mitomap (Brandon et al. 2005). The haplogroup-diagnostic nucleotide sequence variants were assembled from reference information (Kong et al. 2006). To make an autosomal phylogenic tree, allele sharing distance (ASD) and neighbor joining (NJ) methods were used (Saitou and Nei 1987; Bowcock et al. 1994; Mountain and Cavalli-Sforza 1997). Four personal genomes, Watson, HuRef (Venter), YH (Han Chinese), and SJK, were used with HapMap Phase III samples of four populations, YRI (Yoruba), CHB (Chinese), CEU (Caucasian), and JPT (Japanese). HapMap samples had no relationship within them. Eight randomly chosen Koreans and the donor's mother were genotyped with an Illumina 1M bead array. To calculate ASD, the proportion (Pi) of shared alleles between individuals was estimated by
where the number of shared alleles S is added over all loci u, and distance between individuals (Di) is estimated by
Phylogenic analyses were conducted in MEGA4 (Tamura et al. 2007).
Data sources
The NCBI human reference genome, NCBI reference gene information, and dbSNP version 129 were obtained from the UCSC database (http://genome.ucsc.edu/), which provides the gene information mapped on the NCBI build 36.1. The HuRef (Venter) variants were downloaded from the public FTP site of JCVI (ftp://ftp.jcvi.org/pub/data/huref/), YH variants were downloaded from BGI (http://yh.genomics.org.cn), and NA18507 (Yoruba) variants and novel contigs of Watson were provided by Illumina Cambridge Ltd. and Baylor College of Medicine, respectively.
SNP annotation methods
SNPs on the SJK genome were compared with NCBI dbSNP version 129 to separate known and novel SNPs after filtering of MAQ-generated SNP calls that had more than four reads. Then, each SNP was mapped on the genomic features of the UCSC gene table such as transcription, UTR, and coding regions. Nonsynonymous SNP information was extracted by comparing UCSC reference gene information.
Cytogenetic analysis
Chromosomal analysis was carried out with cultured peripheral blood lymphocytes using standard techniques and GTG banding. A heparinized peripheral blood sample was collected and cultured for 72 h in RPMI-1640 medium supplemented with phytohemagglutinin and fetal bovine serum. More than 20 metaphases were analyzed.
Acknowledgments
This work was supported by a grant from the KRIBB Research Initiative Program of Korea, by the Korea Science and Engineering Foundation (KOSEF) grant funded by the Korean government (MOST), by a KOSEF grant (no. R11-2008-044-03004-0, S.M.A.), by a grant from the Innovative Research Institute for Cell Therapy (A062260, J.Y.C.), by a grant from the Ministry of Knowledge Economy (Standard Reference Data Program), and by generous funding from Gachon University of Medicine and Science and Gachon University Gil Hospital. We thank Ryu Gichan for crucial administration assistance, Byun Hana for web design, Ryu Jeawoon and Cho Suan for web application, and Maryana Bhak for editing.
Footnotes
[Supplemental material is available online at http://www.genome.org. The sequence data from this study are available at ftp://ftp.kobic.kr/pub/KOBIC-KoreanGenome/ and have been deposited in the NCBI Short Read Archive (http://www.ncbi.nlm.nih.gov/Traces/sra/sra.cgi) under accession no. SRA008175.]
Article published online before print. Article and publication date are at http://www.genome.org/cgi/doi/10.1101/gr.092197.109.
References
- Anderson S, Bankier AT, Barrell BG, de Bruijn MH, Coulson AR, Drouin J, Eperon IC, Nierlich DP, Roe BA, Sanger F, et al. Sequence and organization of the human mitochondrial genome. Nature. 1981;290:457–465. doi: 10.1038/290457a0. [DOI] [PubMed] [Google Scholar]
- Andrews RM, Kubacka I, Chinnery PF, Lightowlers RN, Turnbull DM, Howell N. Reanalysis and revision of the Cambridge reference sequence for human mitochondrial DNA. Nat Genet. 1999;23:147. doi: 10.1038/13779. [DOI] [PubMed] [Google Scholar]
- Bentley DR, Balasubramanian S, Swerdlow HP, Smith GP, Milton J, Brown CG, Hall KP, Evers DJ, Barnes CL, Bignell HR, et al. Accurate whole human genome sequencing using reversible terminator chemistry. Nature. 2008;456:53–59. doi: 10.1038/nature07517. [DOI] [PMC free article] [PubMed] [Google Scholar]
- Bowcock AM, Ruiz-Linares A, Tomfohrde J, Minch E, Kidd JR, Cavalli-Sforza LL. High resolution of human evolutionary trees with polymorphic microsatellites. Nature. 1994;368:455–457. doi: 10.1038/368455a0. [DOI] [PubMed] [Google Scholar]
- Brandon MC, Lott MT, Nguyen KC, Spolim S, Navathe SB, Baldi P, Wallace DC. MITOMAP: A human mitochondrial genome database: 2004 update. Nucleic Acids Res. 2005;33:D611–D613. doi: 10.1093/nar/gki079. [DOI] [PMC free article] [PubMed] [Google Scholar]
- Church GM. The personal genome project. Mol Syst Biol. 2005;1:2005.0030. doi: 10.1038/msb4100040. [DOI] [PMC free article] [PubMed] [Google Scholar]
- Hammer MF, Karafet TM, Park H, Omoto K, Harihara S, Stoneking M, Horai S. Dual origins of the Japanese: Common ground for hunter-gatherer and farmer Y chromosomes. J Hum Genet. 2006;51:47–58. doi: 10.1007/s10038-005-0322-0. [DOI] [PubMed] [Google Scholar]
- Iafrate AJ, Feuk L, Rivera MN, Listewnik ML, Donahoe PK, Qi Y, Scherer SW, Lee C. Detection of large-scale variation in the human genome. Nat Genet. 2004;36:949–951. doi: 10.1038/ng1416. [DOI] [PubMed] [Google Scholar]
- International Human Genome Sequencing Consortium. Finishing the euchromatic sequence of the human genome. Nature. 2004;431:931–945. doi: 10.1038/nature03001. [DOI] [PubMed] [Google Scholar]
- Jin HJ, Kwak KD, Hammer MF, Nakahori Y, Shinka T, Lee JW, Jin F, Jia X, Tyler-Smith C, Kim W. Y-chromosomal DNA haplogroups and their implications for the dual origins of the Koreans. Hum Genet. 2003;114:27–35. doi: 10.1007/s00439-003-1019-0. [DOI] [PubMed] [Google Scholar]
- Jin HJ, Tyler-Smith C, Kim W. The peopling of Korea revealed by analyses of mitochondrial DNA and Y-chromosomal markers. PLoS One. 2009;4:e4210. doi: 10.1371/journal.pone.0004210. [DOI] [PMC free article] [PubMed] [Google Scholar]
- Karafet T, Xu L, Du R, Wang W, Feng S, Wells RS, Redd AJ, Zegura SL, Hammer MF. Paternal population history of East Asia: Sources, patterns, and microevolutionary processes. Am J Hum Genet. 2001;69:615–628. doi: 10.1086/323299. [DOI] [PMC free article] [PubMed] [Google Scholar]
- Kent WJ. BLAT: The BLAST-like alignment tool. Genome Res. 2002;12:656–664. doi: 10.1101/gr.229202. [DOI] [PMC free article] [PubMed] [Google Scholar]
- Kidd JM, Cooper GM, Donahue WF, Hayden HS, Sampas N, Graves T, Hansen N, Teague B, Alkan C, Antonacci F, et al. Mapping and sequencing of structural variation from eight human genomes. Nature. 2008;453:56–64. doi: 10.1038/nature06862. [DOI] [PMC free article] [PubMed] [Google Scholar]
- Kong QP, Bandelt HJ, Sun C, Yao YG, Salas A, Achilli A, Wang CY, Zhong L, Zhu CL, Wu SF, et al. Updating the East Asian mtDNA phylogeny: A prerequisite for the identification of pathogenic mutations. Hum Mol Genet. 2006;15:2076–2086. doi: 10.1093/hmg/ddl130. [DOI] [PubMed] [Google Scholar]
- Kuhn RM, Karolchik D, Zweig AS, Wang T, Smith KE, Rosenbloom KR, Rhead B, Raney BJ, Pohl A, Pheasant M, et al. The UCSC Genome Browser Database: Update 2009. Nucleic Acids Res. 2009;37:D755–D761. doi: 10.1093/nar/gkn875. [DOI] [PMC free article] [PubMed] [Google Scholar]
- Lander ES, Linton LM, Birren B, Nusbaum C, Zody MC, Baldwin J, Devon K, Dewar K, Doyle M, FitzHugh W, et al. Initial sequencing and analysis of the human genome. Nature. 2001;409:860–921. doi: 10.1038/35057062. [DOI] [PubMed] [Google Scholar]
- Lee HY, Yoo JE, Park MJ, Chung U, Kim CY, Shin KJ. East Asian mtDNA haplogroup determination in Koreans: Haplogroup-level coding region SNP analysis and subhaplogroup-level control region sequence analysis. Electrophoresis. 2006;27:4408–4418. doi: 10.1002/elps.200600151. [DOI] [PubMed] [Google Scholar]
- Levy S, Sutton G, Ng PC, Feuk L, Halpern AL, Walenz BP, Axelrod N, Huang J, Kirkness EF, Denisov G, et al. The diploid genome sequence of an individual human. PLoS Biol. 2007;5:e254. doi: 10.1371/journal.pbio.0050254. [DOI] [PMC free article] [PubMed] [Google Scholar]
- Ley TJ, Mardis ER, Ding L, Fulton B, McLellan MD, Chen K, Dooling D, Dunford-Shore BH, McGrath S, Hickenbotham M, et al. DNA sequencing of a cytogenetically normal acute myeloid leukaemia genome. Nature. 2008;456:66–72. doi: 10.1038/nature07485. [DOI] [PMC free article] [PubMed] [Google Scholar]
- Li H, Ruan J, Durbin R. Mapping short DNA sequencing reads and calling variants using mapping quality scores. Genome Res. 2008;18:1851–1858. doi: 10.1101/gr.078212.108. [DOI] [PMC free article] [PubMed] [Google Scholar]
- Mardis ER. Next-generation DNA sequencing methods. Annu Rev Genomics Hum Genet. 2008;9:387–402. doi: 10.1146/annurev.genom.9.081307.164359. [DOI] [PubMed] [Google Scholar]
- Mountain JL, Cavalli-Sforza LL. Multilocus genotypes, a tree of individuals, and human evolutionary history. Am J Hum Genet. 1997;61:705–718. doi: 10.1086/515510. [DOI] [PMC free article] [PubMed] [Google Scholar]
- Saitou N, Nei M. The neighbor-joining method: A new method for reconstructing phylogenetic trees. Mol Biol Evol. 1987;4:406–425. doi: 10.1093/oxfordjournals.molbev.a040454. [DOI] [PubMed] [Google Scholar]
- Sanger F, Air GM, Barrell BG, Brown NL, Coulson AR, Fiddes CA, Hutchison CA, Slocombe PM, Smith M. Nucleotide sequence of bacteriophage ΦX174 DNA. Nature. 1977;265:687–695. doi: 10.1038/265687a0. [DOI] [PubMed] [Google Scholar]
- Shendure J, Ji H. Next-generation DNA sequencing. Nat Biotechnol. 2008;26:1135–1145. doi: 10.1038/nbt1486. [DOI] [PubMed] [Google Scholar]
- Sundquist A, Ronaghi M, Tang H, Pevzner P, Batzoglou S. Whole-genome sequencing and assembly with high-throughput, short-read technologies. PLoS One. 2007;2:e484. doi: 10.1371/journal.pone.0000484. [DOI] [PMC free article] [PubMed] [Google Scholar]
- Tamura K, Dudley J, Nei M, Kumar S. MEGA4: Molecular Evolutionary Genetics Analysis (MEGA) software version 4.0. Mol Biol Evol. 2007;24:1596–1599. doi: 10.1093/molbev/msm092. [DOI] [PubMed] [Google Scholar]
- Umetsu K, Tanaka M, Yuasa I, Adachi N, Miyoshi A, Kashimura S, Park KS, Wei YH, Watanabe G, Osawa M. Multiplex amplified product-length polymorphism analysis of 36 mitochondrial single-nucleotide polymorphisms for haplogrouping of East Asian populations. Electrophoresis. 2005;26:91–98. doi: 10.1002/elps.200406129. [DOI] [PubMed] [Google Scholar]
- Venter JC, Adams MD, Myers EW, Li PW, Mural RJ, Sutton GG, Smith HO, Yandell M, Evans CA, Holt RA, et al. The sequence of the human genome. Science. 2001;291:1304–1351. doi: 10.1126/science.1058040. [DOI] [PubMed] [Google Scholar]
- von Bubnoff A. Next-generation sequencing: The race is on. Cell. 2008;132:721–723. doi: 10.1016/j.cell.2008.02.028. [DOI] [PubMed] [Google Scholar]
- Wang J, Wang W, Li R, Li Y, Tian G, Goodman L, Fan W, Zhang J, Li J, Zhang J, et al. The diploid genome sequence of an Asian individual. Nature. 2008;456:60–65. doi: 10.1038/nature07484. [DOI] [PMC free article] [PubMed] [Google Scholar]
- Wheeler DA, Srinivasan M, Egholm M, Shen Y, Chen L, McGuire A, He W, Chen YJ, Makhijani V, Roth GT, et al. The complete genome of an individual by massively parallel DNA sequencing. Nature. 2008;452:872–876. doi: 10.1038/nature06884. [DOI] [PubMed] [Google Scholar]
- Zerbino DR, Birney E. Velvet: Algorithms for de novo short read assembly using de Bruijn graphs. Genome Res. 2008;18:821–829. doi: 10.1101/gr.074492.107. [DOI] [PMC free article] [PubMed] [Google Scholar]


