
Figure 5.
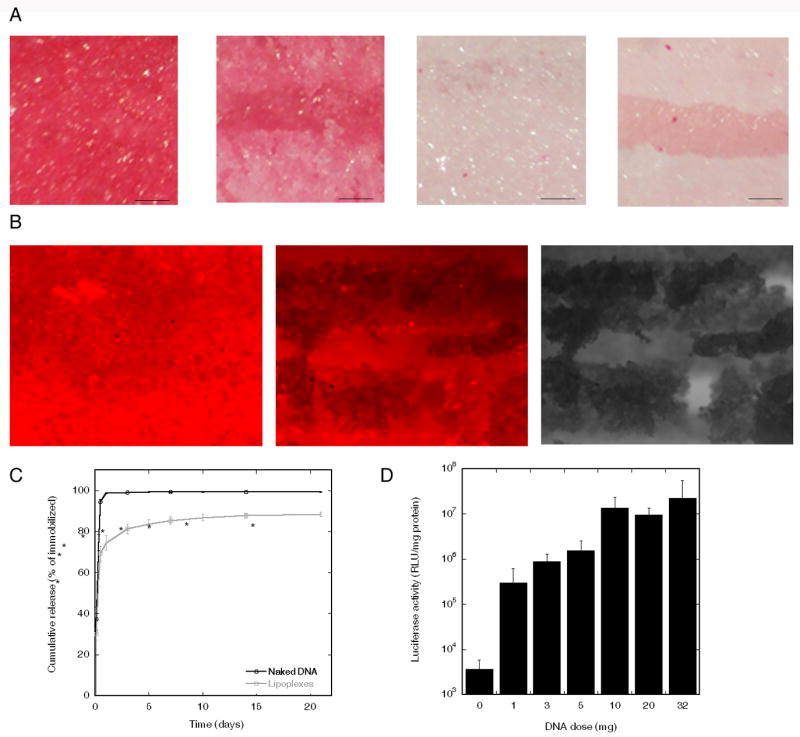
ECM and complex deposition and transfection on bridges. (A) Sirius red stain of fibronectin coated multiple channel bridges. From left to right: top view and cross section of bridge coated with 24 μg fibronectin, and top view and cross-section of uncoated bridge. Scale bar: 150 μm. (B) Bridge coated with 24 μg fibronectin and incubated with 1 μg fluorescently tagged DNA (red). From left to right: top view and cross section of bridge imaged with fluorescence microscopy, and cross section bridge imaged with phase contrast microscopy, Scale bar: 200 μm. (C) Release of uncomplexed and complexed DNA. Significant differences based on a t-test are denoted by an asterisk (p<0.05). (D) Transgene expression in vitro for different doses of DNA incubated with fibronectin coated bridges.