

Abstract
A subset of ganglion cells in the mammalian retina express the photopigment melanopsin and are intrinsically photosensitive (ipRGCs). These cells are implicated in non-image-forming visual responses to environmental light, such as the pupillary light reflex, seasonal adaptations in physiology, photic inhibition of nocturnal melatonin release, and modulation of sleep, alertness, and activity. Morphological studies have confirmed the existence of at least three distinct subpopulations of ipRGCs, but studies of the physiology of ipRGCs at the single cell level have focused mainly on M1 cells, the dendrites of which stratify solely in sublamina a (OFF sublamina) of the retinal inner plexiform layer (IPL). Little work has been done to compare the functional properties of M1 cells to those of M2 cells, the dendrites of which stratify solely in sublamina b (ON sublamina) of the IPL. The goal of the current study was to compare the morphology, intrinsic light response, and intrinsic membrane properties of M1 and M2 cells in the mouse retina. Here we demonstrate additional morphological differences between M1 and M2 cells as well as distinct physiological characteristics of both the intrinsic light responses and intrinsic membrane properties. M2 cells displayed a more complex dendritic arborization and higher input resistance, yet showed lower light sensitivity and lower maximal light responses than M1 cells. These data indicate morphological and functional heterogeneity among ipRGCs.
Keywords: intrinsically photosensitive ganglion cell, circadian entrainment, melanopsin, patch clamp, retina, dendritic arborization, dendrite
Introduction
Retinal ganglion cells (RGCs) in the mammalian retina expressing the photopigment melanopsin comprise a distinct subpopulation of RGCs and are intrinsically photosensitive (ipRGCs) (Berson et al., 2002; Hattar et al., 2002). These ipRGCs project to several brain areas, including the suprachiasmatic nuclei (SCN) of the hypothalamus, which drive the mammalian circadian rhythm, and the olivary pretectal nuclei (OPN), which control the pupillary light reflex (Hattar et al., 2006). These cells are now thought to be the sole pathway through which non-image-forming visual responses are conveyed to both the SCN and OPN (Güler et al., 2008; Hatori et al., 2008). Previous work has identified at least three morphologically distinct subpopulations of ipRGCs: those that stratify solely in sublamina a (OFF sublamina) of the retinal inner plexiform layer (IPL), termed M1 (or type I), those that stratify solely in sublamina b (ON sublamina) of the IPL, termed M2 (or type II), and those that bistratify in both the a and b sublaminas of the IPL, termed type III (Hattar et al., 2006; Viney et al., 2007; Baver et al., 2008; Schmidt et al., 2008). Furthermore, previous research has indicated that M1 cells form the primary projection to the SCN (80% M1/20% M2), while M1 and M2 cells project to the OPN in approximately equivalent proportions (45% M1/55% M2) (Baver et al., 2008).
Calcium imaging and multielectrode array (MEA) recordings from adult ipRGCs in the whole-mount retina have demonstrated diversity in their intrinsic light responses (Sekaran et al., 2003; Tu et al., 2005). However, whole-cell recordings of intrinsic light responses from ipRGCs either have mainly been made from ipRGCs retrogradely labeled from the SCN, a population consisting mainly of M1 cells (Berson et al., 2002; Baver et al., 2008), or have not been separately considered based on morphological subtype (Schmidt et al., 2008). Thus the physiological diversity in the intrinsic ipRGC light responses demonstrated using extracellular recording techniques remains untested at the single cell level. Because these cells are the sole pathway for non-image-forming visual responses to the brain and because of the specificity of projections to different brain areas, a deeper understanding of the physiology of the different morphological subpopulations of ipRGCs is critical to understanding how these cells signal light information to the non-image-forming centers of the brain (Güler et al., 2008; Hatori et al., 2008).
The goal of the current study was to use a transgenic mouse model in which ipRGCs are labeled in vivo with EGFP (Schmidt et al., 2008) to determine what, if any, physiological diversity in the intrinsic light response or intrinsic membrane properties may underlie the previously identified morphological diversity in the ipRGC population. In this paper, we identify stark differences in the dendritic arbor complexity, light response characteristics, light sensitivity, and intrinsic membrane properties of M1 and M2 cells, highlighting major physiological and additional morphological diversity within the ipRGC population.
Materials and Methods
Animals.
Recordings were performed on postnatal day 22 (P22)–P40 animals from the Opn4-EGFP mouse line described previously (Schmidt et al., 2008). Animals were cared for in accordance with guidelines described in Guide for the Care and Use of Laboratory Animals, using protocols approved by the University of Minnesota Institutional Care and Use Committee.
Electrophysiology.
Dissections were performed as described previously (Schmidt et al., 2008) (supplemental Methods, available at www.jneurosci.org as supplemental material). Recordings were performed using an Axon 700B Amplifier (Molecular Devices) with extracellular solution containing 95% O2–5% CO2 bicarbonate buffered Ames' solution (Sigma) at 32–34°C. For current-clamp recordings, pipettes were filled with (in mm) the following: 125 K-gluconate, 2 CaCl2, 2 MgCl2, 10 EGTA, 10 HEPES, 0.5 NaGTP, and 2 Na2ATP, pH to 7.2 with KOH. For voltage-clamp recordings, pipettes were filled with (in mm) the following: 125 Cs-methanesulfonate, 10 CsCl2, 5 EGTA, 1 MgCl2, 2 Na2ATP, 10 NaHEPES, 10 phosphocreatine, 2 QX-314, and 0.5 NaGTP, pH to 7.6 with KOH. Intracellular solutions also contained 10 μm Alexa Fluor-594 hydrazide (AF-594) (Invitrogen), and dendritic stratification was classified by focusing in the proximal and distal layers of the IPL. (More electrophysiology and analysis can be found in supplemental Methods, available at www.jneurosci.org as supplemental material.)
Immunocytochemistry.
Immunocytochemistry, Neurobiotin filling, and image analysis of retinas were performed as published previously (Schmidt et al., 2008) (supplemental Methods, available at www.jneurosci.org as supplemental material).
Pharmacology.
Synaptic blocker mixture included the following: 250 μm dl-2-amino-4-phosphonobutyrate (dl-AP4, a group III metabotropic glutamate receptor agonist); 10 μm 6,7-dinitroquinoxaline (DNQX, AMPA/kainate receptor antagonist); 0.3 μm strychnine (glycine receptor antagonist); and 50 μm picrotoxin (GABA receptor antagonist). Extracellular solution sometimes also included 0.5 μm tetrodotoxin (TTX, sodium channel blocker). In some experiments, 200 μm hexamethonium bromide (nACh receptor antagonist) (MP Biomedicals), 100 μm carbenoxolone (gap junction antagonist), and 2 mm cobalt chloride (to block all synaptic transmission) were included in the mixture with all of the above blockers. dl-AP4, DNQX, and TTX were purchased from Tocris. Picrotoxin, carbenoxolone, cobalt chloride, and strychnine were purchased from Sigma.
Results
M1 and M2 ipRGCs have distinct morphological characteristics
We first examined the overall morphological characteristics of M1 and M2 cells in the adult mouse retina using a transgenic mouse line in which ipRGCs are labeled in vivo with EGFP (Schmidt et al., 2008) to identify and fill 29 ipRGCs with the intracellular tracer Neurobiotin. We then processed these retinas for immunocytochemistry and costained for ChAT, which is a marker for cholinergic amacrine cells whose cell bodies are found in both the GCL and the INL. This served as a visual marker for these two retinal layers. M1 cells were identified as those cells whose dendrites stratified solely in sublamina a (Fig. 1A), while M2 cells were identified as those cells whose dendrites stratified solely in sublamina b (Fig. 1B). When the dendritic arbors of these two populations were further examined, we observed M2 cells had significantly larger dendritic field diameters (422.9 ± 23.5 μm vs 313.6 ± 17.3 μm; p < 0.001) as well as more overall dendritic length (4131.4 ± 273.7 μm vs 2092.5 ± 145.9 μm; p < 0.001) (Fig. 1C) and significantly larger soma diameter (21.8 ± 0.8 μm vs 17.0 ± 0.4 μm, p < 0.001) (Fig. 1D). We also observed that the dendritic arbors of M2 cells seemed more complex and highly branched than those of M1 cells. These differences in dendritic complexity of M1 versus M2 cells could be clearly seen after Sholl analysis (supplemental Fig. 1A, available at www.jneurosci.org as supplemental material) as the M2 cells displayed a higher number of dendritic crossings than M1 cells (supplemental Fig. 1B, available at www.jneurosci.org as supplemental material). Additionally, when we filled neighboring M1 and M2 cells with Neurobiotin, we observed extensive overlap of the dendritic fields (Fig. 1E,F), suggesting extensive overlap of the receptive fields of M1 and M2 cells. Collectively, these results demonstrate morphological dissimilarities between M1 and M2 cells that go beyond differences solely in their stratification level within the IPL.
Figure 1.

Morphological characteristics of M1 and M2 cells. A1, B1, Whole-mount retinas of M1 and M2 cells filled with Neurobiotin (green) and immunostained for ChAT (red), a cholinergic amacrine cell marker. A1, M1 cell with dendrites stratifying solely in sublamina a of the IPL. A2, Tracings of M1 cells to show dendritic morphology. B1, M2 cell with dendrites stratifying solely in the sublamina b of the IPL. B2, Tracings of M2 cells to show dendritic morphology. C, Dendritic field diameter and total dendritic length of M1 (red; n = 16) and M2 (black; n = 13) cells. Mean dendritic field diameter and total dendritic length of M1 (green) and M2 (blue) cells are shown. D, Soma diameter of M1 (red: n = 16) and M2 (black: n = 13) cells. Mean soma diameter of M1 (red bar) and M2 (black bar) cells. E, F, M1 (green) and M2 (magenta) dendrites of neighboring M1 (yellow arrow) and M2 (white arrow) cells filled with Neurobiotin. ChAT, Choline acetyl transferase, IPL, inner plexiform layer. Scale bars: 50 μm.
M1 and M2 ipRGCs have distinct light response characteristics
We used the EGFP reporter mouse, which labels both M1 and M2 cells (Schmidt et al., 2008), to test for physiological diversity in the intrinsic light responses of these two cell types. We performed simultaneous dual whole-cell recordings of the intrinsic light responses of neighboring ipRGCs to a 30 s fixed, bright white light stimulus (supplemental Methods, available at www.jneurosci.org as supplemental material) in both current- and voltage-clamp mode in the presence of synaptic blockers and the sodium channel blocker TTX. Alexa Fluor-594 hydrazide (AF-594) was included in the intracellular solution, which allowed us to identify the morphological subtype of individual cells immediately following recordings (supplemental Methods, available at www.jneurosci.org as supplemental material). Current-clamp recordings of ipRGC light responses to a 30 s white-light stimulus revealed noticeable differences in the light responses of identified M1 and M2 cells (Fig. 2A). M1 cells responded to the 30 s white-light stimulus with a significantly larger depolarization than did M2 cells (30.5 ± 1.6 mV vs 11.1 ± 1.0 mV, p < 0.001) (Fig. 2C). We also performed the experiments in voltage-clamp mode to compare the light-evoked current in each of these two cell types. Again, both cell types showed distinct light responses paralleling the differences observed in current clamp (Fig. 2B). M1 cells responded to a 30 s white light stimulus with a significantly larger maximum light-evoked current than did M2 cells (-550.5 ± 65.7 pA versus −63.5 ± 6.5 pA, p < 0.001) (Fig. 2D). The initial light-evoked current of M1 cells decayed rapidly until reaching a much smaller, steady-state current that lasted for the duration of the light stimulus, while M2 cells responded to light with a small, but relatively sustained inward current.
Figure 2.
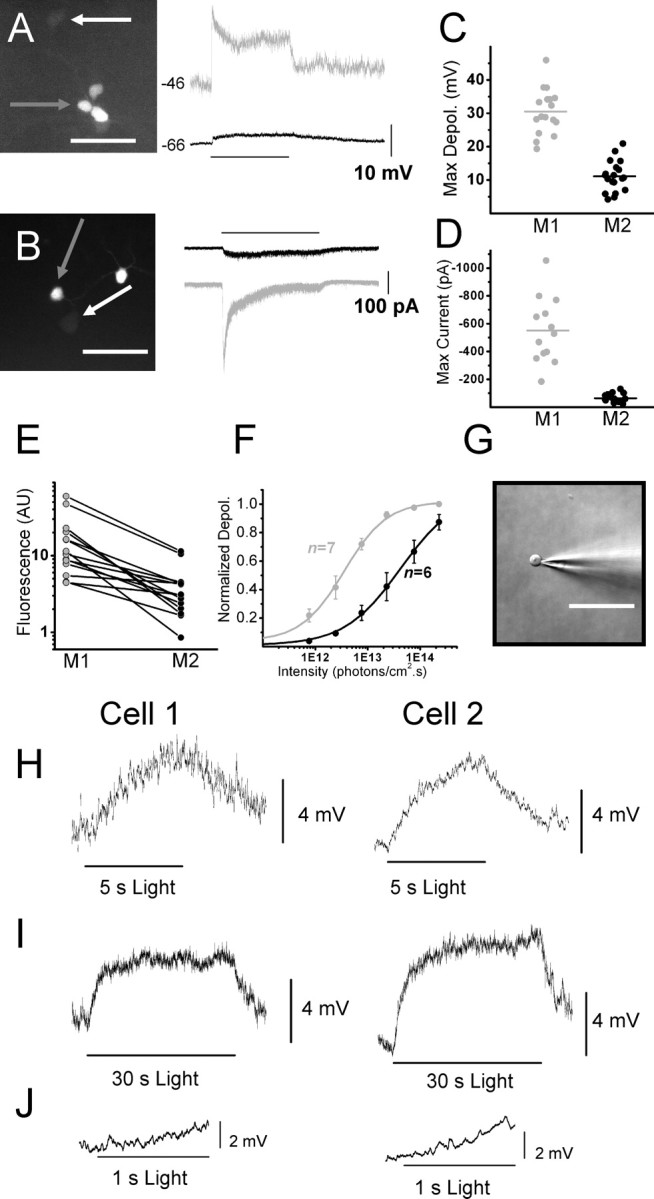
Intrinsic light responses of M1 and M2 cells in whole-mount Opn4-EGFP mouse retinas. All light responses recorded in the presence of synaptic blockers and TTX. A, Left, EGFP signal under epifluorescent illumination of M1 (gray arrow) and M2 (white arrow) cell targeted for dual whole-cell current-clamp recordings. Right, Responses in current-clamp mode of M1 (gray trace) and M2 (black trace) cells shown in left panel to a 30 s white light stimulus. B, Left, EGFP signal under epifluorescent illumination of M1 (gray arrow) and M2 (white arrow) cell targeted for dual whole-cell voltage-clamp recordings. Right, Responses in voltage-clamp mode of M1 (gray trace) and M2 (black trace) cells shown in the left panel to a 30 s white light stimulus. C, Maximum depolarization evoked by single 30 s white light stimulus measured in current-clamp mode of M1 (gray; n = 17) and M2 (black; n = 19) cells. Mean depolarization of M1 (gray bar) and M2 (black bar) cells. D, Maximum current evoked by single 30 s white light stimulus measured in voltage-clamp mode of M1 (gray; n = 13) and M2 (black; n = 19) cells. Mean maximum current of M1 (gray bar) and M2 (black bar) cells. E, Brightness (in AUs) of epifluorescence of EGFP signal for pairs containing one M1 and one M2 cell. F, Irradiance response curves for M1 (gray; IR50 ∼ 3.25 × 10¹² photons · cm−2 · s−1) and M2 (black; IR50 ∼ 3.44 × 10¹³ photons · cm−2 · s−1) generated by stimulating cells with increasing intensities of a 5 s 480 nm light stimulus. G, Nucleated patch recordings were made in control solution from M2 cells (n = 5). H, I, Average of 5–7 light responses recorded from nucleated patches of two cells (cell 1, left panels; cell 2, right panels) in current-clamp mode to a fixed, bright 5 s (H) or 30 s (I) white light stimulus. J, Expanded view of first 1 s of 30 s light stimulation for cell 1 (left panel) and cell 2 (right panel). Scale bars: 50 μm. IR50, Irradiance yielding half-maximal response.
Interestingly, we observed that M1 cells, in general, had a brighter EGFP signal than did M2 cells (Fig. 2E). It is conceivable that the heterogeneity of EGFP expression among the ipRGCs in our reporter mouse line reflects a parallel heterogeneity of melanopsin expression among M1 and M2 cells. Previous research has indicated that M1 cells may express more melanopsin based on higher levels of anti-melanopsin antibody staining (Hattar et al., 2006; Baver et al., 2008). Consistent with this hypothesis, M1 cells showed a tenfold higher sensitivity to 480 nm light than M2 cells as assessed in irradiance-response experiments (Fig. 2F).
Though M2 cells do respond to light in the presence of synaptic blockers, it is still possible that light responses in this subpopulation are due to some residual chemical or electrical synaptic input. To determine conclusively whether M2 cells are intrinsically photosensitive, we performed whole-cell current-clamp recordings in the same mixture of drugs used for the initial light response experiments, but also containing cholinergic, synaptic, and gap junctional blockers. Light responses were recorded in all cells tested (supplemental Fig. 2, available at www.jneurosci.org as supplemental material). Additionally, we performed nucleated patch experiments in which we isolated a portion of the membrane of M2 cells from the soma and tested the membrane for photosensitivity. We recorded responses to 5 or 30 s white light stimuli in all cells tested (6.7 ± 1.0 mV for 5 s stimuli, p < 0.01), demonstrating conclusively for the first time the intrinsic photosensitivity of M2 cells (Fig. 2H–J).
M1 and M2 cells have distinct intrinsic membrane properties
It has been demonstrated that RGCs vary in their intrinsic membrane properties (O'Brien et al., 2002). We used whole-cell recording methods to investigate whether the membrane properties and excitability of M1 and M2 cells differ. Indeed we found that M1 and M2 cells differ significantly in terms of their RN (input resistance) and Vm (resting membrane potential), with M1 cells having a significantly higher RN than M2 cells (709.0 ± 44.3 MΩ vs 216.4 ± 13.0 MΩ; p < 0.001) and a significantly more depolarized Vm than M2 cells (−48.2 ± 1.1 mV vs −66.0 ± 0.7 mV; p < 0.001) (Fig. 3C). To further examine differences in the intrinsic membrane properties of these two ipRGC subtypes, we recorded responses from single M1 or M2 cells in current-clamp mode to hyperpolarizing and depolarizing current pulses in the presence of synaptic blockers. For these experiments, current was injected to hold the Vm of both populations of cells at approximately −65 mV to facilitate direct comparison between current–voltage relationships of each subtype. Hyperpolarizing current steps of similar strength generated larger voltage responses in M1 cells than M2 cells (Fig. 3A,B). Accordingly, I–V curves obtained from subthreshold responses to hyperpolarizing current pulses in M1 cells were much steeper than in M2 cells (Fig. 3D).
Figure 3.

Responses of M1 and M2 cells to hyperpolarizing current pulses. Recordings were performed in the presence of synaptic blockers. A, B, Responses of M1 (A) and M2 (B) cells to 1 s hyperpolarizing current injection. Values to the right of the steps indicate the maximum current injection shown. C, RN and Vm of M1 (red; n = 23) and M2 (black; n = 25) cells. Mean RN and Vm shown for M1 (green bars) and M2 (blue bars) cells. D, Mean ± SE voltage response of M1 (red, n = 15) and M2 (black, n = 12) cells to hyperpolarizing current steps. Current injections were divided by capacitance of the cells to facilitate averaging (bin = 0.5 pA/pF). Points were fit with linear regression. RN, Input resistance; Vm, resting membrane potential.
Representative examples of the firing pattern of M1 and M2 cells are shown in Figure 4, A and B. In both cell types, the temporal pattern of firing was characterized by an adaptation of spike frequency. In general, M2 cells showed firing over a wide range of depolarizing current pulses, while M1 cells were only able to sustain action potential firing through a narrower range of depolarization. While both cell types showed increases in instantaneous frequency of the first interspike interval with increasing strengths of current injection, M2 cells attained higher frequencies (242.3 ± 9.5 Hz) than did M1 cells (76.6 ± 14.8 Hz) (Fig. 4C,G). Additionally, if firing rate was averaged across the entire 1 s current injection, M1 cells attained lower average firing rates (10.8 ± 1.3 Hz) than did M2 cells (38.4 ± 4.0 Hz), and reached spike block much more quickly (Fig. 4D,G). Both cell types also showed rapid frequency adaptation over the course of a given stimulus. Instantaneous frequency over time for the two example cells is shown in Figure 4, E and F.
Figure 4.

Responses of M1 and M2 cells to depolarizing current pulses. Recordings were performed in the presence of synaptic blockers. A, B, Representative response of M1 (A) and M2 (B) cells to 1 s depolarizing current injection. Values to the right of the current steps indicate maximum current injection shown. C, Instantaneous frequency of the first interspike interval for M1 cell in A (gray) and M2 cell in B (black). D, Average firing rate for duration of 1 s depolarizing steps for M1 cell in A (gray) and M2 cell in B (black). E, Instantaneous frequency over time for M1 cell in A. F, Instantaneous frequency over time for M2 cell in B. G, Mean ± SE instantaneous frequency of the first interspike interval (circles) and mean ± SE firing rate (squares) during current injection for M1 (gray, n = 15) and M2 (black, n = 12) cells. Current injection for each cell was divided by its capacitance (bin = 0.5 pA/pF) to facilitate averaging.
Discussion
In this study, we used a transgenic mouse model in which ipRGCs are labeled in vivo with EGFP to identify several morphological and physiological properties of M1 and M2 cells. Previous morphological analyses of M1 cells have characterized their sparse dendritic arbors and stratification in sublamina a of the IPL (Berson et al., 2002; Hattar et al., 2002). Upon comparing the dendritic arbors of M1 cells with those of M2 cells, we found that M2 cells had not only more total dendritic length and larger dendritic field diameters, but also more complex dendritic arbors. The morphology of these cells is consistent with those morphologically classified as Mouse (M) 6 RGCs by Coombs et al. (2006), a population containing ON, OFF, and bistratified melanopsin-positive RGCs. Other studies have randomly labeled ipRGCs via either viral or immunological methods, and determined the proportion of M1 and M2 cells to be 40–55% and 40–45% of the total ipRGC population, respectively (Viney et al., 2007; Baver et al., 2008). Additionally, viral labeling has indicated that the dendritic field of these cells tile and cover the entire mouse retina (Viney et al., 2007). Our data indicate extensive overlap of dendritic fields between these two subtypes, which implies distinct functionality in signaling light information to the brain. These findings underscore differences in the morphology of M1 and M2 cells that go beyond dendritic stratification and suggest differences in their functional properties.
Some of these functional differences between M1 and M2 cells were revealed by examining their intrinsic light responses. M1 cells responded to light with a significantly larger depolarization and light-evoked current than did M2 cells. Additionally, M1 cells displayed generally brighter EGFP signals than M2 cells, which because in this mouse model EGFP is driven by the melanopsin promoter, could imply proportionally higher levels of melanopsin in M1 cells. This would be in agreement with the observation that M1 cells show brighter anti-melanopsin antibody staining than M2 cells (Hattar et al., 2006; Baver et al., 2008). Our findings of an ∼10-fold higher sensitivity of M1 cells to 480 nm light provides preliminary support for this idea. Our values for both threshold and IR50 are in agreement with previously published values for sensitivity of the intrinsic ipRGC response (Berson et al., 2002; Dacey et al., 2005; Tu et al., 2005). These differences in light sensitivity among ipRGCs parallel the physiological diversity seen by Tu et al. (2005), who demonstrated that what they called “type III” cells showed an ∼10-fold higher sensitivity to 480 nm light than what they called “type II” cells. Because the action spectrum of M2 cells has not yet been experimentally determined it is also possible that the peak action spectra of these two subtypes are not the same and could underlie the differences in sensitivity to 480 nm light.
The functional heterogeneity between M1 and M2 cells extended to various intrinsic membrane properties. M2 cells had a lower RN and more hyperpolarized Vm than M1 cells. Overall, M2 cells were capable of reaching higher peak and average firing rates than M1 cells, and were capable of spiking over a greater range of depolarizing current injections. Again these findings correlate with the results of Tu et al. (2005) in that their physiological “type II” cells were capable of higher peak firing rates than their physiological “type III” cells. This implies that perhaps the diversity reported in their MEA study could parallel the diversity reported here, with physiological “type III” cells correlating with M1 cells and physiological “type II” cells correlating with M2 cells. These differences in RN and ability to sustain spiking raise the question of what differences in ion channel expression might exist across these two subpopulations. Size alone cannot account for the differences in RN because when average RN is divided by average Cm to normalize for cell size, M1 cells show greater than fourfold higher (27.6) MΩ/pF compared with M2 cells (6.3). It is likely that M2 cells have a higher K+ conductance at rest, which could also account for their more hyperpolarized Vm. In terms of spiking, it is possible that M1 and M2 cells express different subtypes or amounts of voltage-gated sodium channels, or that different types of other voltage-gated ion channels could influence spiking in each of these subtypes.
Previous research has demonstrated that likely all ipRGCs receive synaptic signals from the outer retina (Wong et al., 2007; Schmidt et al., 2008). These underlying differences in the intrinsic membrane properties likely affect how these synaptic signals are relayed to the different brain centers. M2 cells have a low input resistance, suggesting that a relatively large amount of current is needed to drive spiking, in contrast to their small and insensitive photocurrent. These findings suggest that perhaps most of the signals transmitted by M2 cells are driven by synaptic currents. This is in contrast to M1 cells which have a high input resistance and large, sensitive photocurrent, which implies that the intrinsic photosensitivity of M1 cells is more influential than that of M2 cells in terms of how this subpopulation signals light information to the brain. It has been determined that M1 cells form a discrete plexus with dopaminergic amacrine cells and may even signal to these cells via dendrodendritic synapses (Viney et al., 2007; Zhang et al., 2008). The divergent properties of the membranes, intrinsic light responses, and dendritic stratification of M1 and M2 cells implies further divergence of not only the types but also the relative influences of synaptic inputs on these two ipRGC subtypes. The synaptic influences on M1 and M2 ipRGCs will be an important question for future research.
M1 and M2 cells specifically and differentially innervate non-image-forming and image-forming brain centers, and only for some of these areas has the proportion of M1 versus M2 projections been examined (Hattar et al., 2006; Baver et al., 2008). It is possible that these two subpopulations serve distinct roles in signaling light information to different brain areas.
Footnotes
This work was supported in part by National Institutes of Health Grants R01EY012949, R21-EY018885, and T32 EY0707133, by the University of Minnesota Graduate School, and by the McKnight Foundation. We thank Darwin Hang for his technical assistance.
References
- Baver SB, Pickard GE, Sollars PJ, Pickard GE. Two types of melanopsin retinal ganglion cell differentially innervate the hypothalamic suprachiasmatic nucleus and the olivary pretectal nucleus. Eur J Neurosci. 2008;27:1763–1770. doi: 10.1111/j.1460-9568.2008.06149.x. [DOI] [PubMed] [Google Scholar]
- Berson DM, Dunn FA, Takao M. Phototransduction by retinal ganglion cells that set the circadian clock. Science. 2002;295:1070–1073. doi: 10.1126/science.1067262. [DOI] [PubMed] [Google Scholar]
- Coombs J, van der List D, Wang GY, Chalupa LM. Morphological properties of mouse retinal ganglion cells. Neuroscience. 2006;140:123–136. doi: 10.1016/j.neuroscience.2006.02.079. [DOI] [PubMed] [Google Scholar]
- Dacey DM, Liao HW, Peterson BB, Robinson FR, Smith VC, Pokorny J, Yau KW, Gamlin PD. Melanopsin-expressing ganglion cells in primate retina signal colour and irradiance and project to the LGN. Nature. 2005;433:749–754. doi: 10.1038/nature03387. [DOI] [PubMed] [Google Scholar]
- Güler AD, Ecker JL, Lall GS, Haq S, Altimus CM, Liao HW, Barnard AR, Cahill H, Badea TC, Zhao H, Hankins MW, Berson DM, Lucas RJ, Yau KW, Hattar S. Melanopsin cells are the principal conduits for rod-cone input to non-image-forming vision. Nature. 2008;453:102–105. doi: 10.1038/nature06829. [DOI] [PMC free article] [PubMed] [Google Scholar]
- Hatori M, Le H, Vollmers C, Keding SR, Tanaka N, Schmedt C, Jegla T, Panda S. Inducible ablation of melanopsin-expressing retinal ganglion cells reveals their central role in non-image forming visual responses. PLoS ONE. 2008;3:e2451. doi: 10.1371/journal.pone.0002451. [DOI] [PMC free article] [PubMed] [Google Scholar]
- Hattar S, Liao HW, Takao M, Berson DM, Yau KW. Melanopsin-containing retinal ganglion cells: architecture, projections, and intrinsic photosensitivity. Science. 2002;295:1065–1070. doi: 10.1126/science.1069609. [DOI] [PMC free article] [PubMed] [Google Scholar]
- Hattar S, Kumar M, Park A, Tong P, Tung J, Yau KW, Berson DM. Central projections of melanopsin-expressing retinal ganglion cells in the mouse. J Comp Neurol. 2006;497:326–349. doi: 10.1002/cne.20970. [DOI] [PMC free article] [PubMed] [Google Scholar]
- O'Brien BJ, Isayama T, Richardson R, Berson DM. Intrinsic physiological properties of cat retinal ganglion cells. J Physiol. 2002;538:787–802. doi: 10.1113/jphysiol.2001.013009. [DOI] [PMC free article] [PubMed] [Google Scholar]
- Schmidt TM, Taniguchi K, Kofuji P. Intrinsic and extrinsic light responses in melanopsin-expressing ganglion cells during mouse development. J Neurophysiol. 2008;100:371–384. doi: 10.1152/jn.00062.2008. [DOI] [PMC free article] [PubMed] [Google Scholar]
- Sekaran S, Foster RG, Lucas RJ, Hankins MW. Calcium imaging reveals a network of intrinsically light-sensitive inner-retinal neurons. Curr Biol. 2003;13:1290–1298. doi: 10.1016/s0960-9822(03)00510-4. [DOI] [PubMed] [Google Scholar]
- Tu DC, Zhang D, Demas J, Slutsky EB, Provencio I, Holy TE, Van Gelder RN. Physiologic diversity and development of intrinsically photosensitive retinal ganglion cells. Neuron. 2005;48:987–999. doi: 10.1016/j.neuron.2005.09.031. [DOI] [PubMed] [Google Scholar]
- Viney TJ, Balint K, Hillier D, Siegert S, Boldogkoi Z, Enquist LW, Meister M, Cepko CL, Roska B. Local retinal circuits of melanopsin-containing ganglion cells identified by transsynaptic viral tracing. Curr Biol. 2007;17:981–988. doi: 10.1016/j.cub.2007.04.058. [DOI] [PubMed] [Google Scholar]
- Wong KY, Dunn FA, Graham DM, Berson DM. Synaptic influences on rat ganglion-cell photoreceptors. J Physiol. 2007;582:279–296. doi: 10.1113/jphysiol.2007.133751. [DOI] [PMC free article] [PubMed] [Google Scholar]
- Zhang DQ, Wong KY, Sollars PJ, Berson DM, Pickard GE, McMahon DG. Intraretinal signaling by ganglion cell photoreceptors to dopaminergic amacrine neurons. Proc Natl Acad Sci U S A. 2008;105:14181–14186. doi: 10.1073/pnas.0803893105. [DOI] [PMC free article] [PubMed] [Google Scholar]