

Abstract
Telomere length analysis has been greatly simplified by the quantitative flow cytometry technique flow-FISH. In this method, a fluorescein-labeled synthetic oligonucleotide complementary to the telomere terminal repeat sequence is hybridized to the telomere sequence and the resulting fluorescence measured by flow cytometry. This technique has supplanted the traditional laborious Southern blot telomere length measurement techniques in many laboratories, and allows single cell analysis of telomere length in high-throughput sample formats. Nevertheless, the harsh conditions required for telomere probe annealing (82°C) has made it difficult to successfully combine this technique with simultaneous immunolabeling. Most traditional organic fluorescent probes (i.e. fluorescein, phycoerythrin, etc.) have limited thermal stability and do not survive the high-temperature annealing process, despite efforts to covalently crosslink the antigen-antibody-fluorophore complex. This loss of probe fluorescence has made it difficult to measure flow-FISH in complex lymphocyte populations, and has generally forced investigators to use fluorescent-activated cell sorting to pre-separate their populations, a laborious technique that requires prohibitively large numbers of cells.
In this study, we have substituted quantum dots (nanoparticles) for traditional fluorophores in FISH-flow. Quantum dots were demonstrated to possess much greater thermal stability than traditional low molecular weight and phycobiliprotein fluorophores. Quantum dot antibody conjugates directed against monocyte and T cell antigens were found to retain most of their fluorescence following the high-temperature annealing step, allowing simultaneous fluorescent immunophenotyping and telomere length measurement. Since quantum dots have very narrow emission bandwidths, we were able to analyze multiple quantum dot-antibody conjugates (Qdot 605, 655 and 705) simultaneously with FISH-flow measurement to assess the age-associated decline in telomere length in both human monocytes and T cell subsets. With quantum dot immunolabeling, the mean decrease rate in telomere length for CD4+ cells was calculated at 41.8bp/year, very close to previously reported values using traditional flow-FISH and Southern blotting. This modification to the traditional flow-FISH technique should therefore allow simultaneous fluorescent immunophenotyping and telomere length measurement, permitting complex cell subset-specific analysis in small numbers of cells without the requirement for prior cell sorting.
Keywords: FISH-flow cytometry, quantum dots, telomere length
1. Introduction
Telomeres are the end-points of chromosomal DNA. They consist of highly conserved repeated short sequences, and “cap” the terminal ends of human DNA. Characterizing the dynamics of telomeres has been an important goal in cell biology; telomeres are believed to be important for maintaining chromosome stability (Cong et al., 2002; Saldanha et al., 2003). The DNA replication process also inherently shortens telomeres with each cell cycle division; maintenance of telomere length and the significance of telomere shortening are all subjects of intense study. Initially connected to the cellular evolution leading to senescence, abnormalities within the dynamics of the telomere length have been tested as a marker for specific diseases eluding the senescence end point such as cancer (Dahnse et al., 1997; Hodes, 1999; Lansdorp, 2008). The gradual erosion of telomere length during cellular replication cycle also seems to lead to a minimum threshold below which cell cycling stops and cellular senescence is activated (Harley, 1991; Backburn, 1999; Hodes, 1999). Loss of telomeres may therefore function as a cellular “timer” recording the number of cell divisions and shutting down replication once the cell reaches a certain “age”. Conversely, loss of telomere length can be reversed by telomerase enzymes, that can fill in the telomere repeats lost during DNA replication. The dynamic between telomere loss and telomerase activity undoubtedly play a critical role in the regulation of cell homeostasis and senescence. One practical application of this phenomenon is its involvement in cancer cell development. In many tumors, telomerase levels are up-regulated, maintaining telomere length above the limiting senescence limit. Cell replication can therefore go unchecked, resulting in immortalization and possibly neoplastic transformation (Shay and Bacchetti, 1997; Morin 1997; Shay and Wright, 2000). Telomere length measurement may also provide a useful indicator of cellular ontogeny; “older” cells at later stages of differentiation would be presumed to have shorter telomeres allowing the developmental progression of complex tissue systems (like the immune system) to be mapped.
Traditional methods for measurement of telomere length have relied on classical Southern blotting of whole genomic DNA using radio-labeled complementary cDNA or synthetic peptide nucleic acid (PNA) probes directed against the telomere termimal repeat sequences. These techniques are accurate but extremely laborious, requiring large numbers of cells. Analysis of telomere length in small cell subsets (such as T memory cells, for example) requires pre-enrichment of the cell type of interest, and usually requires prohibitively large amounts of starting material. To address this technique limitation, a fluorescent method for measuring telomere length in individual cells was recently developed (Baerlocher et al., 2002; Baerlocher and Lansdorp, 2003; Baerlocher et al., 2006). In this technique (called Flow-FISH), the cell type of interest is simultaneously fixed with paraformaldehyde and permeablized using a detergent. The fixed cells were then heated to greater than 85°C, allowing DNA melting. A fluorochrome-conjugated synthetic (polynucleic acid or PNA) oligonucleotide probe complementary to the telomere repeat sequence was then added to the cells, which then specifically binds to the telomere sites at amounts directly proportional to the number of repeats (and hence length). The cells were then cooled and analyzed for fluorochrome fluorescence by flow cytometry at room temperature. The resulting fluorescence of the cells was directly proportional to the length of its telomeres. By doing side-by-side Southern blotting and Flow-FISH using a PNA probe with a known molar amount of conjugated FITC and flow cytometry microsphere standards with known amounts of conjugated FITC molecules, a mathematical formula was empirically derived relating relative fluorescence to telomere length in kilobase pairs (Rufer et al., 1998; Rufer et al., 1999; Kapoor and Telford 2004). This method has been widely used to measure telomere length in intact cells by flow cytometry. While hybridized PNA probe telomere length analysis by imaging and image cytometry tends to be more accurate than flow (due to the better control of cell orientation and quantitation of FISH spots in an imaging system), Flow-FISH has the advantage of far faster throughput, allowing rapid analysis of thousands of cells and some amelioration of fluorescent measurement error (Poon et al.).
This technique has a number of advantages in comparison to previous whole genomic DNA methods. It requires very small numbers of cells, and can be readily scaled up to permit high-throughput analysis of large numbers of samples. In theory, it should also be relatively easy to combine flow-FISH analysis with fluorescent immunolabeling. Combining these two techniques would make it possible to analyze telomere length in very small subsets of complex immune tissues, inaccessible to traditional Southern blot analysis. It is also likely to have great clinical significance. For example, there is a great need to assess the developmental status of transplanted immune cells in bone marrow transplant recipients, who have been subjected to immune system ablation with drugs or radiation followed by adoptive transfer of new immune cells. Telomere length measurement can provide a useful marker for leukocyte ontogeny in the transplanted immune system. The small number of cells typically available from patients could be readily analyzed by a combined immunolabeling/flow-FISH technique.
However, the harsh conditions required for PNA probe hybridization (greater than 80°C) have proven very incompatible with simultaneous fluorescent immunophenotyping. Most fluorescent probes, including low molecular weight fluorochromes such as fluorescein and rhodamine, and larger proteins such as the phycobiliproteins phycoerythrin (PE) and allophycocyanin (APC) are damaged or unfold at high temperatures. Previous studies have analyzed two cell subpopulations of CD8+ lymphocytes using the fluorescent probes Alexa Fluor 488 and Alexa Fluor 546 for cell surface staining (Schmid et al., 2002). However, the thermal stability of most fluorophore-antibody conjugates has proven much poorer in the 80 to 87°C range required for probe hybridization (Schmid et al., 2002; Baerlocher et al., 2006). Covalent crosslinking of the fluorophore-antibody complex to the cell surface improves this situation somewhat, but not enough to completely preserve cell fluorescence. As a result, flow-FISH is done mainly with cell populations previously separated by fluorescence-activated cell sorting (FACS). While this technique works, it once again requires prohibitively large numbers of cells, defeating one of the key advantages of using flow cytometry for these measurements. Patient samples in particular would not be accessible to this laborious two-part approach.
In the present study, we have replaced traditional fluorescent immunolabeling probes with quantum dots, a new generation of fluorescent probes that are seeing increasing use in flow cytometric analysis. Quantum dots are inorganic semiconductor complexes that are highly fluorescent, and can be readily excited using short-wavelength lasers (ultraviolet or violet) often available on flow cytometers. Quantum dots can be derivatived and attached to antibodies, using similar chemistry to PE or APC conjugation. Their properties and applications for imaging and cytometry have been extensively described and reviewed (Jamieson et al., 2007; Bulte and Modo, 2008). Most importantly, quantum dots possess much better temperature stability than traditional fluorophores. They should be able to tolerate the hybridization temperatures required for telomere labeling. Quantum dots have been used for studying the dynamics of telomerization in HeLa cells by spectrometry (Patolsky et al., 2003). In this study, we have indeed determined that quantum dots largely retain their fluorescence following high temperature treatment, in contrast to traditional fluorophores. We have also successfully combined flow-FISH analysis with simultaneous immunolabeling for multiple monocyte and T cell markers. This modification of the traditional flow-FISH technique should more easily allow the analysis of telomere length in complex immune cell mixtures, particularly in small clinical samples.
2. Materials and methods
The method for measuring the telomere length using a flow cytometer has been extensively described in details in the following reports by Rufer et al. 1998, 1999 and Baerlocher et al 2002 and 2006.
2.1 Reagents
The quantum dot direct antibody conjugates QD605 anti-human CD14, QD655 anti-human CD3 and QD705 anti-human CD4 were purchased from Invitrogen Corporation (Carlsbad, CA). Some quantum dot conjugates were generated by direct covalent coupling of derivatived quantum dots and unconjugated antibody, using a conjugation kit (Invitrogen Corporation, Carlsbad, CA)). CD3 FITC, CD3 PE, CD4 PECy7, CD4 PECy5, CD8 APC, CD4 Alexa Fluor 647, CD4 APCCy7 and CD8 Pacific Blue were purchased from BD Biosciences (San Jose, CA). Low-fluorescence Quantum FITC MESF Beads (catalog number 824) were purchased from Bangs Laboratories (Fishers, IN). The Telomere PNA Kit/FITC (cat# 5327) was purchased from Dako (Carpinteria, CA). The DNA binding dye LDS751 was purchased from Exiton (Dayton, Ohio). The covalent crosslinking reagent BS3 (bis(sulfosuccinumidyl)suberate) was obtained from Pierce (Rockford, IL).
2.2. Cells
Whole blood units from normal healthy volunteers of different ages were collected at the NIH Department of Transfusion Medicine, under an Internal Review Board approved protocol. Peripheral blood mononuclear cells (MNCs) were isolated by Ficoll density centrifugation (1.077 g/ml). Cells were washed twice in PBS with 1% BSA and then frozen in 10% DMSO for later use. Calf thymocytes (CT) were prepared from freshly harvested calf thymus (U.S. Department of Agriculture) using the method of Baerlocher et al. (Baerlocher et al., 2006). These thymocytes were then fixed in 0.2% formaldehyde, aliquoted and frozen for later use as internal reference cells. MNCs from a single healthy donor (collected as described above) were also used as a control reference for checking the day-to-day variability of the method. These MNCs were also fixed with 0.2% formaldehyde then aliquoted and frozen. A single passage of Jurkat T cells were used as another control reference. These cells were expanded in large quantity, cryopreserved in DMSO as described above, and used for the duration of the study.
2.3. Fluorescent immunolabeling
Donor samples were thawed, washed twice with PBS + 1%BSA and counted with a Coulter Counter. Cells were then labeled with the appropriate antibodies. Each sample was incubated for 20 minutes with CD14-QD605, CD3-QD655 and CD4-QD705. Samples were then washed once with PBS and fixed with 1.5 mM BS3 (bis(sulfosuccinumidyl)suberate) final concentration (Schmid et al., 2002; Shen et al., 2007) for 30 minutes at room temp (RT). The reaction was quenched with 15mM Tris Buffer pH 7.5 in PBS for 20 minutes at RT. Then cells were washed once in PBS and resuspended in PBS with 1% BSA for 30 minutes and counted before hybridization. For labeling cells with the other fluorochromes (i.e. phycoerythrin), the same protocol was used.
2.4. Reference cells
Calf thymocytes, fixed reference MNCs and Jurkat cells were thawed, washed twice with PBS + 1% BSA and counted. To monitor tube-to-tube variation, fixed calf thymocytes were added to each sample tube as an internal reference. Telomere length results were then normalized to the calf thymocyte value (Baerlocher et al., 2006). Fixed MNCs and Jurkat cells were run simultaneously but separately from the sample tubes to further verify assay reproducibility.
2.5. FISH-flow for telomere length
Each sample was divided in four replicate tubes, each tube prepared by mixing 2 × 10⁵ MNCs and 105 CTs in 50μl total volume. 200μl of FITC labeled PNA probe solution was added to two sample tubes while 200μl of unlabeled PNA probe solution is added to the remaining two sample tubes. Samples were hybridized at 82°C for 11 minutes in a temperature-controlled water bath. Varying the hybridization time from 10 to14 minutes had no significant effect on probe hybridization (data not shown). The samples were then stored overnight at room temperature (22-24°C). Cells were then washed twice with wash buffer provided with the Telomere PNA Kit/FITC (Dako) according to the kit directions. The third wash was performed with PBS + 1%BSA. The cells were then centrifuged and resuspended in 400 μl of LDS751 (Baerlocher et al., 2006) and incubated from 30 minutes to 2 hrs at 4°C. Samples were then immediately analyzed by flow cytometry. No significant variations in the measurements were observed up to 24 hours (data not shown).
2.6. Flow Cytometry
All samples were analyzed on a LSRII flow cytometer equipped with 488, 633, 405 and 355 nm lasers. The 488 nm laser was used to excite FITC, PE, PECy5, PECy7. The 633nm red laser was used to excite APC, Alexa Fluor 647, APC-Cy7 and LDS-751. The 405nm violet laser was used to excite Pacific Blue and Qdot 705 (detection with a 710/40nm bandpass filter), and the 355nm UV laser to excite Qdot 605 and Qdot 655 (detection with 610/20 nm and 660/20 nm bandpass filter respectively with 640 LP). PMT maximum sensitivity and linear response was optimized using FITC MESF beads (Bangs Laboratory), and fixed PMT voltages were used for all experiments.
Calibration of the LSRII was performed using FITC MESF beads to adjust the FITC channel voltage (Kapoor and Telford, 2004). This voltage was then left constant for the analysis of all the samples. This voltage was determined using a minor modification method previously described by Sasaki et al. (2005) for measuring PMT voltage ranges with both maximum sensitivity and good linear response. In this modification, a cell sample labeled with the FITC PNA probe was analyzed at PMT voltages ranging from 400 to 650V in 25V increments, and the telomere length calculated. Although telomere length was similar over this entire range, it did peak at a voltage value of 525V to 600V for this particular instrument/detector. Linear response was found to be good at this voltage using FITC MESF microspheres. For our experiment voltage of 550V was taken as the maximum sensitivity point for this PMT, and was subsequently used for all MESF microsphere and FITC PNA telomere measurements.
The flow cytometry gating strategy is shown in Figure 1, and is outlined below.
Figure 1.
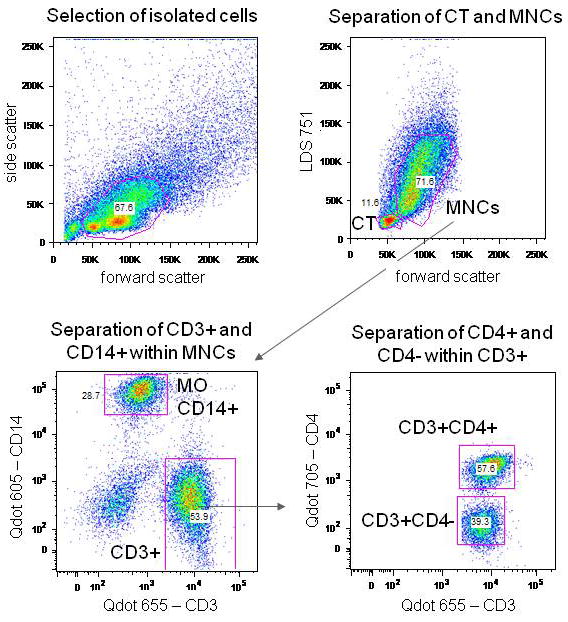
Protocol for the flow cytometry analysis of the telomere length. The first dot plot represents the initial gating of the cell population P1 to reject particles and aggregates. The second dot plot was used for the gating of the MNCs and the internal reference cells CT. The third dot plot represents the separation of the CD3+ cells from the CD14+ cells or monocytes within the gated MNCs. The next dot plot shows the gated CD3+CD4+ and CD3+CD4- cell populations from the previously gated CD3+ cell population. The PNA probes with and without FITC were then analyzed. The PNA FITC channels were then calculated for the gated CD14+, CD3+CD4+, CD3+CD4- and the gated CT cell populations.
Cells were gated on forward and side scattering for isolating healthy cells and then gated on forward scattering versus LDS751 to separate the MNCs singlet (G0/G1 phase) from the calf thymocyte (CT) internal reference standard.
The gated MNCs were then displayed for CD14 and CD3 expression, and the monocyte/T cell populations gated.
CD3+ MNCs were then displayed for CD3 versus CD4 expression, and the CD3+CD4- and CD3+CD4+ populations gated.
The selected CD14+ or CD3+CD4- or CD3+CD4+ were then displayed for FITC fluorescence (corresponding to the FITC labeled PNA probe fluorescence).
The CTs were identified by their scatter and differential binding of the DNA dye LDS751, and similarly gated and displayed for FITC PNA probe fluorescence.
Fixed MNCS (no immunolabeling) and Jurkat T cells were also analyzed for FITC PNA probe fluorescence as reference standards for each experiment.
Data was acquired using DiVa acquisition software (BD Biosciences) and analyzed using FlowJo for Mac ver. 8.0 (Treestar Software, Ashland, WA).
2.7. Calculation of telomere length
The FITC labeled MESF (Molar Equivalent Standard of Fluorescence) beads contained five different populations of beads, each labeled with a known number of FITC molecules. When this bead mixture was analyzed, the mean fluorescence intensity (MFI) values for each bead peak corresponded to the approximate number of fluorescein molecules associated with a cell in the same MFI range. The FITC channel was therefore calibrated with these MESF beads on a logarithmic scale, giving a standard curve for MESF values, and by extension FITC molar concentration. Determining the MFI value for each bead peak in the FITC channel allows for the determination of the equivalent MESF values associated with each donor sample. With the amount of FITC conjugated to the PNA probe being a known value, the amount of PNA probe (corresponding to the telomere length) can then be calculated (Rufer et al., 1999; Baerlocher et al., 2002 and 2006; Kapoor and Telford, 2004). FITC-PNA probe fluorescence is therefore directly related to telomere length in kilobase pairs.
As stated above, all donor samples were analyzed in duplicate tubes with FITC labeled PNA probe and with unlabeled PNA probe. The average FITC channel MFI for the unlabeled PNA probe sample was subtracted from the average FITC channel MFI for the FITC labeled PNA probe sample. This difference determined the equivalent MESF value for the sample. This MESF value was calculate using both the Quantum™ FITC MESF software (Bangs Laboratory) and a linear regression equation relating the MESF values and the correspondence to the FITC histogram scale (Rufer et al., 1999; Baerlocher et al., 2002 and 2006; Kapoor and Telford, 2004). An example of the MESF calibration is reported in Figure 2. Once the MESF value is calculated for each sample, the telomere length expressed in Kb was then calculated using the following equation (Rufer et al., 1999; Baerlocher et al., 2002 and 2006; Kapoor and Telford, 2004):
Figure 2.
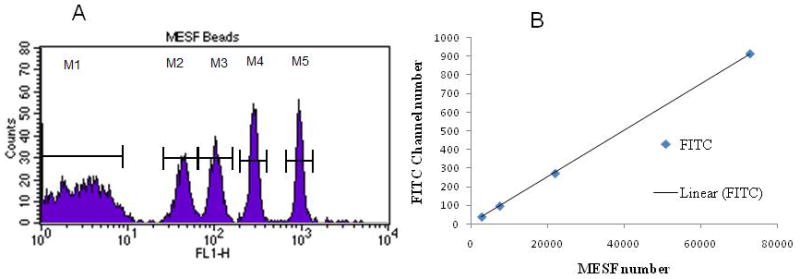
(A) FITC histograms of MESF beads mixtures – M1 peak corresponds to the unlabelled MESF beads and M2 to M5 peaks correspond to the FITC labeled beads with known MESF values; (B) Linear regression of the measured FITC channel numbers versus known MESF values for the MESF beads reported in (A).
CT telomere length was initially calculated for a large number of samples (greater than 6) and was taken as a fixed internal value per experiment. The calculated sample telomere length was then normalized using the measured telomere length calculated for the CTs present in the sample tube and multiplied by the expected telomere length for the CTs.
2.8. Statistical analysis
Linear regression analysis has been performed using integrated data analysis in Microsoft Excel. Statistical difference in telomere length analysis has been performed using a 2-tailed Student t-test.
2.9. Critical aspects
DNA melting, FITC PNA oligonucleotide probe binding and DNA annealing are all highly time and temperature dependent. Careful bench technique, adherence to the incubation times and precise sample temperature control are all critical in obtaining reproducible results. Good instrument quality control, including prior determination of fluorescence detector maximum sensitivity and linearity ranges, and using fixed detector voltages on the same instrument for all analyses, is also critical.
3. Results and discussion
In the present study, we have used quantum dot labeled antibodies as a heat-stable alternative to traditional fluorophores for combining immunolabeling with telomere length measurement. Previous work has shown that many traditional fluorescent probes are severely damaged by the 82°C hybridization step required for telomere probe annealing, rendering simultaneous immunophenotyping difficult. In the past, we have labeled and sorted the cells before hybridization, then performed the telomere length assay on a single cell population. This procedure is arduous, and it is often difficult to obtain sufficient cell numbers from rare subpopulations to carry out an accurate telomere length measurement. Since the main goal of the method is to analyze patient blood before and after treatments, the amount of sample volume is very limited and therefore limits the use of sorting. The alternative has been to identify heat stable fluorochromes to perform the same assay with pre-stained cells in a single sample tube, eliminating the need for sorting. We have therefore tested quantum dots for the required heat stability, comparing them to traditional phycobiliproteins (such as phycoerythrin) and low molecular weight organic fluorochromes (such as the Alexa Fluor dyes).
3.1 Thermal stability of quantum dots
To test the thermal stability of quantum dots, PBMCs were labeled with the appropriate QD linked antibodies to the surface markers CD3, CD4 and CD14, and processed for telomere length measurement, including the 82°C hybridization step as described in the Materials and Methods. After labeling and fixing, the samples were divided in two sets. One was hybridized with the PNA probe at 82°C and the second was stored overnight at 4°C. The samples were then analyzed for QD fluorescence using UV and/or violet lasers source, and the signal-to-noise separation between labeled and unlabeled cells compared for the different conditions. Figure 1 shows that detection of CD14, CD3 and CD4 using QD605, 655 and 705 antibodies respectively was excellent in cells labeled prior to 82°C hybridization treatment. The three QDs could be readily combined for multicolor analysis, and positive populations could be easily distinguished. Table I shows the percentage positive populations for CD14, CD3 and CD4 both with and without 82°C treatment. The percentages remain approximately the same, and the loss of positive cell fluorescence (based on loss of mean fluorescence intensities) was limited, in all cases less than 20%. QD labeling was therefore found to be very heat-stable, and more than sufficient for good immunodetection of cell surface markers.
Table I.
Percentage of cell separation before and after heat treatment at 82°C using quantum dots.
| Quantum dots | Without 82°C heat treatment | With 82°C heat treatment | % label retained after 82°C heat treatment |
|---|---|---|---|
| CD4 QD655 | 22.4% | 18.8% | 84% |
| CD4 QD705 | 17.2% | 14.9% | 87% |
| CD3 QD605 | 32.5% | 28.1% | 86% |
| CD3 QD655 | 30.9% | 26.6% | 86% |
| CD14 QD605 | 4.7% | 5.2% | 100% |
3.2. Thermal instability of other fluorochromes
Other fluorochromes were then compared to quantum dots for their ability to withstand heat treatment, including a number of traditional low molecular weight fluorochromes (fluorescein, Pacific Blue, etc.), heavily substituted low molecular weight fluorochromes (including the Alexa Fluor dyes), phycobiliproteins and phycobiliprotein tandem conjugates. Figure 3 shows a typical comparison between QD655 and phycoerythrin used to label CD3 on MNCs and Alexa Fluo 647 used to label CD4 on MNCs. The quantum dot was far more stable, retaining more than 80% of its prehybridization fluorescence. Phycoerythrin in contrast was completely lost following heat treatment. Table II summarizes a variety of fluorochromes tested in this way. Not all fluorochromes were completely lost. For example, Alexa Fluor 647 fluorescence was preserved reasonably well. However, the positive and negative peak width increased with Alexa Fluor 647 labeling, making the gating of positive and negative populations more ambiguous (Figure 3). All other fluorochromes tested lost virtually all fluorescence and/or detached from the cell surface.
Figure 3.
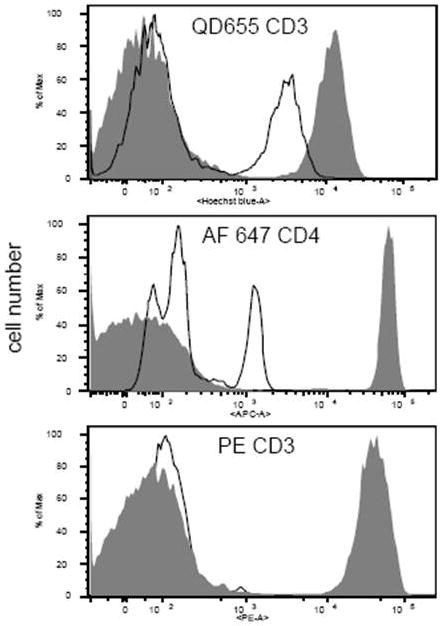
Loss of human CD3 labeling of human MNCs following heat treatment, using QD655 (top histogram), Alexa Fluor 647 (middle histogram) or phycoerythrin (bottom histogram). Samples were either heated at 82°C for 11 minutes (unfilled histograms) or not heated (filled grey histograms).
Table II.
Percentage of cell separation before and after heat treatment at 82°C using common fluorochromes
| Fluorochromes | Without 82°C heat treatment | With 82°C heat treatment | % label retained after 82°C heat treatment |
|---|---|---|---|
| CD4 APCCy7 | 23.7% | 0.0% | 0% |
| CD4 PECy5 | 24.3% | 0.0% | 0% |
| CD4 PECy7 | 24.9% | 0.0% | 0% |
| CD4 AF647 | 24.3% | 21.5% | 88% |
| CD8 APC | 8.2% | 0.0% | 0% |
| CD8 Pacific Blue | 8.0% | 0.0% | 0% |
| CD3 FITC | 33.0% | 0.0% | 0% |
| CD3 PE | 33.0% | 0.0% | 0% |
3.3. Dependence of the telomere length with age and PBMC phenotype
The traditional PNA probe based telomere length assay was then shown to function normally with the addition of simultaneous immunolabeling. To demonstrate this, we measured telomere length in myeloid and T cell subsets using young, middle-aged and older donors. Telomere length has been previously shown to decrease somewhat with age in normal donors (Rufer et al., 1999; Son et al., 2000). Figure 4a shows the FITC PNA telomere probe fluorescence measurement from a typical donor in the CD14 myeloid, CD3+ CD4+ and CD3+CD4- cell populations. In all cases, the peak C.V. was low and unskewed, indicating good PNA probe hybridization. We also included a wide variety of internal controls for each experiment, including calf thymocytes (a long telomere control), Jurkat T cells (a short telomere control), and a standardized mononuclear cell control from a middle-aged donor. Figure 4b shows the telomere lengths for CD3+CD4-, CD3+CD4+ and CD14+ cell populations as a function of age for multiple donors. Linear regression analysis was performed as a first approximation for the age dependence of the telomere length. The slope for each cell population was found to be 42.8bp/year for CD3+CD4-, 41.8bp/year for CD3+CD4+ and 27.5bp/year for CD14+. While the changes in telomere length as a function of age were small, they all trended downward, and were consistent with previous observations (Rufer et al., 1998, 1999; Son et al., 2000). Sample-to-sample uniformity was also excellent, an important consideration in this frequently difficult-to-reproduce technique. Combining immunolabeling with telomere measurement also allowed interesting observations about phenotype-specific changes in telomere length. For example, the telomere length of the CD14+ cell population was always found to be higher than CD3+CD4+ or CD3+CD4- T cell subpopulations. A two tailed paired Student t test provided a p value of less than 10-5 showing the level of significance for this difference. The telomere length for the CD14+ cell population is found to be 17.7% higher on average than that of the CD3+ cells.
Figure 4.
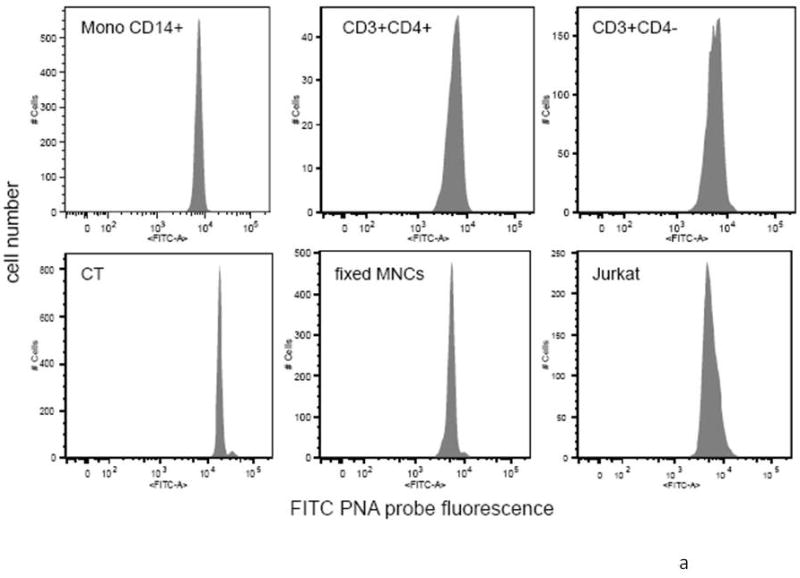
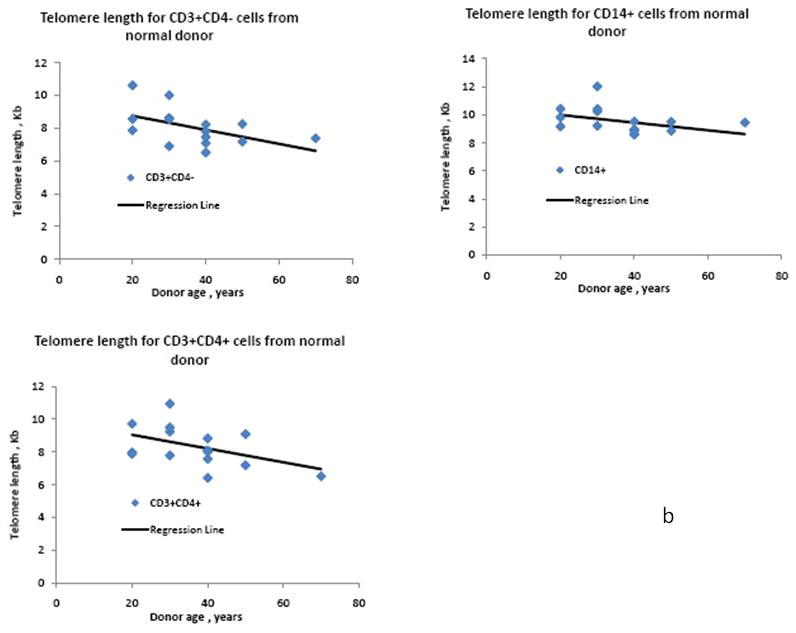
a: FITC PNA probe fluorescence for CD14+ monocytes, CD3+CD4+ and CD3+CD4-T cells (top row), calf thymocytes, normal donor MCs and Jurkat T cells (bottom row).
b: Telomere length as a function of the age of the healthy donors for the different cell populations: CD3+CD4-, CD3+CD4+ and CD14+ cells. The linear regression of the telomere length vs. age is reported for the different cell populations.
4. Conclusions
The results above show that FISH-flow analysis of telomere length can be done in combination with prior fluorescent immunophenotyping by using quantum dots as the fluorescent probes. Almost all traditional fluorescent probes, both low molecular weight and phycobiliproteins, are either lost or damaged following high heat treatment. The inorganic structure of quantum dots presumably makes them resistant to the harsh heating conditions required for PNA probe hybridization. Heat treatment did cause some loss of quantum dot labeling, but not at levels sufficient to impair the identification of the cell populations (Table I). Some traditional fluorochromes, including Alexa Fluor 647 were able to provide good separation without losing too much signal; however, the separation was less clear than with quantum dots, making analysis more ambiguous. Quantum dots and other heat stable fluorochromes therefore permit the extension of the present FISH-flow analysis to more complex cell populations, with better reproducibility and labeling stability than with organic fluorophores.
One important application of the present method is its capability to allow analysis of very small cell numbers. Prior cell sorting allows telomere length analysis on small cell subsets, but is severely limited by the small numbers of cells that can be derived. This can be problematic for flow-FISH labeling, where the ratio total cell concentration to the PNA probe concentration can have a dramatic effect on cell labeling. By combining telomere length measurement with immunolabeling, we can start with larger numbers of cells more typical for flow-FISH protocols, yet still measure telomere length in very small cell subsets. It should be emphasized that internal references are particularly important for this FISH-flow technique. The telomere length of the internal reference calf thymocytes can vary by up to 5% of its average value as observed in the present study, making it difficult to correlate multiple experiments. Using a stable internal reference limits this statistical error from the tube to tube and day to day analysis. The capability of analyzing very small volume sample combined with the use of stable internal reference cells will also make FISH-flow more applicable for clinical applications.
To check the validity of the combined immunolabeling method, the dependence of the telomere length with age was simultaneously tested for human PBMC CD3+CD4+, CD3+CD4- and CD14+ cell populations. The CD3+CD4+ cell population showed a rate of telomere length decrease of 41.8bp/year, similar to 35±8bp/year reported by Son et al. (2000) or to 39 to 51 bp/year reported by Rufer et al. (1999) for naïve and memory cells. The analysis of the CD14+ monocyte population also showed a decrease, but lower at a rate of 27.5bp/year. The simultaneous analysis of cell phenotype and telomere length can therefore provide interesting insights into telomere length difference between different cell populations within the same sample.
Acknowledgments
We acknowledge Dr. Suresh Dua, vetenary medical officer from the USDA/FSIS for providing access to the freshly collected calf thymus.
Abbreviations
- APC
allophycocyanin
- FISH
fluorescence in situ hybridization
- MNCs
mononuclear cells
- PBMCs
peripheral blood mononuclear cells
- PE
phycoerythrin
- PNA
peptide nucleic acid
- QD
quantum dot
Footnotes
Publisher's Disclaimer: This is a PDF file of an unedited manuscript that has been accepted for publication. As a service to our customers we are providing this early version of the manuscript. The manuscript will undergo copyediting, typesetting, and review of the resulting proof before it is published in its final citable form. Please note that during the production process errors may be discovered which could affect the content, and all legal disclaimers that apply to the journal pertain.
References
- Baerlocher GM, Mak J, Lansdorp PM. Telomere length measurement by fluorescence in situ hybridization and flow cytometry: tips and pitfalls. Cytometry A. 2002;47:89. doi: 10.1002/cyto.10053. [DOI] [PubMed] [Google Scholar]
- Baerlocher GM, Lansdorp PM. Telomere length measurements in leukocyte subsets by automated multicolor FISH-flow. Cytometry A. 2003;55A:1. doi: 10.1002/cyto.a.10064. [DOI] [PubMed] [Google Scholar]
- Baerlocher GM, Vulto I, de Jong G, Lansdorp PM. Flow cytometry and FISH to measure the average length of telomeres (FISH-flow) Nature Protocols. 2006;1:2365. doi: 10.1038/nprot.2006.263. [DOI] [PubMed] [Google Scholar]
- Blackburn EH. Telomere states and cell fates. Nature. 2000;408:53. doi: 10.1038/35040500. [DOI] [PubMed] [Google Scholar]
- Bulte JWM, Modo MMJ. Nanoparticles in Biomedical Imaging. Springer; New York, NY: 2008. Part 5 - Quantum dots: Applications in Optical Imaging; p. 413. [Google Scholar]
- Cong YS, Wright WE, Shay JS. Human telomerase and its regulation. Microbiol Mol Biol Rev. 2002;66:407. doi: 10.1128/MMBR.66.3.407-425.2002. [DOI] [PMC free article] [PubMed] [Google Scholar]
- Dahse R, Fielder W, Ernst G. Telomere and telomerase: biological and clinical importance. Clin Chem. 1997;43:708. [PubMed] [Google Scholar]
- Harley CB. Telomere loss: mitotic clock or genetic time bomb? Mut Res. 1991;256:271. doi: 10.1016/0921-8734(91)90018-7. [DOI] [PubMed] [Google Scholar]
- Hodes RJ. Telomere length, aging and somatic cell turnover. J Exp Med. 1997;190:153. doi: 10.1084/jem.190.2.153. [DOI] [PMC free article] [PubMed] [Google Scholar]
- Jamieson T, Bakhshi R, Petrova D, Pocock R, Imani M, Seifalian AM. Biological applications of quantum dots. Biomaterials. 2007;28:4717. doi: 10.1016/j.biomaterials.2007.07.014. [DOI] [PubMed] [Google Scholar]
- Kapoor V, Telford WG. Telomere Length Measurement by Fluorescence in Situ Hybridization and Flow Cytometry. In: Hawley TS, Hawley RG, editors. Flow Cytometry Protocols. Methods In Molecular Biology. Vol. 263. Humana Press; Totowa NJ: 2004. p. 385. [DOI] [PubMed] [Google Scholar]
- Lansdorp PM. Telomeres, stem cells, and hematology. Blood. 2008;111:1759. doi: 10.1182/blood-2007-09-084913. [DOI] [PMC free article] [PubMed] [Google Scholar]
- Morin GB. The implications of telomerase biochemistry for human disease. Eur J Cancer. 1997;33:750. doi: 10.1016/S0959-8049(97)00061-0. [DOI] [PubMed] [Google Scholar]
- Patolsky F, Gill R, Weizmann Y, Mokari T, Banin U, Willner I. Lighting-Up the Dynamics of Telomerization and DNA Replication by CdSe-ZnS Quantum Dots. J Am Chem Soc. 2003;125:13918. doi: 10.1021/ja035848c. [DOI] [PubMed] [Google Scholar]
- Poon SSS, Martens UM, Ward RK, Lansdorp PM. Telomere Length Measurements Using Digital Fluorescence Microscopy. Cytometry. 1999;36:267. doi: 10.1002/(sici)1097-0320(19990801)36:4<267::aid-cyto1>3.0.co;2-o. [DOI] [PubMed] [Google Scholar]
- Rufer N, Dragowska W, Thornbury G, Roosnek E, Lansdorp PM. Telomere length dynamics in human lymphocyte subpopulations measured by flow cytometry. Nat Biotechnol. 1998;16:743. doi: 10.1038/nbt0898-743. [DOI] [PubMed] [Google Scholar]
- Rufer N, Brummendorf TH, Kolvraa S, Bischoff C, Christensen K, Wadsworth L, Schulzer M, Lansdorp PM. Telomere fluorescence measurements in granulocytes and T lymphocyte subsets point to a high turnover of hematopoietic stem cells and memory T cells in early childhood. J Exp Med. 1999;190:157. doi: 10.1084/jem.190.2.157. [DOI] [PMC free article] [PubMed] [Google Scholar]
- Saldanha SN, Andrews LG, Tollefsbol TO. Assessment of telomere length and factors that contribute to its stability. Eur J Biochem. 2003;270:389. doi: 10.1046/j.1432-1033.2003.03410.x. [DOI] [PubMed] [Google Scholar]
- Sasaki DT, Maecker H, Trotter J. Establishing optimum baseline PMT gains to maximize resolution on BD Biosciences digital flow cytometers, application note, BD™. 2005 http://www.bdbiosciences.com/pdfs/whitePapers/23-8389-00.pdf.
- Schmid I, Dagarag MD, Hausner MA, Matud JL, Just T, Effros RB, Jamieson BD. Simultaneous flow cytometric analysis of two cell surface markers, telomere length, and DNA content. Cytometry. 2002;49:96. doi: 10.1002/cyto.10163. [DOI] [PubMed] [Google Scholar]
- Shay JW, Bacchetti S. A survey of telomerase activity in human cancer. Eur J Cancer. 1997;33:787. doi: 10.1016/S0959-8049(97)00062-2. [DOI] [PubMed] [Google Scholar]
- Shay JW, Wright WE. Hayflick, his limit, and cellular ageing. Nat Rev Mol Cell Biol. 2000;1:72. doi: 10.1038/35036093. [DOI] [PubMed] [Google Scholar]
- Shen X, Zhou J, Hathcock KS, Robbins P, Powell DJ, Jr, Rosenberg SA, Hodes RJ. Persistence of tumor infiltrating lymphocytes in adoptive immunotherapy correlates with telomere length. J Immunother. 2007;30:123. doi: 10.1097/01.cji.0000211321.07654.b8. [DOI] [PMC free article] [PubMed] [Google Scholar]
- Son NH, Murray S, Yanovski J, Hodes RJ, Weng NP. Lineage-specific telomere shortening and unaltered capacity for telomerase expression in human T and B lymphocytes with age. J Immumol. 2000;165:1191. doi: 10.4049/jimmunol.165.3.1191. [DOI] [PubMed] [Google Scholar]