

Abstract
The most significant impediment for protein structure prediction is the inadequacy of conformation space search. Conformation space is too large and the energy landscape too rugged for existing search methods to consistently find near-optimal minima. To alleviate this problem, we present model-based search, a novel conformation space search method. Model-based search uses highly accurate information obtained during search to build an approximate, partial model of the energy landscape. Model-based search aggregates information in the model as it progresses, and in turn uses this information to guide exploration towards regions most likely to contain a near-optimal minimum. We validate our method by predicting the structure of 32 proteins, ranging in length from 49 to 213 amino acids. Our results demonstrate that model-based search is more effective at finding low-energy conformations in high-dimensional conformation spaces than existing search methods. The reduction in energy translates into structure predictions of increased accuracy.
Keywords: Protein structure prediction, conformational space search, multiple energy functions, active learning, Rosetta, Monte Carlo
1 Introduction
The reliable prediction of protein structure from genetic information is an important challenge in structural biology. A solution to this challenge would provide insights into protein function and could greatly facilitate the design of therapeutic drugs.
Currently, researchers rely on X-ray crystallography and nuclear magnetic resonance (NMR) spectroscopy to determine protein structures. These methods are labor- and cost-intensive. As a result, the Protein Data Bank (PDB) [1] contains structural information for only a small fraction of the proteins with a known genetic sequence. If computational methods were able to predict protein structures efficiently and accurately, they could complement experimental methods, making structural information about proteins as readily available as sequence information.
Protein structure prediction methods have progressed substantially over the years [2, 3, 4, 5, 6, 7, 8, 9]. However, the inadequacy of conformation space search techniques remains a major challenge [10]. Due to the vast size of conformation space and the ruggedness of the protein energy landscape, existing search methods fail to find near-optimal minima in the energy landscapes of all but the smallest proteins. To enable general, accurate structure prediction, it is thus of paramount importance to devise conformation space search methods capable of efficiently finding near-optimal minima in high-dimensional conformation spaces.
The challenge of search in high-dimensional conformation spaces is exacerbated by the fact that any search method—no matter how effective—can only achieve accurate results if it relies on accurate information about the search problem. In the case of protein structure prediction, the most accurate information is captured by computationally expensive all-atom energy functions. Most existing protein structure prediction methods, however, rely on simplified, non-all-atom energy functions to alleviate the difficulties of conformation space search. We believe this inherently limits their ability to perform accurate structure prediction.
To illustrate the importance of accurate information for protein structure prediction, we predict the structure of retinoic acid binding protein (136aa) using two different prediction methods. Both prediction methods attempt to find low-energy conformations in an accurate, but non-all-atom energy function. The predictors differ in the conformation space search method they employ. The first predictor uses model-based search (MBS), our new conformation space search algorithm introduced in this paper. The second predictor uses simulated annealing Monte Carlo search (MC). Figure 1(a) compares the resulting predictions, showing that MBS finds lower-energy structures in the non-all-atom energy landscape than MC.
Figure 1.

Discrepancies between the non-all-atom and the all-atom energy function illustrate that accurate conformation space search must rely on all-atom information. (a) Structures found by model-based search (MBS) in the non-all-atom energy function are lower in energy than those found by a Monte Carlo-based method (MC). (b) These structures become energetically indistinguishable when evaluated in the all-atom energy function.
We evaluate the predictions obtained by both algorithms using an all-atom energy function. The resulting scatter plot is shown in Figure 1(b). We see that MBS’ predictions are energetically indistinguishable from those obtained using MC. Even though MBS is able to find lower-energy structures in the non-all-atom energy landscape, indicating more effective conformation space search, this advantage vanishes in the all-atom landscape. This implies that more effective search alone will not necessarily lead to improved prediction accuracy. To take advantage of more effective conformation space search, it is necessary to search a more accurate energy landscape.
In this paper, we present model-based search, a new conformation space search method for finding minima in protein energy landscapes. Model-based search combines highly effective conformation space search with the ability to perform search using highly accurate all-atom energy information. The improvements afforded by our approach are based on two main contributions. First, our method is more effective than previous methods at identifying and selecting the appropriate regions to focus resources. Second, enabled by the first contribution, our method is able to obtain high-quality all-atom information without incurring a significant performance penalty.
Experiments demonstrate that the combination of more effective conformation space search and highly accurate information results in the prediction of structures of lower energy than those predicted by one of the leading structure prediction protocols. We also show that this reduction in energy translates into more accurate structure predictions. Predictions for which reduced energy does not lead to improved prediction accuracy identify errors in the energy function and thus may lead to the improvement of these functions.
2 Related Work
The conformational space of proteins is too large to be searched exhaustively [11]. This is true even for small proteins. Conformation space search methods thus have to focus exploration on a small fraction of the search space. The ability to choose appropriate regions, i.e. regions that are highly likely to contain good minima, will critically affect the effectiveness of a search method. In this section, we review common conformation space search methods and examine how they guide the exploration of the conformation space towards regions of the energy landscape that are likely to contain good minima.
The most basic approach for conformation space search is the Metropolis Monte Carlo method [12]. It does not explicitly select regions of conformation space but instead guides the exploration of the search space towards low-energy regions. To achieve this, the Metropolis Monte Carlo method remembers only a single piece of information, namely the energy value of the current step. Based on this information, the next exploration step is accepted if the new conformation is lower in energy, and if the energy increases, the new conformation is rejected with probability proportional to the increase in energy.
The Metropolis Monte Carlo method is susceptible to local minima. Much of the ongoing work on conformation space search aims to overcome this problem. To increase the chances of escaping small local minima, simulated annealing [13, 14], for example, varies the probability of accepting increases in energy during different stages of the search. A number of other approaches maintain multiple samples with different step sizes and transition probabilities, also in an attempt to overcome the problem of local minima. These approaches include basin hopping [15, 16], jump walking [17], multi-canonical jump walking [18], and the replica exchange Monte Carlo method [19]. Even though these methods improve the effectiveness of conformation space search, they are subject to the same limitations as they direct exploration by the same principle as the Metropolis Monte Carlo method.
The performance of Metropolis Monte Carlo (MC) methods can be improved by reducing the number and the depth of local minima. To achieve this, one can smooth the protein’s energy landscape [20, 21]. This will have the desired effect on the local minima, but it will invariably introduce inaccuracies in the energy landscape. These inaccuracies are due to the merging or shifting of minima or may arise as a result of rank inversions [22]. In principle, smoothing is similar to simulated annealing methods: they make it easier to overcome the energy barriers between local minima, in particular during the early phases of the search. This insight has been confirmed by experimental studies [23].
Current methods for protein structure prediction employ smoothing in conjunction with Metropolis Monte Carlo-based search methods. Smoothing can be achieved with multi-resolution energy functions. Early stages of the search are conducted in a simpler, backbone-only energy function. As search progresses, the energy function becomes increasingly accurate, until an all-atom energy function is used to evaluate the final decoys [24]. MC methods use the backbone-only energy function to assemble the majority of a protein’s structure, and the all-atom energy function to make smaller structural changes and to evaluate prediction quality.
The combination of smoothing and Metropolis Monte Carlo-based search methods has proven very successful in practice and is currently the most widely used approach to conformation space search [7]. However, this combination of the two methods also inherits their disadvantages: MC methods only use a very limited amount of information (only the current energy value) to guide search, which due to smoothing is likely to be inaccurate, leading to the problem discussed in the introduction. In the next section, we will present our novel conformation space search method that addresses these problems. It avoids the problems of smoothing by including the most accurate information available (obtained using the all-atom energy function), and it uses much more information than MC methods to select the region of conformation space to search.
The two main hypotheses of our research are that 1) the selection of appropriate regions is the key to improving conformation space search, and that 2) this selection should be informed by as much highly accurate information as possible. Support for these hypotheses can be found in existing, successful search methods that have been developed both inside and outside of protein structure prediction.
Genetic algorithms [25] introduce the idea of maintaining multiple samples and exchanging information among them. This improves on the amount of information maintained by MC-based methods. Tabu search [26, 27, 28] maintains aggregate information about the entire history of the search to exclude so-called tabu regions from further exploration. These methods demonstrate that the information obtained during search can be beneficial in informing further exploration. Similar ideas can be found in conformation space annealing (CSA) [29] and Conformation-Family Monte Carlo (CFMC) [30], two conformation space search methods developed specifically for protein structure prediction. These methods monitor the state of multiple concurrent searches in order to ensure broad coverage of the search space.
Search is one of the foundational topics in the study of artificial intelligence (AI) [31]. It is thus not surprising that the idea of using information obtained during search to guide search has been studied extensively in AI. These methods aggregate information in what we will call a “model.” They then use this model to select those regions of the search space for exploration that are most likely to contain the sought minimum. Two such methods are STAGE [32] and MIMIC [33]. These methods use a model to make predictions about regions of the search space, even regions that have not been explored yet.
Another relevant area of research within artificial intelligence is active learning. In active learning, the goal is to learn a function from examples. The learner is able to interactively select training examples so as to maximize learning progress [34, 35]. Active learning requires a model to maintain information about the examples seen so far. But it also requires a strategy to select the best next example. Applied to conformation space search, such a strategy would redirect search from one region to another in response to the information obtained.
The method for conformation space search presented in the following section will draw inspiration from AI search and from active learning. We leverage relevant concepts in the context of protein structure prediction, where the search space is extremely high-dimensional and obtaining accurate information about this space is computationally expensive. Both of these characteristics impose the need to intelligently guide search so as to minimize required computational resources while maximizing the use of information obtained during search.
3 Model-Based Search
Effective conformation space search must guide exploration towards regions of conformation space likely to contain the global minimum. Consequently, the effectiveness of search is based on how accurately the relevant regions can be identified. The effectiveness of this identification, in turn, depends on the usage and accuracy of information.
We refer to the representation of relevant regions as a model of the energy landscape. At any point during the search, this model will represent an approximation to a small part of the energy landscape. The model contains important information that is leveraged by model-based search to guide exploration towards relevant regions of conformation space. Due to the central role of this model in making our conformation space search method accurate and efficient, we refer to our search method as model-based search.
Model-based search incrementally refines an initial coarse model of conformation space by incorporating new information obtained during an ongoing search. Information quality is critical to direct resources toward the correct regions of space. The acquisition of high quality information is driven by three core algorithmic elements described below. Figure 2 illustrates the use of these algorithmic elements for a single iteration of model-based search.
Figure 2.
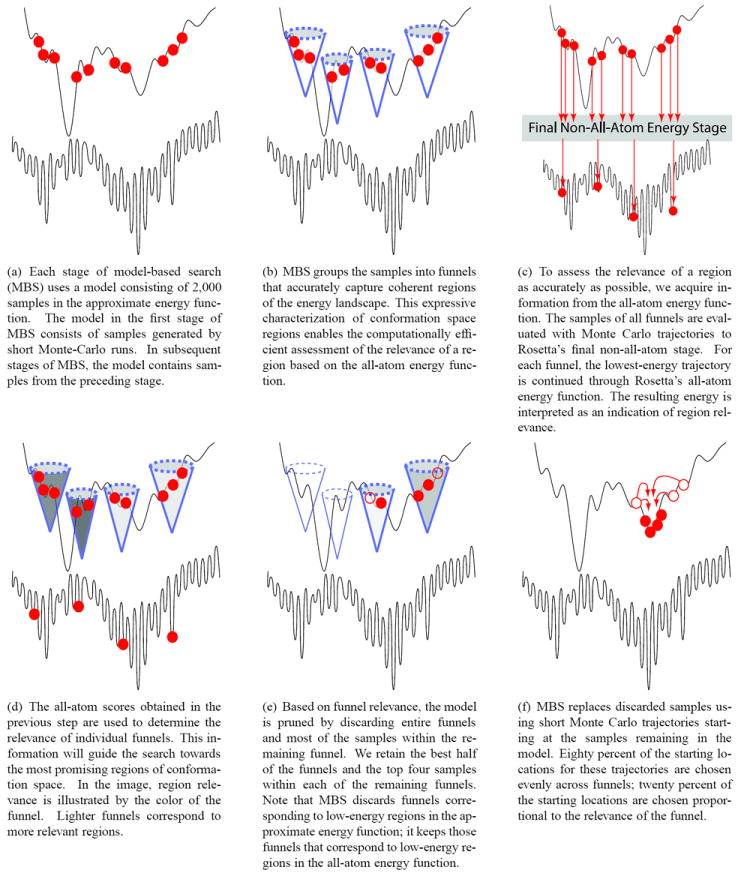
Step-by-step illustration of a single stage of model-based search. Each image contains two energy landscapes. Rosetta’s approximate energy function is shown on the top, Rosetta’s all-atom energy function on the bottom. Note that the global minimum in the approximate energy landscape does not correspond to the global minimum in the all-atom energy landscape.
Characterization of Regions as Funnels: At the core of model-based search is a method to identify meaningful regions of conformation space. Instead of viewing samples in isolation, our method groups samples so as to capture the funnel-like quality of the landscape (see Figure 2(b)). Section 3.1 describes how funnels can be computed efficiently, while accurately capturing coherent regions of the energy landscape with similar biological characteristics.
Assessment of Funnel Relevance: To assess the relevance of a region as accurately as possible, we acquire accurate information about that region. Since our method of determining regions ensures that all samples in a region share biological characteristics, we can draw conclusions about the relevance of an entire region based on high-accuracy information about carefully chosen samples. Figures 2(c) and 2(d) illustrate the efficient acquisition of information and how that information is used to assess the relevance of a region.
Coordination of computational resources: Once meaningful regions have been identified and the quality of each region has been assessed, we use this information to distribute computational resources in accordance with this assessment. Figures 2(e) and 2(f) illustrate this process.
In this section, we present model-based search as a general optimization method for high-dimensional spaces, making as few domain-specific assumptions as possible. The optimization algorithm is applicable to problems that exhibit spatial coherence and global variation. Spatial coherence means that the quality of a specific point in the solution space reveals information about its immediate neighborhood. Global variation means that there are significant differences between “good” and “bad” solutions in the search space. Together with spatial coherence, this implies that there are “good” and “bad” regions of space. The assumptions of spatial coherence and global variance, we believe, are quite general and are shared by many real-world problems.
We make one domain-specific assumption, namely that we are searching a series of related energy functions. Search of conformation space begins in a computationally efficient, low-accuracy energy function and incrementally progresses to a computationally costly, high-energy function. This technique is commonly applied in protein structure prediction [36]. This assumption is only required for the part of our search method described in Section 3.2. The overall search method remains valid even if this assumption does not hold and only a single energy function is searched.
The following three sections provide detailed descriptions of the algorithmic elements; Section 4 augments the description provided below with details about the implementation.
3.1 Characterization of Regions as Funnels
The notion of a conformation space region permits us to reason about large volumes of space as a single entity. This is much more effective than reasoning about individual samples. To reason about an entire region in a meaningful way, however, the conformations in that region have to share some relevant property. Only then will it be possible to assess the relevance of a region as a whole in a meaningful way.
Some existing clustering techniques used in CSA [29], CFMC [30], and SPICKER [37], incorporate high-dimensional spheres, or hyper-spheres, to describe regions of conformation space. Such a region is described by a point in conformation space (the center of the sphere) and a radius, usually given by the backbone RMSD in Ångstrom between two conformations. Such a hyper-sphere is a simple representation of conformation space volume but it is unlikely to exclusively capture parts of space that share a relevant property. The extent of a meaningful region will vary greatly along the different dimensions of the space. This holds true in particular in protein energy landscapes, where the motion of some degrees of freedom can cause very large variations in energy, whereas other degrees of freedom can move significantly without a major energetic effect. Consequently, a hypersphere will include regions with different properties, cause overlap between distinct regions, or even merge distinct regions of conformation space. Based on this inaccurate representation of conformation space regions, it is difficult to guide search effectively using conformation space techniques.
We propose the notion of funnels as a more accurate representation for conformation space regions. We know that the energy landscape of a protein contains many such funnels. The funnel shape implies that a Metropolis Monte Carlo run started at a point in a funnel has a higher probability of leading to the bottom of that funnel than of leaving it. We can thus view the entire funnel as the domain of attraction for the energetic minimum of the funnel. Hence, funnels represent a region of space in which all points share a property that is important for search: they can all be associated with the same local minimum in the energy landscape. Based on this well-established fact, we believe that funnels provide a characterization of conformation space regions appropriate for guiding search (see Figure 2(b)).
We identify funnels by exploiting the following simple observation: In low-energy regions of a funnel the spatial density of the samples resulting from Monte Carlo-runs will be high. As we approach the ridge of a funnel, the spatial density of samples decreases. The spatial density of samples obtained from Metropolis Monte Carlo thus captures the extent and energetic variation of the lower-energy region of the funnel. It is this lower-energy region that is most helpful for guiding search.
MBS identifies funnels using a heuristic clustering method. This method is computationally efficient and, more importantly, sensitive to density variations of samples in different dimensions of conformation space. Due to its ability to identify directional variations in sample density, our method can identify clusters of arbitrary shapes and varying local densities, even when they are close to each other. The method does not impose a particular representation for the funnel, such as a hypersphere, but lets the data determine the extent and shape of the conformation space region.
We now describe the details of the funnel finding algorithm. Starting with a set of conformation space samples, the lowest energy sample is selected as the root of a tree. We build a tree by adding samples to the tree in order of increasing distance to the root. A new sample will be connected to the closest node of the tree, as long as the distance between the new sample and the closest node does not exceed the average length of edges on the path between the node and the root of the tree by more than a constant factor. This insertion operation is illustrated in Figure 3. The tree-building algorithm terminates when all remaining samples are too far away from nodes in the tree to be added. The computed tree represents a funnel; the root of the tree is at the bottom of the funnel.
Figure 3.

Building a funnel from samples: The lowest-energy sample (solid gray) is chosen as the root of a tree. Samples are inserted in order of increasing distance to the root. To insert a new sample (black), the distance between the new sample, the root, and all of its children is considered. If the root is closest to the new sample, the sample is inserted as a child of the root. Otherwise, the process recurses on the child closest to the new sample. When a leaf is reached, the new sample is inserted as its child. Following this procedure, many sub-trees (gray outline) remain unexamined during the insertion.
This procedure is repeated, starting with the lowest-energy sample among the remaining samples, until all samples have been processed into trees.
We now have obtained trees of samples, each of which represents a funnel. Each funnel captures a meaningful region of conformation space. The shape of this region is determined by the properties of the underlying energy landscape. The connectivity of the tree and the degree of its vertices capture additional information about proximity, compactness, and transition characteristics between nearby samples. This illustrates the benefit of viewing samples in context rather than in isolation: the context reveals additional information highly relevant to our goal of effectively searching conformation space.
Our clustering method achieves expected O(n log n) time performance by sacrificing provable correctness of the clustering results. In our experience, the gain in efficiency by far outweighs the consequences of the slight inaccuracies in the resulting clusters.
3.2 Assessing Funnel Relevance
An accurate assessment of the relevance of a region is essential for effective conformation space search. Many of the funnels will prove to be irrelevant for search and should be discarded from our model. Among the remaining regions, we would like to allocate computational resources proportional to the estimated relevance of a region. Therefore, to guide conformation space search most effectively, we need a way to accurately evaluate the relevance of a conformation space region.
Our tree-based representation of funnels enables an efficient and highly accurate assessment of region relevance. The tree representation of samples provides us with a simple way of determining the size, shape, and sample density of funnels. These properties of the region, as well as the energy values of individual samples, reveal information about the relevance of a funnel. They can be combined in a variety of ways to estimate relevance. In this section, we do not focus on how to combine all available information to assess region relevance, but instead on how the accuracy of sample energy evaluation can be improved. The determination of region relevance based on all available information will be the subject of future work.
Model-based search enables the assessment of region relevance based on highly accurate all-atom energy evaluations. The algorithm achieves this by leveraging the funnel-based representation of the model. Regions in the model have been determined based on the property that local searches from most conformations in a region will be investigating the same minima. We exploit this property to assess the relevance of an entire region by assessing the relevance of several conformations inside the region. Due to the aforementioned property of the region, the quality (energy) of these samples provides information about the relevance of the entire region (see Figures 2(c) and 2(d)).
Model-based search assess the relevance of a region by determining the all-atom scores for the lowest-energy non-all-atom samples in the region. The all-atom score of a sample is determined by performing a Metropolis Monte Carlo run through increasingly accurate energy functions, including a final, highly accurate all-atom energy function (the details of this computation are described in Section 4). The best score of all evaluations determines the score of a region.
As the experiments presented in Section 5 will demonstrate, this procedure for assessing the relevance of a region greatly improves the accuracy and efficiency of conformation space search. The accuracy is improved because the assessment of relevance is based on the most accurate source of information available: an all-atom energy function. This accurate assessment of relevance would not be computationally feasible for all conformations generated during an entire conformation space search. By using a few costly all-atom computations to judge the relevance of entire regions of conformation space, however, the amortized computational cost is negligible. Information is leveraged very effectively to guide search towards important regions of conformation space.
3.3 Coordination of Resources
Model-based search allocates computational resources to regions based on their estimated relevance. If the assessment of region relevance were perfect, only a single region should be explored further. No assessment of region relevance would lead to an equal exploration of all regions. Model-based search attempts to find a middle-ground between these two extremes so as to guide search effectively while accounting for inaccuracies in assessment of region relevance by spreading computational resources.
Model-based search discards irrelevant regions and redundant samples to maintain computational efficiency (see Figure 2(e)). Available computational resources are divided into two parts. The first part is divided equally among all regions of the model. The second part of the computational resources is allotted to a region proportional to its estimated relevance. To replace discarded samples, model-based search initiates short Metropolis Monte Carlo trajectories from the samples remaining in the model. The resulting samples are added to the model (see Figure 2(f)).
4 Implementation
4.1 Integration with Rosetta
The focus of our research is the development of effective conformation space search techniques. To leverage existing software infrastructure, we have integrated model-based search with Rosetta [36, 24], a leading method for protein structure prediction that has repeatedly performed well in the CASP competition [38, 39, 40]. Our implementation replaces the simulated annealing Metropolis Monte Carlo search method implemented in Rosetta with model-based search, allowing us to rely on Rosetta’s energy function, local search methods, and infrastructure for representing proteins, etc.
Due to our integration with Rosetta, model-based search inherits the following algorithmic features. Rosetta uses the fragment assembly approach to reduce the size of the search space. Initial backbone-only samples are generated by setting all ϕ and ψ angles of the backbone to zero. Local search for low-energy conformations is started from this point in conformation space. The local search, based on the Metropolis Monte Carlo method, progresses in a number of stages. As the search progresses through the different stages, the move set changes, the number of local search steps are varied, and the accuracy of the energy function is increased. The initial move set replaces 9-mers of the backbone with candidate structures retrieved from the PDB. The move set then changes to 3-mers and finally to a full angle representation in later stages. The energy function progresses gradually from a coarse-grained low-resolution energy function that considers secondary structure, residue environment, and inter-residue pairing to a full-atom energy function that includes side chains and solvation effects. Additional details about the move sets, and energy functions can be found in the literature [36, 24].
4.2 Iterative Model Refinement
Each iteration of model-based search uses the same move set and energy function as the corresponding stage in Rosetta. Search begins with 2,000 extended structures. The first MBS stage occurs after an initial 4,000 Monte Carlo fragment insertions have been attemped for each sample. The remaining 32,000 Monte Carlo steps inside Rosetta are divided into 13 stages based on when terms are introduced into the approximate energy function.
4.3 Characterization of Regions as Funnels
The tree-based algorithm for finding funnels described in Section 3.1 only relies on a single parameter: the constant factor that determines whether or not a node is added to the tree. In our implementation we empirically chose that factor to be 1.2. Hence, a node is added to the tree if its distance to the closest node in the tree is less than 1.2 times the average length of edges between the root of the tree and the closest node.
Our implementation of the funnel-finding algorithm also terminates tree construction if more than 5% of all samples have been added to the tree. Furthermore, trees of less than 5 samples are merged with the closest funnel. Funnels that are too large are not helpful in differentiating between different regions of conformation space. Funnels represented by too few samples arise when most funnels have been discovered. The few remaining samples could not be added to any of the previously found funnels. They are likely to be distributed over the entire conformation space and do not represent a meaningful funnel in the energy landscape.
4.4 Assessing Funnel Relevance
Model-based search assesses the relevance of a region by gathering information about what energy level is attainable by local searches started in that region. The exact procedure is described in Section 3.2 and illustrated in Figure 2(c). To determine an estimate of the attainable energy level, model-based search continues the local searches for all samples in a funnel to the final non-all-atom energy stage in Rosetta. The computational cost of doing this is small, as the energy evaluations in non-all-atom energy functions are computationally efficient. Among the resulting samples, the best five are selected. For each of these, model-based search computes a computationally expensive all-atom energy score after adding side-chains to the backbone. The best of these scores is used as the energy score for the entire funnel.
The searches performed during this evaluation are entirely local; they run through the energy functions associated with the remaining stages of Rosetta, without being influenced by model-based search. To leverage the information obtained during these local searches, we remember a trace of the search for the best 80 full-atom energy evaluations. A trace contains the conformation at the transition points between the different energy functions. Once model-based search has progressed to a particular stage, the model is augmented with the conformations at that stage from those 80 traces.
The current implementation of model-based search estimates region relevance exclusively based on the full-atom energy score. In future research, we will investigate how region relevance can be evaluated by metrics such as funnel size and density.
4.5 Coordination of Resources
Resource allocation first occurs between funnels. The resources assigned to a funnel are then distributed among the samples within each funnel.
We begin by discarding 50% of the funnels in the model based on their relevance. Eighty percent of the computational resources are distributed evenly among the remaining funnels. The remaining 20% are distributed to funnels proportional to their relevance score. The increased emphasis on particular regions is amplified over multiple stages, increasing the focus on a consistently relevant region at an exponential rate.
Within each funnel we keep the four lowest-energy samples. Eighty percent of the computational resources assigned to a funnel are distributed evenly between these samples; the remaining 20% are distributed proportional to sample score.
5 Results and Discussion
In this section, we compare the effectiveness of model-based search (MBS) with that of simulated annealing Monte-Carlo search method (MC) implemented in Rosetta [36, 24]. By comparing with Rosetta, we achieve two objectives. First, since MBS uses the same energy function and local search as Rosetta, we are able to stage a fair test. Second, since the search method of Rosetta is highly optimized for protein structure prediction, we gain a realistic view of MBS’s performance in this domain. Rosetta’s performance in CASP indicates that the specific implementation of MC is equivalent in performance to other available search methods.
In our evaluation, MBS and MC rely on the same parameters wherever possible. MC and MBS go through a number of stages (see Section 4.1); in each stage they use the same move sets, and number of local search steps, and energy function. But whereas in MC all samples traverse all stages and these traversals proceed independently of each other, MBS orchestrates these trajectories, stopping some and splitting some into multiple trajectories in later stages. MBS also generates search trajectories for the evaluation of region relevance (see Section 4.4). As a result, MBS generates about 3,000 decoys when 2,000 samples are used in each stage of the model. Given the computational overhead of model maintenance in MBS, the computation time required to compute 3,000 MBS samples approximately corresponds to the time required to generate 4,000 MC decoys. Consequently we compare MBS searches with a model size of 2,000 samples with MC searches generating 4,000 decoys.
We would like to emphasize that our experiments are exclusively intended to evaluate the effectiveness of search. The main criterion for the evaluation of our experimental results given in Table 1 must therefore be the energy of samples produced by the search. The energy of the native state and for samples produced by MC and MBS are given in the columns labeled ENative, EMC, and EMBS, respectively.
Table 1.
The 32 proteins used in our experiments ordered by increasing length; columns contain the PDB code, protein length in amino acids, percentage of α-helix and β-sheet calculated by DSSP [42], and the number of homologs in the homolog move set. The next five columns list the energy of the lowest sample obtained for the native state (ENative), by using MC search (EMC), and by using MBS (EMBS) for both move sets, in parentheses is the average of the 100 lowest all-atom energy structures. The next four columns indicate the structural match between the lowest energy structure predictions by MC/MBS and the native state, measured as a percentage using GDT_TS [41]. The final column contains the category of the protein, referred to in our discussion. The protein category corresponding to the homolog free move set is given in parentheses.
| Protein Attributes | Energy of Best Sample | Structural Match with Native | ||||||||||||
|---|---|---|---|---|---|---|---|---|---|---|---|---|---|---|
| Homolog Move Set | Homolog Free Move Set | Homolog Move Set | Homolog Free Move Set | |||||||||||
| PDB | L | %α | % β | # homologs | ENative | EMC | EMBS | EMC | EMBS | GDT_TSMC | GDT_TSMBS | GDT_TSMC | GDT_TSMBS | cat. |
| 1b72 | 49 | 69 | 0 | 3 | -119 | -117 (-111) | -119(-112) | -114(-109) | -116 (-110) | 92 (90) | 95 (85) | 67 (70) | 57 (66) | 1 (4) |
| 1shf | 59 | 5 | 41 | 9 | -143 | -131 (-116) | -139 (-130) | -113 (-107) | -116 (-110) | 89 (73) | 92 (90) | 55 (49) | 48 (55) | 2 (4) |
| 2reb | 60 | 62 | 20 | 1 | -142 | -146 (-143) | -146 (-144) | -144 (-136) | -146 (-141) | 96 (93) | 94 (94) | 95 (85) | 88 (90) | 1 (1) |
| 1r69 | 61 | 64 | 0 | 2 | -148 | -146 (-141) | -145 (-142) | -143 (-137) | -147 (-140) | 96 (91) | 91 (91) | 74 (77) | 87 (83) | 1 (2) |
| 1csp | 67 | 4 | 54 | 1 | -151 | -143 (-132) | -147 (-140) | -138 (-126) | -137 (-128) | 69 (56) | 91 (75) | 53 (50) | 69 (53) | 2 (4) |
| 1di2 | 69 | 46 | 33 | 1 | -156 | -154 (-151) | -154 (-150) | -149 (-142) | -151 (-146) | 86 (92) | 93 (91) | 64 (65) | 66 (64) | 1 (4) |
| 1n0u | 69 | 43 | 25 | 1 | -155 | -141 (-132) | -139 (-135) | -138 (-132) | -138 (-133) | 64 (50) | 47 (54) | 68 (45) | 41 (44) | 4 (4) |
| 1mla | 70 | 34 | 37 | 1 | -156 | -154 (-142) | -154 (-150) | -143 (-137) | -141 (-137) | 95 (60) | 95 (95) | 44 (47) | 49 (47) | 1 (4) |
| 1af7 | 72 | 72 | 0 | 1 | -171 | -167 (-161) | -173 (-167) | -171 (-161) | -169 (-163) | 38 (51) | 38 (38) | 38 (50) | 39 (41) | 3 (3) |
| 1dcj | 73 | 32 | 27 | 0 | -163 | -140 (-130) | -154 (-141) | -142 (-134) | -149 (-141) | 64 (59) | 71 (64) | 67 (67) | 68 (68) | 2 (4) |
| 1dtj | 74 | 39 | 27 | 1 | -162 | -161 (-150) | -169 (-163) | -151 (-143) | -165 (-160) | 95 (81) | 92 (92) | 64 (54) | 86 (84) | 2 (2) |
| 1o2f | 77 | 39 | 27 | 0 | -177 | -168 (-153) | -166 (-159) | -161 (-153) | -164 (-156) | 40 (39) | 40 (41) | 43 (40) | 39 (41) | 4 (4) |
| 1mky | 81 | 32 | 25 | 0 | -182 | -171 (-153) | -168 (-162) | -166 (-154) | -167 (-159) | 68 (45) | 53 (54) | 46 (45) | 50 (49) | 4 (4) |
| 2hfq | 83 | 30 | 29 | 0 | -187 | -179 (-168) | -185 (-178) | -176 (-166) | -182 (-174) | 49 (40) | 45 (41) | 39 (40) | 48 (47) | 4 (4) |
| 1tig | 88 | 35 | 35 | 1 | -198 | -200 (-196) | -204 (-199) | -191 (-178) | -195 (-189) | 95 (92) | 95 (94) | 54 (52) | 52 (55) | 1 (4) |
| 1hhp | 99 | 7 | 48 | 3 | -216 | -196 (-179) | -210 (-203) | -188 (-177) | -189 (-180) | 80 (36) | 84 (83) | 20 (19) | 18 (19) | 2 (4) |
| 2hg6 | 103 | 35 | 21 | 0 | -211 | -208 (-198) | -222 (-213) | -210 (-200) | -211 (-203) | 23 (22) | 21 (22) | 20 (22) | 21 (22) | 3 (3) |
| 1pva | 109 | 57 | 0 | 12 | -260 | -246 (-237) | -262 (-257) | -246 (-234) | -247 (-237) | 54 (39) | 92 (88) | 33 (29) | 30 (30) | 2 (4) |
| 1elw | 116 | 79 | 0 | 7 | -302 | -297 (-292) | -297 (-293) | -291 (-281) | -290 (-283) | 88 (92) | 97 (95) | 57 (62) | 55 (62) | 1 (4) |
| 1bm9 | 120 | 54 | 12 | 1 | -260 | -284 (-272) | -290 (-272) | -282 (-270) | -279 (-270) | 27 (27) | 28 (27) | 29 (27) | 20 (24) | 3 (3) |
| 2h5n | 123 | 70 | 0 | 0 | -291 | -281 (-268) | -288 (-280) | -277 (-269) | -283 (-276) | 26 (27) | 33 (32) | 28 (27) | 28 (30) | 4 (4) |
| 1jb2 | 123 | 29 | 49 | 1 | -275 | -246 (-234) | -265 (-255) | -236 (-218) | -247 (-234) | 82 (46) | 79 (71) | 31 (26) | 46 (41) | 2 (4) |
| 8rat | 124 | 21 | 33 | 6 | -238 | -218 (-201) | -227 (-219) | -211 (-194) | -223 (-210) | 20 (24) | 24 (23) | 18 (19) | 19 (19) | 4 (4) |
| 2j6a | 135 | 33 | 16 | 1 | -283 | -257 (-243) | -261 (-254) | -258 (-241) | -257 (-246) | 23 (20) | 21 (19) | 24 (20) | 18 (21) | 4 (4) |
| 1cbr | 136 | 13 | 57 | 7 | -305 | -276 (-266) | -290 (-280) | -277 (-263) | -281 (-271) | 31 (36) | 72 (56) | 30 (42) | 31 (31) | 2 (4) |
| 1aly | 139 | 2 | 51 | 3 | -223 | -241 (-227) | -263 (-245) | -247 (-227) | -259 (-246) | 17 (17) | 18 (19) | 12 (17) | 18 (20) | 3 (3) |
| 1h3q | 140 | 34 | 25 | 0 | -311 | -291 (-279) | -306 (-297) | -292 (-276) | -303 (-291) | 27 (25) | 26 (27) | 29 (24) | 30 (29) | 4 (4) |
| 1oo0 | 144 | 34 | 34 | 0 | -340 | -287 (-271) | -303 (-293) | -285 (-267) | -292 (-281) | 24 (22) | 18 (24) | 21 (22) | 29 (26) | 4 (4) |
| 1kd6 | 166 | 8 | 39 | 0 | -290 | -310 (-295) | -334 (-324) | -308 (-293) | -321 (-308) | 15 (16) | 16 (17) | 15 (16) | 18 (17) | 3 (3) |
| 1ad6 | 180 | 70 | 0 | 1 | -403 | -387 (-376) | -396 (-386) | -387 (-375) | -388 (-380) | 33 (26) | 34 (29) | 24 (25) | 24 (24) | 4 (4) |
| 1qdl | 195 | 25 | 35 | 3 | -464 | -379 (-354) | -409 (-396) | -366 (-345) | -380 (-362) | 50 (25) | 48 (47) | 18 (17) | 23 (23) | 2 (4) |
| 3cla | 213 | 30 | 29 | 1 | -390 | -395 (-374) | -433 (-412) | -399 (-376) | -412 (-396) | 14 (17) | 20 (19) | 18 (17) | 21 (19) | 3 (3) |
| ( ) = Top 100 structures | ||||||||||||||
In recent work, Bradley and Baker [2] make highly accurate structure predictions, using an order of magnitude more samples than we use in our experiments. Our experiments thus do not give a representative view of the prediction quality obtained by Rosetta. Our experiments demonstrate that MBS searches the energy function of Rosetta more effectively than the MC search implemented in Rosetta, given an equal amount of computational resources. The performance increase of MBS relative to MC will become more pronounced when the number of samples is increased, because MBS coordinates the search of conformation space whereas in MC all samples are treated independently.
For our experimental evaluation, we chose 32 proteins of varying size and secondary structure composition. These proteins were selected from recent CASP competitions, from experiments performed by Bradley and Baker [10], and from the PDB. The list of proteins is shown in Table 1. Search was conducted with two move sets: one excludes fragments from proteins homologous to our prediction target, the other one includes these fragments. Both move sets contain 200 fragments at each position, however, the homology move set contains fragments more structurally similar to the native structure of the prediction target.
Homology information in the fragment library simplifies the search problem because it introduces a structural bias towards homologous structures. Search using a homology move set thus leads to lower energy samples and more accurate structure predictions. Irrespective of the move set, MBS search outperforms MC search (see Figure 4).
Figure 4.

Homology information in the move set greatly improves the effectiveness of search. With and without homology information, MBS finds lower-energy samples and more accurate predictions than MC.
To obtain native-like structures for comparison, we run 100 relaxations on the all-atom structures found in the PDB. We determine structural similarity between the native state and predictions using the total score of the global distance test (GDT_TS) [41]; the score is reported in percent with 100% being a complete match between structures. When RMSD is reported, it refers to all-atom RMSD calculated by PyMOL given in Ångstrom. To assess the energy of points in conformation space, we use the unit-less number returned by Rosetta’s all-atom energy function.
For the discussion of our results we divide the proteins into four categories. Category 1 contains proteins for which both MBS and MC make accurate predictions. The second category encompasses proteins for which MBS found lower-energy structures and made more accurate structure predictions. For proteins in category 3, MBS found structures that were lower in energy than the native state, pointing to inaccuracies in the energy function. Finally, category 4 contains proteins for which neither MBS nor MC can find structures comparable to the native state in terms of energy or structural similarity. In the remainder of this section, we discuss the findings for these four categories in detail.
Category 1: Adequate Conformation Space Search
For the seven proteins in category 1 (see Table 1), model-based search (MBS) and Monte Carlo (MC) perform equivalently. Both find structures with an RMSD less than 1.5Å away from the native state. Proteins in this category are relatively small (less than 116 amino acids). It is plausible that the conformation spaces for these proteins are relatively easy to search. Obviously, if MC search finds the global minimum of the energy landscape, MBS cannot improve the result.
Figure 5 shows samples generated by MC and by MBS for three representative proteins from category 1. The scatter plots indicate that both MC and MBS find conformations in the bottom right of the graph, where the structural match with native structures is very high and the energy is low.
Figure 5.

For proteins in category 1 both MC and MBS adequately search conformation space, resulting in near-native structure predictions. Each point in the scatter plots represents a conformation space sample. MC samples and native structures samples are drawn on top of MBS samples. These results were obtained using the homolog move set.
It should be noted that for one protein (434 repressor, 1r69) MC finds a lower energy samples than MBS (see Table 1). The lower energy of the MC sample can be attributed to the stochastic nature of the search.
Category 2: Improved Conformation Space Search
Category 2 consists of proteins for which MBS searches conformation space more effectively than MC. When the homolog move set was used, nine of the 32 proteins fell into this category. Using the homolog-free move set, only two proteins fell into this category. For all proteins in this category, MBS finds lower-energy samples than MC; these samples correspond to higher-accuracy structure predictions. These proteins range in size between 59 and 195 amino acids.
The improvement of MBS over MC is illustrated in the scatter plots in Figure 6. Samples generated by MBS are lower in energy and in many cases overlap the energy of the relaxed native structure.
Figure 6.

For the proteins of category 2, MBS outperforms MC. MBS finds lower-energy samples and these samples match the structure of the native protein more closely than the samples obtained by MC. These results were obtained using the homolog move set.
The lower energy predictions generated by MBS result in more accurate structures. This is illustrated for two proteins using the homolog move set in Figure 7 and two proteins using the homolog-free move set in Figure 8. Note that the structure prediction shown in Figure 7(c) corresponds to the scatter plot shown in Figure 6(e). The lowest-energy samples found by MBS only achieve a GDT_TS of 72; nevertheless, with an RMSD of 2.7Å the prediction is quite accurate.
Figure 7.

Predicted structures for proteins from from category 2 using the homolog move set (color), superimposed on native structures from the PDB (gray): EF Hand parvalbumin (109aa, PDB: 1pva) predicted with MBS (a) and with MC (b); retinoic acid binding protein (136aa, PDB: 1cbr) predicted with MBS (c) and with MC (d).
Figure 8.

Predicted structures for proteins from category 2 using the homolog move set (color), superimposed on native structures from the PDB (gray): 434 Repressor (61aa, PDB: 1r69) predicted with MBS (a) and with MC (b); KH domain of Nova-2 (74aa, PDB: 1dtj) predicted with MBS (c) and with MC (d).
The only protein in category 2 that is not accurately predicted is Anthanilate Synthase (1qdl). With a length of 195 amino acids, this is the second-largest protein in our test set. The scatter plot in Figure 6(f) shows that the samples generated by MBS seem to lie on a trajectory towards the native state but get stuck before reaching it. These results indicate either that conformation space search still remains inadequate for proteins of this length or that the energy function is inaccurate.
Category 3: Inaccurate Energy Function
For six proteins model-based search finds conformations with lower all-atom energy than that of the native state, regardless of the move set. The scatter plots shown in Figure 9 illustrate this for two of the six proteins. In the case of Cher domain 1 (Figure 9(a)), both MC and MBS find samples with a high GDT_TS score. However, samples in the highest-density region exhibit little structural similarity to the native state. These samples have lower energy than the native protein. Figure 9(b) illustrates this phenomenon even more strikingly: both search methods and move sets find conformations considerably lower in energy than the native structures.
Figure 9.
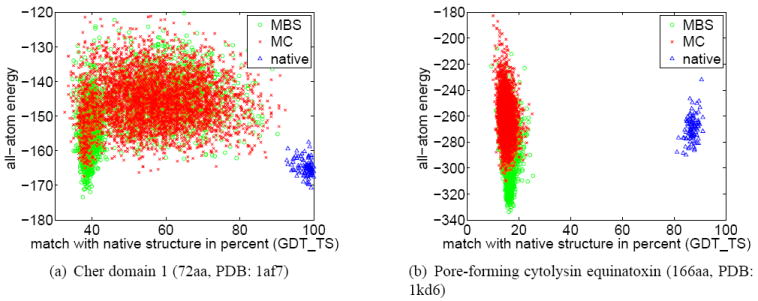
For proteins in category 3 MBS finds conformations with lower energy than the native state, pointing to inaccuracies in the energy function. These results were obtained using the homolog move set.
These results obtained for proteins in category 3 show that MBS searches conformation space more effectively than MC. However, for proteins in this category, the reduced energy of samples does not result in accurate predictions. This is a consequence of inaccuracies in the energy function. An inaccurate energy function guides search towards wrong regions of conformation space. No matter how much search is improved, it will not be able to compensate for these inaccuracies.
Model-based search may serve as a tool to improve energy functions. Once inaccuracies are identified, using the results of accurate conformation space search, it may be possible to identify and correct inaccurate components of the energy function.
Category 4: Inadequate Conformation Space Search
This last category of proteins is the most interesting one. For all proteins in this category neither MC nor MBS adequately searches the conformation space. Using the homolog move set, ten proteins of varying sizes (from 69 to 180 amino acids) fall into this category. Using the homology-free move set, 24 of the 32 proteins are in this category. This large number indicates that search becomes very difficult when the information contained in homologous fragments is not available to the search.
Relative to the results for proteins in category 2, the structural match with the native state is very poor. A comparison of the scatter plots in Figures 6(f) and 9 also reveals a qualitatively different behavior of search between categories 2 and 4, i.e. between successful search and unsuccessful search. The samples generated for category 4 proteins do not form a trajectory towards the native state, whereas those for category 2 do. This difference is particularly apparent in Figure 10(b), where search seems to be unable to access large regions of the conformation space.
Figure 10.

For proteins in category 4 neither MBS nor MC search conformation space adequately. These results were obtained using the homolog move set.
Category 4 seems to point to a fundamental problem with model-based search. If none of the samples in the initial model of MBS are close to native state, the search conducted by MBS will focus on regions not containing the native state of the protein. Overcoming this problem seems to be the key to further improvements of conformational space search based on MBS.
A previous study [10] also achieved poor prediction quality for three proteins from category 4, even though an order of magnitude more all-atom samples were used. This indicates that a mere intensification of sampling does not lead to a discovery of the conformation space region containing the native state. Also, since the size of category 4 proteins varies significantly, we believe that the size of the conformation space is not the main source of this problem either.
We have two hypotheses that may explain the problem encountered by MBS. The first hypothesis states that proteins in category 4 have energy landscapes with a narrow funnel leading to the native state. The second hypothesis states that inaccurate intermediate energy functions may steer search away from the region containing the native structure.
The narrow funnel hypothesis explains why category 4 contains short as well as longer proteins. Already for small proteins, the conformation space is too large for search to accidentally discover a small region that represents the entrance to the funnel, unless the energy landscape contains large regions that slope towards it.
The narrow funnel hypothesis emphasizes the importance of understanding residual native structure present in the denatured states of proteins. Biological proteins exhibit residual structure as a consequence of interactions among side-chains in close proximity along the backbone. In contrast, MBS has to discover this structure by random assembly of fragments, a proposition of vanishingly small probability. This probability is reduced even further when homologs are excluded from the move set, explaining the large increase in the number of category 4 proteins when homologs are removed from the move set.
It should be noted that for such narrow funnels, MC-based search with random restarts may in some cases have a higher probability of discovering the entrance to the funnel. We observe this in three of the ten proteins in category 4 for experiments using the homolog move set (elongation factor 2, glucose permease IIBC, and enga protein).
The second hypothesis is also consistent with our observations. To find the entrance to the folding funnel in the all-atom energy function, the energy function of stage i must lead samples into the correct funnel of the energy function at stage i + 1. This may not hold for proteins in category 4: assume that search at stage i, MBS identifies the correct minimum of the energy function. If local search in the energy function at stage i + 1 does not lead to the global minimum when started from the minimum of stage i, search will be guided away from the native structure and is unlikely to recover from it, no matter whether MC or MBS is used as the search strategy. Therefore, our second hypothesis states that for category 4 proteins the global minima in consecutive energy functions are shifted, preventing search from identifying the correct folding funnel.
This second hypothesis, if true, may be an indication that conformation space search is no longer the most pressing problem in protein structure prediction. It may be equally important to leverage the capabilities provided by MBS to further improve the accuracy of the approximate energy functions.
6 Conclusion
Conformation space search remains a major obstacle on the path towards accurate protein structure prediction. A second challenges is the computational expense associated with accurate energy evaluations, defined by an all-atom energy function. To reduce this computational burden, many structure predictors simplify the energy function, at least in initial stages of the search. These simplifications can misdirect search and thus represents another important difficulty for conformation space search.
In this paper, we presented a conformation space search method, called model-based search, which addresses the aforementioned challenges. Model-based search uses information acquired during search to identify regions of conformations space most likely to contain the global minimum. By focusing on these promising regions, only small parts of the conformation space have to be searched in detail. The reduction of the search space improves the effectiveness of conformation space search.
Model-based search uses an all-atom energy function to evaluate the importance of a region. By using all-atom information instead of information from a simplified energy function, model-based search identifies regions with more biological relevance than could have been found with the simplified energy function. As a result, the reduction of search space allows search to examine more relevant regions while excluding the unimportant parts of the search space.
We demonstrate that model-based search finds lower-energy conformations in protein energy landscapes than other conformation space search methods. The reduction in energy results in improved accuracy of the corresponding protein structure predictions. The experimental results discussed in this paper also point to important directions for future improvements of conformation space search.
Acknowledgments
This work is supported in part by the National Institutes of Health (NIH) under grant NIGMS 1R01GM076706 and by National Science Foundation (NSF) under grants CNS 0551500 and CCF 0622115. We are grateful for this support. We thank David Baker from the University of Washington, the Baker Lab, and the many contributors to Rosetta for making the Rosetta source code available. We thank Adam Zemla from the Lawrence Liver-more National Laboratory for making LGA available for the analysis of results. Finally, we are grateful for many helpful discussions with Lila Gierasch from the University of Massachusetts Amherst and with the members of the Gierasch Lab.
References
- 1.Protein Data Bank. http://www.pdb.org.
- 2.Bradley P, Chivian D, Meiler J, Misura KMS, Rohl CA, Schief WR, Wedemeyer WJ, Schueler-Furmann O, Murphy P, Schonbrun J, Strauss CEM, Baker D. Rosetta predictions in CASP5: Successes, failures and prospects for complete automation. Proteins: Structure, Function, and Bioinformatics. 2003;53(Suppl. 6):457–468. doi: 10.1002/prot.10552. [DOI] [PubMed] [Google Scholar]
- 3.Venclovas Č, Zemla A, Fidelis K, Mould J. Assessment of progress over the casp experiments. Proteins: Structure, Function, and Bioinformatics. 2003;53(Suppl. 6):585–595. doi: 10.1002/prot.10530. [DOI] [PubMed] [Google Scholar]
- 4.Petrey D, Honig B. Protein structure prediction: Inroads to biology. Molecular Cell. 2005 December;20:811–819. doi: 10.1016/j.molcel.2005.12.005. [DOI] [PubMed] [Google Scholar]
- 5.Chivian D, Kim DE, Malmström L, Schonbrun J, Rohl C, Baker D. Prediction of CASP6 structures using automated robetta protocols. Proteins: Structure, Function, and Bioinformatics Suppl. 2005;7:157–166. doi: 10.1002/prot.20733. [DOI] [PubMed] [Google Scholar]
- 6.Zhang Y, Arakaki AK, Skolnick J. TASSER: An automated method for the prediction of protein tertiary structure in CASP6. Proteins: Structure, Function, and Bioinformatics Suppl. 2005;7:91–98. doi: 10.1002/prot.20724. [DOI] [PubMed] [Google Scholar]
- 7.Moult J. A decade of CASP: Progress, bottleneck and prognosis in protein structure prediciton. Current Opinion in Structural Biology. 2005;15(3):285–289. doi: 10.1016/j.sbi.2005.05.011. [DOI] [PubMed] [Google Scholar]
- 8.Kryshtafovych A, Venclovas Č, Fidelis K, Moult J. Progress over the first decade of casp experiments. Proteins: Structure, Function, and Bioinformatics Suppl. 2005;7:225–236. doi: 10.1002/prot.20740. [DOI] [PubMed] [Google Scholar]
- 9.Hung L-H, Ngan S-C, Samudrala R. De novo protein structure prediction. In: Xu Y, Xu D, Liang J, editors. Computational Methods for Protein Structure Prediction and Modeling 2. Springer Verlag; 2007. pp. 43–64. [Google Scholar]
- 10.Bradley P, Misura KMS, Baker D. Toward high-resolution de novo structure prediction for small proteins. Science. 2005;309(5742):1868–1971. doi: 10.1126/science.1113801. [DOI] [PubMed] [Google Scholar]
- 11.Levinthal C. Are there pathways for protein folding? Journal de Chimie Physique. 1968;65(1):44–45. [Google Scholar]
- 12.Metropolis N, Ulam S. The monte carlo method. Journal of the American Statistical Association. 1949;44(247):335–341. doi: 10.1080/01621459.1949.10483310. [DOI] [PubMed] [Google Scholar]
- 13.Kirkpatrick S, Gelatt CD, Jr, Vecchi MP. Optimization by simulated annealing. Science. 1983;220(4598):671–680. doi: 10.1126/science.220.4598.671. [DOI] [PubMed] [Google Scholar]
- 14.Okamoto Y. Protein folding problem as studied by new simulation algorithms. Recent Research Developments in Pure & Applied Chemistry. 1998:1. [Google Scholar]
- 15.Li Z, Scheraga HA. Monte carlo-minimization approach to the multiple-minima problem in protein folding. Proceedings of the National Academy of Sciences. 1987 October;84(19):6611–6615. doi: 10.1073/pnas.84.19.6611. [DOI] [PMC free article] [PubMed] [Google Scholar]
- 16.Wales D, Doye J. Global optimization by basin-hopping and the lowest energy structures of lennard-jones clusters containing up to 110 atoms. Journal of Physical Chemistry A. 1997 June;101(28):5111–5116. [Google Scholar]
- 17.Frantz DD, Freeman DL, Doll JD. Reducing quasi-ergodic behavior in Monte Carlo simulations by J-walking: Applications to atomic clusters. Journal of Chemical Physics. 1990;93(4):2769–2784. [Google Scholar]
- 18.Xu H, Berne BJ. Multicanonical jump walking: A method for efficiently sampling rough energy landscapes. Journal of Chemical Physics. 1999;110(21):10299–10306. [Google Scholar]
- 19.Swendsen RH, Wang J-S. Replica Monte Carlo simulation of spin-glasses. Physical Review Letters. 1986;57(21):2607–2609. doi: 10.1103/PhysRevLett.57.2607. [DOI] [PubMed] [Google Scholar]
- 20.Peila J, Kostrowicki J, Scheraga HA. The multiple-minima problem in the conformational analysis of molecules deformation of the potential energy hypersurface by the diffusion equation method. Journal of Physical Chemistry B. 1989:93. [Google Scholar]
- 21.Zhang Y, Kihara D, Skolnick J. Local energy landscape flattening: Parallel hyperbolic Monte Carlo sampling of protein folding. Proteins: Structure, Function, and Genetics. 2002;48(2):192–201. doi: 10.1002/prot.10141. [DOI] [PubMed] [Google Scholar]
- 22.Pappu RV, Hart RK, Ponder JW. Analysis and application of potential energy smoothing and search methods for global optimization. Journal of Physical Chemistry B. 1998;102:9725–9742. [Google Scholar]
- 23.Hart RK, Pappu RV, Ponder J. Exploring the similarities between potential smoothing and simulated annealing. Journal of Computational Chemistry. 2000 January;21(7):531–552. [Google Scholar]
- 24.Rohl CA, Strauss CEM, Misura KMS, Baker D. Protein structure prediction using Rosetta. Methods in Enzymology. 2004;383:66–93. doi: 10.1016/S0076-6879(04)83004-0. [DOI] [PubMed] [Google Scholar]
- 25.Holland JH. Adaptation in Natural and Artificial Systems. The University of Michigan Press; Ann Arbor, USA: 1975. [Google Scholar]
- 26.Glover F, Laguna F. Tabu Search. Kluwer Academic Publisher; 1997. [Google Scholar]
- 27.Ulrich HE, Hansmann LTW. Global optimization by energy landscape paving. PRL. 2002;88(6):068105. doi: 10.1103/PhysRevLett.88.068105. [DOI] [PubMed] [Google Scholar]
- 28.Paluszewski M, Hamelryck T, Winter P. Reconstructing protein structure from solvent exposure using tabu search. Algorithms for Molecular Biology. 2006 October;1:1–14. doi: 10.1186/1748-7188-1-20. [DOI] [PMC free article] [PubMed] [Google Scholar]
- 29.Lee J, Scheraga HA, Rackovsky S. New optimization method for conformational energy calculations of polypeptides: Conformational space annealing. Journal of Computational Chemistry. 1997;18(9):1222–1232. [Google Scholar]
- 30.Pillardy J, Czaplewski C, Wedemeyer WJ, Scheraga HA. Conformation-family monte carlo (CFMC): An efficient computational method for identifying the low-energy states of a macromolecule. Helvetica Chimica Acta. 2000;83:2214–2230. [Google Scholar]
- 31.Russell S, Norvig P. Artificial Intelligence: A Modern Approach. 2. Prentice Hall; 2002. [Google Scholar]
- 32.Boyan JA. Technical Report CMU-CS-98-152. School of Computer Science, Carnegie Mellon University; 1998. Learning evaluation functions for global optimization. [Google Scholar]
- 33.Bonet JSD, Isbell CL, Jr, Viola P. MIMIC:fining optima by estimating probability densities. In: Mozer MC, Jordan MI, Petsche T, editors. Advances in Neural Information Processing Systems. Vol. 9. MIT Press; 1997. p. 424. [Google Scholar]
- 34.MacKay D. Information-based objective functions for active data selection. Neural Computation. 1992;4(4):590–604. [Google Scholar]
- 35.Cohn DA, Ghahramani Z, Jordan MI. Active learning with statistical models. Journal of Artificial Intelligence Research. 1996;4:129–145. [Google Scholar]
- 36.Bonneau R, Strauss CEM, Rohl CA, Chivian D, Bradley P, Malmström L, Robertson T, Baker D. De novo prediction of three-dimensional structures for major protein families. Journal of Molecular Biology. 2002;322(1):65–78. doi: 10.1016/s0022-2836(02)00698-8. [DOI] [PubMed] [Google Scholar]
- 37.Zhang Y, Skolnick J. SPICKER: A clustering approach to identify near-native protein folds. Journal of Computational Chemistry. 2004 April;25(6):865–871. doi: 10.1002/jcc.20011. [DOI] [PubMed] [Google Scholar]
- 38.Moult J, Hubbard T, Fidelis K, Pedersen JT. Critical assessment of methods of protein structure prediction (CASP): round III. Proteins: Structure, Function, and Genetics. 1999;37(Suppl. 3):2–6. [PubMed] [Google Scholar]
- 39.Moult J, Fidelis K, Zemla A, Hubbard T. Critical assessment of methods of protein structure prediction (CASP): round IV. Proteins: Structure, Function, and Bioinformatics. 2001;45(Suppl. 5):2–7. [PubMed] [Google Scholar]
- 40.Moult J, Fidelis K, Zemla A, Hubbard T. Critical assessment of methods of protein structure prediction (CASP)–Round V. Proteins: Structure, Function, and Genetics. 2003;53(Suppl. 6):334–339. doi: 10.1002/prot.10556. [DOI] [PubMed] [Google Scholar]
- 41.Zemla A. LGA: A method for finding 3D similarities in protein structure. Nucleic Acids Research. 2003;31(13):3370–3374. doi: 10.1093/nar/gkg571. [DOI] [PMC free article] [PubMed] [Google Scholar]
- 42.Kabsch W, Sander C. Dictionary of protein secondary structure: pattern recognition of hydrogen-bonded and geometrical features. Biopolymers. 1983 December;22(12):2577–637. doi: 10.1002/bip.360221211. [DOI] [PubMed] [Google Scholar]