

Abstract
In this paper we present trap profile measurements for HeLa cells in Optoelectronic Tweezers (OET) based on a data projector. The data projector is used as a light source to illuminate amorphous Si creating virtual electrodes which are used to trap particles through dielectrophoresis. We show that although the trap stiffness is typically greater at the edges of the optical spot it is possible to create a trap with constant trap stiffness by reducing the trap’s size until it is similar to the object being trapped. We have successfully created a trap for HeLa cells with a constant trap stiffness of 3×10⁻⁶ Nm−1 (capable of moving the cell up to 50 μms−1) with a 12 μm diameter trap. We also calculate the depth of the potential well that the cell will experience due to the trap and find that it to be 1.6×10⁻¹⁶J (4×10⁴ kBT).
1. Introduction
Optoelectronic tweezers (OET) are a relatively new micromanipulation technique that complement the established techniques of Optical Tweezers (OT) and Dielectrophoresis (DEP). OET uses the dielectrophoretic force to manipulate particles, however, the metal electrodes, that are usually used in DEP, are replaced by ‘virtual electrodes’ created by selectively illuminating areas of a thin film of photoconductive material (see Fig. 1). These virtual electrodes can then be moved giving the real time continuous control of particles. This continuous control is one of the features of OT that has made it a popular technique however OT requires very high light intensities. The reduced intensity necessary for OET give us the ability to perform massively parallel manipulation of microparticles, with the creation of up to 15,000 traps at once [1], and to create traps with stiffness similar to OT whilst using 500 times less optical power [2]. It has been shown that OET can be used to manipulate live cells [3–8], nanowires [9], DNA [10, 11] and even gas bubbles [12]. Another method for DEP trapping with no metal electrodes is by using the pyroelectric effect [13].
Fig. 1.
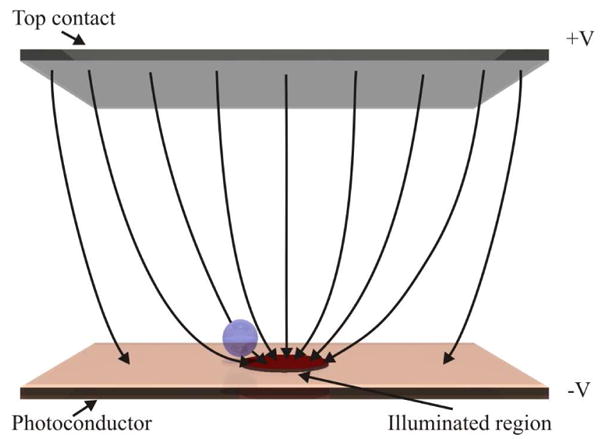
The OET device. Schematic showing the OET chamber consists of a top contact and a bottom photoconductive substrate with an illuminated region.
Previous work has shown that the properties of the trapped objects are among the factors determining the size and shape of the OET trap. In this report we will specifically look at the properties of cell traps. Using positive DEP, where particles are attracted to the high field region, increasing the power of the incident light has been shown to increase both the strength and the size of an OET trap [3]. In this work we will keep the illumination intensity constant whilst changing the size of the illuminated region and study the effect on the trapped cell. The maximum lateral distance at which cells are affected by the trap has been measured [4] however the forces experienced by cells within the trap have not previously been studied. To study these forces we exert drag forces on the trapped cell by moving the OET chamber with respect to the light pattern. This has been shown to allow the plotting of force versus position profiles of the trap, allowing the calculation of trap stiffness [2].
The light patterns used in these experiments are created by focusing the pattern from a data projector through a 20x microscope objective. The optical pattern created is of constant intensity across the illuminated region which is very different from the Gaussian profile of a laser spot that has previously been studied [2]. The intensity profile of the optical pattern is an important parameter as gradients in the optical image create gradients in the electrical field which in turn produce the force (see Section 3). The optical gradients used here are much lower than would be required for an OT which demonstrates the power of OET as a low intensity technique, not requiring tight focusing of the light, but retaining full control of the position and shape of the trap.
2. Experimental results
The optical setup consisted of a data projector (2400MP, DELL) focused into a 20x objective (N.A. 0.42) within a microscope constructed from Thorlab’s 30mm cage system. The OET device consisted of two ITO plates spaced 120 μm apart, the bottom plate being coated with 1 μm of hydrogenated amorphous silicon. An A.C. voltage of 20V peak to peak was applied at 100kHz. When the OET chamber is moved with respect to the light pattern the drag force on the trapped particle is countered by the DEP force. Due to the cell’s low mass the force required to accelerate the cell is insignificant compared to the viscous drag forces e.g. a force of just 1.67×10⁻¹⁵ N could accelerate the cell to 50 μms−1 in the time between video frames if there were no viscous forces present. This compares to viscous forces in the pN range. By increasing the velocity whilst measuring the particle’s position within the trap until the particle falls out of the trap, a force profile can be found [2]. However, as will be discussed later, the force profile of the trap varies with height above the amorphous silicon (a-Si) photoconductor. As the particle rests on the lower surface this means that different size particles will experience not just different magnitude forces but different shape traps. Therefore, the force profile should be designed for the particle of interest. One of the main proposed applications for OET is in the manipulation of biological cells so in this work we use a standard cell type, HeLa cells, as analyte. Figure 2 shows HeLa cells being trapped by a 73 μm diameter trap and a 12 μm trap at increasing velocities. It can be seen that when the trap is much larger than the cell, the cell does not experience any force in the centre of the trap but moves to the edge of the trap even at low velocities. When the trap is similar in size to the cell, the particle is only moved from the centre of the trap at higher velocities. The force on the cell can be calculated from Stokes drag force. As the cell is close to a surface we must also use Faxen’s correction [2]. The cell is assumed to be spherical and touching the lower surface. The viscosity of the liquid is assumed to be 1mPas. The position of the particle is measured by recording a video of the particle being trapped at a constant velocity and then using particle tracking software to measure the displacement from the centre of the trap. We can the plot the force verses position profile of each trap, as shown in Fig. 3.
Fig. 2.

A trapped cell. Video frames from an experiment showing the light pattern, outlined in red, being used to trap the HeLa cell, outlined in white, at velocities A) and D) 10 μms−1, B) and E) 30 μms−1, C) and F) 50 μms−1. A) to C) show a spot diameter of 73 μm, where the optical spot is large compared to the size of the cell it moves to the edge of the optical spot even at low velocities. D) to F) show a 12 μm diameter spot, here the trap is similar size to the cell and it stays central at low velocities. X is the lateral distance between the center of the cell and the center of the trap, which are indicated by vertical lines.
Fig. 3.
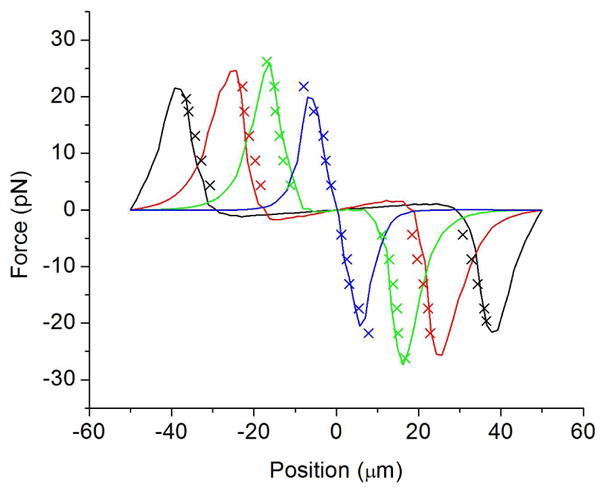
Trap profile results. The experimental results are plotted as crosses and compared to numerical simulations plotted as solid lines for optical spot diameters 73 μm (black), 49 μm (red), 31 μm (green), 12 μm (blue).
Figure 3 shows that the cells could be trapped at up to 60 μms−1 (26.2 pN) with the 31 μm diameter trap and 50 μms−1 (21.8 pN) with the other spots. For small displacements the larger traps exhibit zero force on the particle. This is not good for fine control of the cell as the trap must be moved far before the cell feels any force. The 12 μm diameter trap shows that it is possible to create a trap with constant trap stiffness, which will allow fine control over the position of the cell, the stiffness created was 3×10⁻⁶ Nm−1. Figure 3 also shows the results of simulations where the cell is assumed to be 3.5 μm from the surface, the reasons for this distance are discussed in section 3.
3. Simulations
It has been shown that the electrical field gradients created in OET can be numerically modeled by using the Finite Element Method (FEM) [2,3]. Here the electric fields within the OET chamber are modeled and the resulting gradient of the square of the electric field is used to find the DEP force using the well-know equation [6];
| (1) |
Where εm is the permittivity of the medium, Re[k(ω)] is the Clausius-Mossotti factor and ∇ E2 is the gradient of the electrical field squared [6]. The Clausius-Mossotti factor is given by;
| (2) |
where and are the complex permittivities of the particle and medium respectively and ω is the angular frequency. The relation between the real permittivity and complex permittivity is given by ε* = ε − j(σ/ω) with ε the permittivity and σ is the conductivity. Whilst this approach gives good agreement between experimentally measured forces and the simulated forces for small homogeneous particles the modeling of cells is more complicated as the structure of a cell is more complicated. A reasonable approximation can be made by modeling the cell as a single shell of low conductivity material surrounding a highly conductive core [15,16].
Dielectrophoretic force can either be positive (pDEP), towards areas of high electric field, or negative (nDEP), away from these areas depending on the sign of the Clausius-Mossotti factor. A cell will experience nDEP at low frequencies and pDEP at high frequencies crossing over at a certain frequency. This crossover frequency is dependent on the physical properties of the suspending medium and the cell. Some of the properties can be deduced by measuring this frequency in liquid of varying conductivity [16]. Cultured HeLa cells were removed from a substrate with trypsin before being re-suspended in an isotonic sugar solution [1]. By adding varying amounts of cell culture medium to the solution the conductivity was varied from 3.2 to 2.2×10⁻²Sm−1 and the crossover frequency was measured as shown in Fig. 4. The range of conductivities that can be explored is limited by the response of the OET chamber with higher conductivities giving a reduction in the force [14]. The trap stiffness experiments shown earlier in this paper were performed in 1×10⁻²Sm−1 media at 100kHz giving a positive force.
Fig. 4.

Simulations of DEP. The experimentally measured crossover frequency is plotted as points along side simulated lines for a conductive core (radius 7.5 μm, relative permittivity 50, and conductivity 0.53Sm−1) surrounded by a single shell of; A. Conductivity 0.87 μSm−1, thickness varying from 20 to 1 nm from top to bottom curves. B. Thickness 5nm and conductivity varying from 0.1 to 3 μSm−1 from top to bottom curves. The relative permittivity of the medium was assumed to be 78.
These experimental results were compared to a single shell model in MATLAB. The effect of the cell’s insulating shell is accounted for by defining an effective permittivity for the core-shell structure that is given by [15];
| (3) |
Where and are the complex permittivities of the core and shell, respectively, and r1 and r2 are their radii. This effective permittivity can then be used in place of the particle’s permittivity in Equation 2 [6], allowing us to calculate the Clausius-Mossotti factor. Using values for the permittivity and conductivity of the cell’s cytoplasm and membrane from the literature (cytoplasm εr = 50 σ = 0.53 Sm−1, membrane, εr = 7 σ = 1 μSm−1 [6, 7]), the crossover frequency for varying medium conductivities can be modeled. It was found that to fit the simulations with the experimentally measured crossover frequencies a membrane conductivity of 0.87 μSm−1 and thickness of 5nm gave the best agreement. This is consistent with value from the literature where the membrane thickness has been measured as 4.97±0.2nm by scanning electron microscopy [17]. These values give us a Clausius-Mossotti factor of 0.8 at 1×10⁵ Hz, the frequency the experiments were performed at. To calculate the force it is now just necessary to find ∇ E2. 3D numerical simulations were performed in COMSOL Multiphysics (COMSOL) with the light spot being modeled as a saturated Gaussian that matches the profiles measured from the optical spots from the experiments. These saturated Gaussians are entered into COMSOL as profiles in conductivity of the a-Si varying from 1×10⁻⁶Sm−1 to 1.5×10⁻⁴Sm−1 the dark and illuminated conductivities of the a-Si, respectively (see Fig. 5). These are the conductivities measured for an illumination power of 2.5Wcm−2, the intensity produced by our data projector when reduced through a 20x objective.
Fig. 5.

Measured light patterns and simulated forces. A) The profile of the optical spots are plotted as crosses and compared to saturated Gaussian curves plotted as solid lines for optical spot diameters 73 μm (blue), 49 μm (red), 31 μm (green), 12 μm (black). B) Simulated force profile at 1 μm (green curve, reduced by a factor of 10), 3.5 μm (red curve, reduced by a factor of 4) and 7.5 μm (blue curve, reduced by a factor of 4/3) above the surface of the OET chamber. The experimental points for the 31 μm trap are shown as crosses.
The size and shape of the optical profiles were measured by recording video of the trap and analyzing a frame in a graphics package (National Instruments Vision Assistant). As the images of the traps were projected in red, the red pixel value is used as a measure of the projected light intensity. The optical profiles are shown in Fig. 5(a) and it can be seen that the measured optical profiles match well with saturated Gaussian curves. It has been shown that the conductivity of the photoconductor is proportional to the illumination intensity [14].
Figure 5(b) shows the experimental results for the 31 μm diameter trap plotted against the simulated forces at different heights from the a-Si surface. As the cells have a diameter of 15 μm, one might expect the simulated forces at 7.5 μm from the surface to match the experimental data. However it was found that the shapes of the experimental and simulated traps at this height did not match well.
Using ∇ E2 at 7.5 μm above the a-Si surface is effectively assuming that this value does not vary over the volume of the cell or that the higher forces near the OET surface are cancelled by the lower forces further from the a-Si so that the value half way up the cell is a good average. This is not a valid assumption in this case as the cell is large compared to the distance over which the gradients vary and the force profile closer to the surface is different from the profile further from the a-Si so that the two effects do not cancel each other. From Fig. 5(b) it can be seen that the force profile at 7.5 μm from the surface is close to an ideal trap profile where the force is proportional to the displacement, a trap that could be represented with a constant spring constant over the central part of the trap. This means that once the trap is moved a small amount the trapped particle would immediately feel a restoring force pushing it towards the center of the trap. The experimental results however show a trap that is completely flat in the centre and the particle does not experience a force until it is several microns from the centre of the trap. This is similar to the force profiles lower down in the trap, closer to the a-Si. Here ∇ E2 is greater so to compare the trap profiles the magnitude of the gradients has to be reduced. It was found that the profile at 3.5 μm above the a-Si matched the measured trap profiles surprisingly well when reduced by a factor of four for all four traps, as shown in Fig. 3. As the cell is not visibly deformed the extra force can’t be due to the cell being pulled closer to the surface although this may have a small effect. This factor of four is simply the amount that the force at 3.5 μm from the a-Si is greater than the average force over the volume of the cell. The simplicity of this modeling method gives us an incredibly useful tool for future experiments allowing us to accurately predict the force on the cell and hence design light patterns that will translate into the patterns of force we desire. One such desirable pattern is a simple ideal trap with a constant spring constant as mentioned earlier. Figure 3 shows that this can be produced by reducing the size of the optical spot to 12 μm. Although reducing the illuminated area to this extent does reduce the maximum force that can be exerted by 17%, the stiffness is the same. In this case the trap stiffness is 3×10⁻⁶ Nm−1 and the maximum velocity that can be achieved is 50 μms−1 with the 12 μm trap.
An analytical expression can be fitted to the numerically simulated force profile. It was found that a 3rd order polynomial could be fitted with good agreement. This expression can then be integrated to find the work done by the trap on the particle which can then be used to find the potential energy. Figure 6 shows the potential energy landscape that the particle experiences due to the trap. The depth of the potential well is found to be 1.6×10⁻¹⁶J (4×10⁴ kBT).
Fig. 6.

Potential energy well. The potential energy well experienced by the trapped HeLa cell is calculated from the force verses position profile for the 12 μm diameter trap. The depth of this potential energy well is 1.6×10⁻¹⁶ J.
4. Conclusions
In this paper we have shown that the profile of an OET trap varies with height from the a-Si surface. This is important since different size particles will experience different trap profile from highly non-linear traps to ideal traps that can be described by a single spring constant. We find that the behavior of HeLa cells can be predicted through numerical modeling with surprising accuracy by simply considering the force at 3.5 μm from the surface, reduced by a factor of four. Using this information, we show that it is possible to create an ideal trap where the force is proportional to the distance from the trap centre for HeLA cells in a 12 μm trap. The resulting trap has a spring constant of 3×10⁻⁶ Nm−1, and is capable of moving the cell up to 50 μms−1. We also calculate the potential energy well that the cell experiences due to the trap and find the depth of the well to be 1.6×10⁻¹⁶J.
Acknowledgments
The authors would like to thank the UC Berkeley Cell Culture facility for providing the cells used in this study and the UC Berkeley Microlab where all devices were fabricated. This work was funded by the Center for Cell Control, a National Institute of Health Nanomedicine Development Center under grant #PN2 EY018228.
Footnotes
OCIS codes: (350.4855) Optical tweezers or optical manipulation
References and links
- 1.Chiou PY, Ohta AT, Wu MC. Massively parallel manipulation of single cells and microparticles using optical images. Nature. 2005;436:370–372. doi: 10.1038/nature03831. [DOI] [PubMed] [Google Scholar]
- 2.Neale SL, Mazilu M, Wilson JIB, Dholakia K, Krauss TF. The resolution of optical traps created by light induced dielectrophoresis (LIDEP) Opt Express. 2007;15:12619–12626. doi: 10.1364/oe.15.012619. [DOI] [PubMed] [Google Scholar]
- 3.Chiou PY, Ohta AT, Wu MC. Toward all optical lab-on-a-chip system: optical manipulation of both microfluid and microscopic particles. Proceedings of the SPIE. 2004;5514:73–81. [Google Scholar]
- 4.Lu YS, Huang YP, Yeh JA, Lee C, Chang YH. Controllability of non-contact manipulation by image dielectrophoresis. Opt Quantum Electron. 2005;37:1385–1395. [Google Scholar]
- 5.Hwang H, Choi YJ, Choi W, Kim SH, Jang J, Park JK. Interactive manipulation of blood cells using a lens-integrated liquid crystal display based optoelectronic tweezers system. Electrophoresis. 2008;29:1203–1212. doi: 10.1002/elps.200700415. [DOI] [PubMed] [Google Scholar]
- 6.Ohta AT, Chiou PY, Phan HL, Sherwood SW, Yang JM, Lau ANK, Hsu HY, Jamshidi A, Wu MC. Optically controlled cell discrimination and trapping using optoelectronic tweezers. IEEE J Sel Top Quantum Electron. 2007;13:235–243. [Google Scholar]
- 7.Ohta AT, Chiou PY, Han TH, Liao JC, Bhardwaj U, McCabe ERB, Yu F, Sun R, Wu MC. Dynamic Cell and Microparticle Control via Optoelectronic Tweezers. J Microelectromech Syst. 2007;16:491–499. [Google Scholar]
- 8.Hsien-Chang C, Chao-Hung C, Cheng IF, Chi-Chang L. Manipulation of Bioparticles on Electrodeless Dielectrophoretic Chip Based on AC Electrokinetic Control. Nano/Micro Engineered and Molecular Systems; 2nd IEEE International Conference on (2007); 2007. pp. 1175–1178. NEMS’07. [Google Scholar]
- 9.Jamshidi A, Pauzauskie PJ, Schuck PJ, Ohta AT, Chiou PY, Chou J, Yang PD, Wu MC. Dynamic manipulation and separation of individual semiconducting and metallic nanowires. Nature Photonics. 2008;2:85–89. doi: 10.1038/nphoton.2007.277. [DOI] [PMC free article] [PubMed] [Google Scholar]
- 10.Hoeb M, Radler JO, Klein S, Stutzmann M, Brandt MS. Light-induced dielectrophoretic manipulation of DNA. Biophys J. 2007;93:1032–1038. doi: 10.1529/biophysj.106.101188. [DOI] [PMC free article] [PubMed] [Google Scholar]
- 11.Chou CF, Tegenfeldt JO, Bakajin O, Chan SS, Cox EC, Darnton N, Duke T, Austin RH. Electrodeless dielectrophoresis of single- and double-stranded DNA. Biophys J. 2002;83:2170–2179. doi: 10.1016/S0006-3495(02)73977-5. [DOI] [PMC free article] [PubMed] [Google Scholar]
- 12.Ohta AT, Jamshidi A, Valley JK, Hsu HY, Wu MC. Optically actuated thermocapillary movement of gas bubbles on an absorbing substrate. Appl Phys Lett. 2007;91:074103–074103. doi: 10.1063/1.2771091. [DOI] [PMC free article] [PubMed] [Google Scholar]
- 13.Grilli S, Ferraro P. Dielectrophoretic trapping of suspended particles by selective pyroelectric effect in lithium niobate crystals. Appl Phys Lett. 2008;92:3. [Google Scholar]
- 14.Valley JK, Jamshidi A, Ohta AT, Hsan-Yin H, Wu MC. Operational regimes and physics present in optoelectronic tweezers. J Microelectromech Syst. 2008;17:342–350. doi: 10.1109/JMEMS.2008.916335. [DOI] [PMC free article] [PubMed] [Google Scholar]
- 15.Hughes MP. Nanoelectromechanics in engineering and biology. CRC Press; 2003. [Google Scholar]
- 16.Minerick AR, Zhou RH, Takhistov P, Chang HC. Manipulation and characterization of red blood cells with alternating current fields in microdevices. Electrophoresis. 2003;24:3703–3717. doi: 10.1002/elps.200305644. [DOI] [PubMed] [Google Scholar]
- 17.Hollinshead M, Vanderplasschen A, Smith GL, Vaux DJ. Vaccinia virus intracellular mature virions contain only one lipid membrane. J Virol. 1999;73:1503–1517. doi: 10.1128/jvi.73.2.1503-1517.1999. [DOI] [PMC free article] [PubMed] [Google Scholar]