Abstract
Neurons in diverse brain areas can respond to the interruption of a regular stimulus pattern by firing bursts of spikes. Here we describe a simple model which permits such responses to periodic stimuli over a substantial frequency range. Focusing on the omitted stimulus response (OSR) in isolated retinas subjected to periodic patterns of dark flashes, we develop a pharmacologically-based model which accounts for resonances in ON bipolar cells. The bipolar cell terminal contains an LRC oscillator whose inductance is modulated by a transient calcium concentration, thus adjusting its resonant frequency to approximately match that of the stimulus. The model reproduces ganglion cell outputs, which sum the ON and OFF bipolar pathways, and it responds to omitted flashes with approximately constant latencies, as observed experimentally.
Keywords: bipolar cell, calcium tuning, ganglion cell, LRC circuit, omitted stimulus response, resonance
1 Introduction
Many neural circuits generate responses that embody simple predictions about future events, including cortical networks (Sutton et al., 1967; Klinke et al., 1968; Rogers et al., 1992; Bullock and Karamürsel, 1994; Friedman et al., 2001; Busse and Woldorff, 2003; Jääskeläinen et al., 2004), cerebellar loops (Bullock et al., 1993; Bell et al., 1997), midbrain dopamine systems (Schultz et al., 1997; Schultz, 1998), and subcortical visual pathways (Bullock et al., 1990; Bullock and Karamürsel, 1994; Prechtl and Bullock, 1994; Berry II et al., 1999; Hosoya et al., 2005; Schwartz et al., 2007a; Schwartz et al., 2007b). A particularly simple and vivid example of such pattern recognition occurs when a repetitive sequence is interrupted or ends. Such pattern violations generate characteristic voltage signatures on the human scalp called the omitted stimulus potential or the mismatch negativity (Bullock and Karamürsel, 1994; Klinke et al., 1968), which has been associated with the detection of novelty (Friedman et al., 2001; Rogers et al., 1992; Jääskeläinen et al., 2004). However, the phenomenon does not require higher brain areas or extensive networks: it has been seen in the retina (Bullock et al., 1990; Karamürsel and Bullock, 1994), and recent in vitro studies have shown that it can be robustly and precisely generated by ganglion cells, where it has been called the omitted stimulus response (OSR) (Schwartz et al., 2007a; Schwartz and Berry II, 2008).
Here we focus on the ganglion cell OSR, which has been observed in response to sequences of periodic flashes over the frequency range 6 – 20 Hz, and we investigate a generic mechanism which may be responsible for it. Using a linear model, we show that adaptive conductance dynamics, driven by transient calcium release in ON bipolar cell terminals, can allow a simple peripheral sensory circuit to tune a resonator to respond to interruptions in periodic stimuli over a substantial frequency range.
The paper is organized as follows. We review the OSR in §2, and in §3 describe the resonator mechanism, which builds on standard linear-nonlinear models for the early visual system. An approximate analysis reveals its tuning properties and guides parameter selection, and we confirm that the model reproduces basic experimental phenomena. §4 contains results of simulations and comparisons to experimental OSR data and we summarise and discuss further implications of the work in §5. While certain details are specific to the OSR, we believe that the underlying principles will be generally useful in the study of subthreshold resonant and oscillatory response to periodic stimuli, and to inputs from other oscillatory circuits. Resonance, adaptive tuning and signal cancelation may also contribute to pattern violation detection in other subcortical and cortical areas.
There is a substantial literature on intrinsic oscillatory and resonant properties in both neural circuits and in single neurons. For background on specific ion channels and basic physiological mechanisms, see (Llinas, 1988; Hutcheon and Yarom, 2000; Llinas and Steriade, 2006). For calcium-gated potassium channels similar to those modeled here, see (Llinas and Yarom, 1986). A more detailed Hodgkin-Huxley type model of thalamic neurons, including multiple calcium and calcium-activated currents, is developed in (Hutcheon et al., 1994).
2 Omitted stimulus response in isolated retinas
In experiments reported in (Schwartz et al., 2007a; Schwartz and Berry II, 2008), periodic sequences of dark flashes were presented to salamander and mouse retinas in vitro and ganglion cell responses recorded. Sequences were interrupted either by omitting a flash or by terminating the sequence; the OSR occurred in both cases for a subset of the ganglion cells. The population response latency measured with respect to the time of the last flash shifted to later times as the stimulus period increased, but latency relative to the time of the missing flash was constant, suggesting that ganglion cells respond to the omission of a flash from a predictable sequence. Typical cells only produced an OSR over a part of the 6 to 20 Hz range probed in the experiments. At higher frequencies, the timing of the OSR for individual cells shifted continuously as the stimulus period changed, keeping the latency from omitted flash to response constant (Schwartz and Berry II, 2008). At lower frequencies, the timing of the OSR for individual cells shifted in a predictive fashion, but did not always change proportionally with the stimulus period.
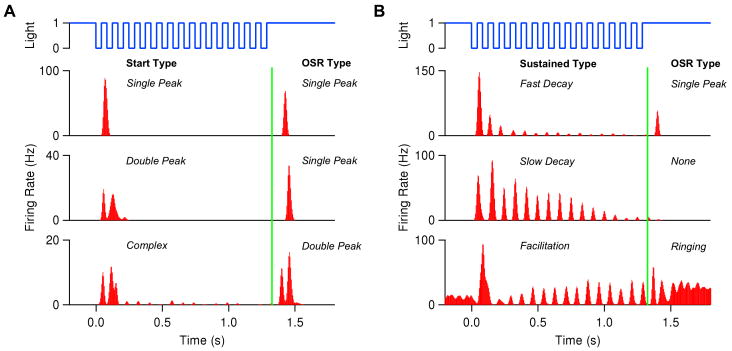
Fig. 1 shows typical ganglion cell firing patterns in response to a train of dark flashes with ≈ 50% duty cycle. Those on the left are “start-end” cells that respond strongly to the first and the omitted flashes; those on the right exhibit sustained responses that either decay or grow during the body of the sequence. Although the spike trains of each ganglion cell are reproducibly locked to the stimulus, responses exhibit great variability from cell to cell, e.g., the cell at center right produces essentially no OSR, while that at bottom right rings repeatedly, showing evidence of resonant activity.
Figure 1.
Typical ganglion cell firing patterns in response to a train of 16 dark flashes, each of duration 42 ms, at 12 Hz. Vertical green lines indicate time of omitted flash onset.
Pharmacological studies have shown that blocking the inhibitory effects of amacrine cells does not eliminate the OSR, although it leads to an increase in overall firing rates. However, blocking ON bipolar cell responses using the mGluR6 agonist APB eliminates the OSR, which recovers upon APB washout (Schwartz and Berry II, 2008). This strongly suggests that ON bipolar cells are essential to the phenomenon. Some ganglion cells had a ringing OSR, with two or more peaks of firing, as shown in the lower panels of Fig. 1, and many cells that produced an OSR also exhibited period-doubling during the flash sequence (Schwartz and Berry II, 2008) (not shown here), suggesting that an electrical resonance, perhaps in ON bipolar cells, plays a key role. This led to the development of linear-nonlinear (LN) and resonator bank models (see Appendices D, E and F).
In the next section we build on this work to develop a mathematical model which shows that adaptive conductance dynamics, driven by transient calcium release in ON bipolar cell terminals, can allow a simple sensory circuit to tune itself to respond to interruptions in periodic stimuli over a substantial frequency range. We focus on start-end cells, but note that changes in rectification and relative ON/OFF pathway strengths (e.g., via desensitization) can produce other behaviors. We consider only dark flashes whose duty cycles remain constant at 50% as freqencies vary; bright flashes can also elicit an OSR, but individual ganglion cells respond only to dark or to light flash sequences, not to both. Perturbations in both flash amplitude and interflash durations can also cause an OSR, although again individual cells tend to respond only to one of several perturbation types. See (Schwartz et al., 2007a; Schwartz and Berry II, 2008) for further information on these more subtle effects, which are not addressed here.
3 A calcium-tuned oscillator
Following the LN model (Baccus and Meister, 2002; Dayan and Abbott, 2001), we adopt the linear filters of earlier retinal models and additionally propose that oscillations in the relatively large axonal terminals of ON bipolar cells play a key role in generating the OSR. This assumption is supported by the observation of spontaneous oscillations in bipolar cell terminals of goldfish, in both isolated cells (Burrone and Lagnado, 1997) and retinal slices under light adapted conditions (Protti et al., 2000). An interplay between voltage-gated calcium and calcium-gated potassium channels in isolated cells is responsible for these oscillations. For general background on retinal neuronal circuitry, see (Wässle and Riemann, 1978; Wässle and Boycott, 1991; Cook and Becker, 1995) and (Dayan and Abbott, 2001, Chap. 2).
To formulate the model we choose a linearized version of ion channel dynamics. We make this choice because the retina contains a great diversity of bipolar cells (Burkhardt and Fahey, 1998; Wu et al., 2000; Roska et al., 1998; Roska and Werblin, 2001) containing different kinds of ion channels (Pan, 2000; Mao et al., 2002; Ichinose et al., 2005; Zenisek et al., 2001). Since we do not know which bipolar cells provide input to the ganglion cells that produce an OSR, we would have to estimate many unmeasured parameters in detailed ion channel models of the Hodgkin-Huxley type. A linear model allows us to test essential ideas with minimal free parameters, as in (Richardson et al., 2003).
3.1 ON and OFF bipolar cell pathways
In this section we develop a model that encompasses retinal input to bipolar cells, their resulting soma and terminal voltages, and output in terms of ganglion cell firing rates.
Bipolar cells do not fire action potentials and so we are concerned with subthreshold oscillations in their membrane potentials. Following standard linear-nonlinear models (Baccus and Meister, 2002; Dayan and Abbott, 2001), we obtain the ON bipolar cell soma voltage VON(t) by convolving the incoming light stimulus s(t) with a linear filter DON(t) representing the cell's temporal receptive field, cf. (Dayan and Abbott, 2001):
| (1) |
Three filters used in our simulations are shown in Fig. 4 below. The kernel functions DON(t) were taken to have a standard biphasic shape with zero mean, thus excluding the effects of slowly changing light level over the whole flash sequence (clearly, the response to on- and offset of each short flash depends on the filter shape). For convenience, we took the difference between two alpha functions: a shape that closely resembles kernels for bipolar cells derived from white noise measurements (Baccus and Meister, 2002). The parameter V̄ sets the overall size of bipolar cell voltage fluctuations, but since the circuit described below is essentially a linear oscillator, this simply scales the overall voltage levels thoughout and so we may set V̄ = 1 without loss of generality.
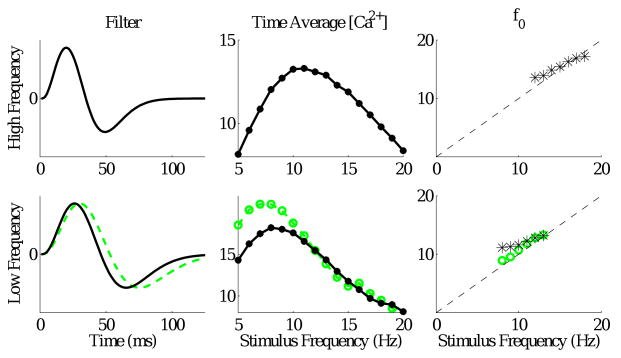
Figure 4.
Left column: the fast (top) and slow (bottom) filters used in the simulations below. Center column: time-averaged calcium concentrations φ̄ vs stimulus frequency for the fast (top) and slow (bottom) filters. Right column: Corresponding matches of terminal resonant frequencies from 12 – 18 Hz (top) and 8 – 13 Hz (bottom). Results for a second slower filter are shown in green (green dashed line in the left panel, green circles in the middle and right panels) in lower panels.
The same receptive field with sign reversed, DOFF = −DON(t), is used to compute soma voltages in OFF bipolar cells. These cells have AMPA and kainate-type glutamate receptors in their dendrites that cause their activation levels to desensitize to sustained inputs (DeVries and Schwartz, 1999; DeVries, 2000). To model this we reduce the soma voltage amplitude following the first positive peak at τp, by setting VOFF(t) to 0.7 VOFF(t) for t > τp. We further assume that the OFF cell terminal voltages UOFF(t) are equal to their desensitized soma voltages:
| (2) |
We also examined the effects of mild (10%, 0.9 V̄) desensitization and no desensitization of OFF cells, obtaining generally similar results but poorer matches to data, as further described in the Discussion.
Voltage dependent conductances, primarily composed of potassium channels, make the terminal dynamics of ON bipolar cells more complicated (Mao et al., 2002; Mao et al., 2003). In general, these may be described by LRC circuits with constant capacitance C and passive conductance gl in parallel (Koch, 1984; Detwiler et al., 1980; Mao et al., 2002), with a third parallel branch containing a voltage-dependent inductance Lk and conductance gk in series (Art and Fettiplace, 1987, Eqn. (2)): see Fig. 2A. The inductance Lk is generally assumed to be proportional to the reciprocal of the derivative of the potassium conductance, which is described by a sigmoidal function of soma voltage, cf. (Jones et al., 1999):
Figure 2.
(A) The LRC terminal circuit, and (B) its response to an impulsive input. (C) The entire model, showing ON and OFF bipolar cell pathways summing to produce ganglion cell output.
| (3) |
Here Vb is the half-activation voltage at which gk = ḡ/2, d is the maximum slope of the sigmoid and the basic timescale is set by ḡ and L̄.
We further assume that the LRC circuit receives input current I(t) = βVON(t) proportional to soma voltage, so that its dynamics are described by a parametrically- and additively-forced linear oscillator with time-varying coefficients Lk(t), gk(t) that depend on soma voltage:
| (4) |
Here UON(t) describes the ON cell terminal voltage which, combined with the output UOFF(t) of OFF bipolar cells, determines ganglion cell input via glutamate release. Details of the derivation of (4) are provided in Appendix A, and a circuit diagram and illustration of the impulse response function appears in Fig. 2 (panels A and B).
Terminal voltages of both ON and OFF bipolar cells govern glutamate release and effectively determine the firing rates of the postsynaptic ganglion cells. For simplicity, we assume a linear relationship between terminal voltage and glutamate release in the range of interest, and a rectified linear relationship between glutamate release and ganglion cell firing rates f(t), so that the net effect is described by
| (5) |
where U(t) = UON(t) + UOFF(t) denotes the (summed) terminal voltage and Uθ is the rectification threshold. Like V̄ in Eqn. (1), f̄ is an output scale factor, and adjustment of it and of the threshold Uθ allows one to match firing rates of specific ganglion cells and to encompass both start-end and sustained firing cell types. While this is probably adequate for ON bipolar cells, which are observed to operate around a voltage above the rectification threshold, rectification of UOFF(t) prior to summation may be more realistic (Demb et al., 2001; Margolis and Detwiler, 2007). We tested this situation in §4.
3.2 Calcium concentration tunes ON bipolar cell terminals
Due to the coupled dynamics of voltage-gated calcium and calcium-gated potassium channels, calcium concentration substantially influences the potassium conductances in bipolar cell terminals. Specifically, increases in calcium concentration shift the sigmoidal potassium conductance vs voltage curve of Eqns. (3) to the left, cf. (Jones et al., 1999, Fig. 4). To incorporate this effect we set Vb = Vb0 − αφφ, where φ is the calcium concentration determined by VON, Vb0 is the half-activation voltage at zero calcium concentration and αφ is a slope factor which also sets the units of the last term. Logarithmic dependence on φ was also tried in place of this linear function, without significant differences in model predictions (results not shown).
Detailed studies of calcium-gated potassium conductances have not been carried out for salamander bipolar cells, so we follow the work of Art, Fettiplace et al. (Art and Fettiplace, 1987; Jones et al., 1999) and assume that the effect of calcium on the potassium conductance dominates that of soma voltage variations. Specifically, writing , Eqns. (3) become
| (6) |
where we take the offset b = (Vb0 − VON)/αφ as constant and αφ is absorbed into the slope d. Together, b and d describe how calcium tunes conductance.
Since calcium channels are activated by depolarization, calcium concentration φ(t) can be described by a leaky integrator driven by the rectified soma voltage:
| (7) |
where βv can also be set equal to 1 since it simply sets the calcium level, which is already scaled by d in Eqns. (6). With appropriate time constants, τCa, the resulting concentrations fluctuate mildly as they rise and fall, while their time-averaged levels over the stimulus duration differ for different stimulus frequencies, thereby tuning the resonant frequency of the terminal. See Fig. 3. The removal of VON-dependence in Lk and gk and the relatively slow calcium dynamics φ(t) imply that Eqn. (4) behaves like a classical forced and damped linear oscillator: a fact that we appeal to in the analysis of §3.3 and parameter discussion of §3.4.
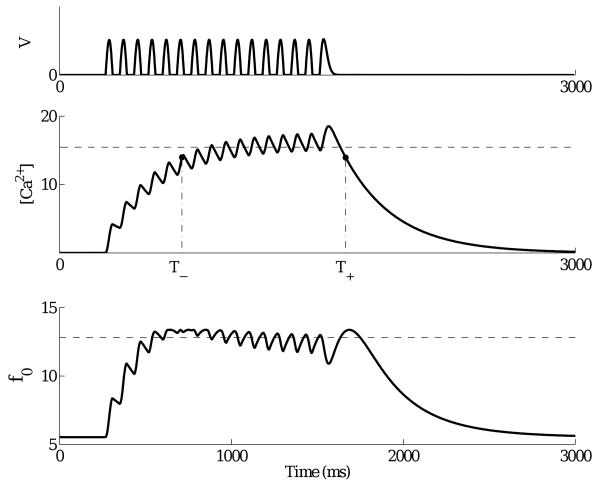
Figure 3.
Top: rectified soma voltage for a 12 Hz stimulus. Center: corresponding calcium concentration φ(t) and average φ̄ calculated by Eqn. (9) (dashed). Bottom: resonant frequency calculated from instantaneous calcium concentration by Eqn. (8), with average indicated by dashed line. Simulation uses low frequency parameter set.
Fig. 2 summarizes the model, which adds a calcium-tuned terminal oscillator to the ON bipolar cell pathway of the LN model. In the ON branch: 1) the stimulus enters through a bandpass filter to produce the soma voltage; 2) the rectified soma voltage then goes through a low pass filter to produce calcium concentration in the ON cell terminal; 3) calcium concentration adjusts the variable inductance and resistance branch of the LRC circuit as the soma voltage waxes and wanes, and 4) current input proportional to soma voltage passes through the LRC circuit to produce the output terminal voltage. 5) The OFF branch uses the ON bandpass filter but with sign reversed and additional desensitization, and it lacks the terminal dynamics. 6) Finally, the summed outputs from ON and OFF pathways are rectified to produce the ganglion cell firing rate.
3.3 Adaptation analysis and parameter settings
If calcium concentration φ were constant, the terminal conductance gk and inductance Lk would also be constant, along with C and gl, and in the case of subcritical damping, the resonant frequency of the ON terminal circuit would be given by:
| (8) |
(using Eqns. (6)). A brief calculation given in Appendix B reveals that the frequency vs. calcium concentration curve is monotonically decreasing for φ > b. Thus, stimulus sequences with lower frequencies that release more calcium produce lower resonant frequencies in the ON terminals. Hence calcium can provide a self-tuning mechanism to match the terminal resonance with the stimulus, and, as emphasized in §3.4, once φ is determined, just four parameter groups describe this process: CL̄, gl/ḡ, d and b. The first two are analogous to the conductance-capacitance ratios that determine resonant frequencies and bandwidths in (Richardson et al., 2003).
As we have noted, calcium concentrations φ(t) fluctuate along with terminal voltages during stimulus presentation, and lower stimulus frequencies cause larger fluctuations, due to higher and wider rectified soma voltage peaks. However, for sufficiently long sequences (∼ 10 or more flashes), the instantaneous frequency f0(t), computed from Eqn. (8) using φ(t), remains approximately constant during the latter part of the sequence, as illustrated in Fig. 3. To estimate the terminal frequency we therefore define a shortterm average φ̄ as follows:
| (9) |
where T− < Tmax < T+ are defined by setting φ(T+) = φ(T−) = 0.75 φ(Tmax), φ(t) reaches its maximum value at t = Tmax, and T− and T+ are the first times during the stimulus presentation at which the 3/4-maximum value is reached as φ(t) rises and falls (middle panel of Fig. 3).
For the receptive field of Fig. 2 and calcium time constant τCa = 300 ms, we find that φ̄ varies with stimulus frequency as shown in the upper middle panel of Fig. 4, being approximately parabolic with a peak at 11 Hz. Our analysis therefore implies that falling values of φ̄ beyond the peak will cause the resonant frequency (8) to rise, suggesting that the circuit may be able to accomodate to stimulus frequencies over a range above 11 Hz. After some experimentation, we found parameters that provide a reasonable match over the range 12 – 18 Hz, as shown in the upper right panel of Fig. 4 (f̄ = 15 Hz/mV, Uθ = 35 mV, C = 2 pF, L̄ = 4.3 MH, d = 0.1, b = 9.5, k = gl/ḡ = 0.0025 (gl = 0.01 nS, ḡ = 4 nS) and β = 28pA/V). We refer to these as the high frequency parameter set.
Since we appeal to the falling branch of the φ̄ vs frequency curve to the right of the peak, slower receptive field dynamics are required to cover the lower stimulus frequency range. Taking the filter shown in the lower left panel of Fig. 4, with all other parameters as above except d = 0.06 and b = 13 (the low frequency parameter set), the peak in calcium concentration occurs near 8 Hz and we obtain the match over the range 8 – 13 Hz shown in black in the lower right panel of Fig. 4. The fact that this is achieved by adjusting b and d predicts that the properties and density of calcium channels in cell terminals should predominate in determining ON cell contributions to OSR. A slightly slower filter produces a better frequency match (green curves), but provides poorer fits to latency data for ganglion cells (see Fig 7).
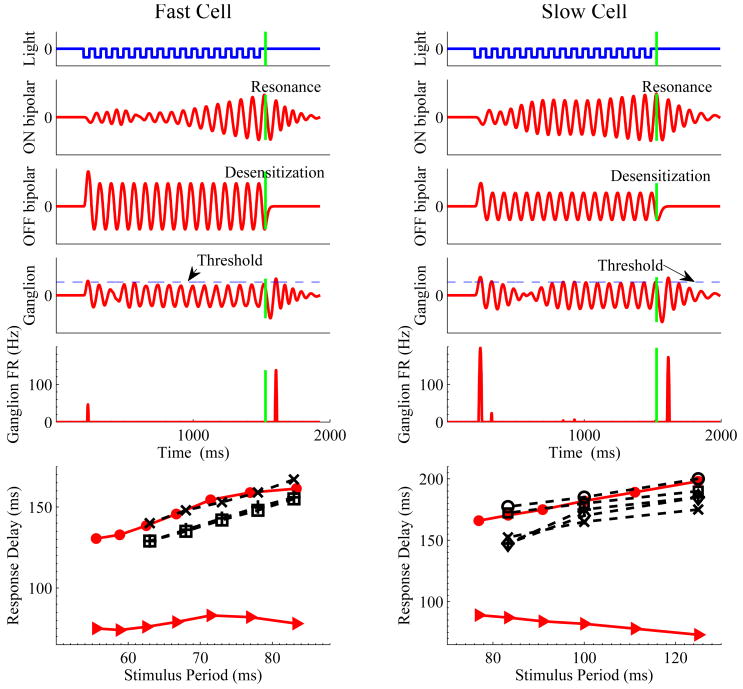
Figure 7.
Simulations of the OSR and latencies for the fast (left) and slow (right) filters of Fig. 4, with high and low frequency parameter sets respectively. Panels from top to bottom show light intensity, ON and OFF bipolar cell voltages, ganglion cell voltages, and ganglion cell firing rates in response to 12 Hz stimuli; vertical green lines indicate omitted flash onset. Bottom panels show latencies from last flash to OSR for the models (solid red, filled circles) and for data from eight ganglion cells (dashed black, crosses, pluses and open symbols). Solid triangles show latencies from omitted flash onset to peak OSR for models.
The quasisteady approximation for calcium concentration is used to guide parameter selection only in this section; all the simulations that follow were obtained by integrating the full model equations.
3.4 Parameter dependence and sensitivity
In addition to the filter kernel DON(t) and desensitization in the OFF channel, set at 0.7, full specification of the model requires 12 parameters:
| (10) |
but only three are critical in obtaining the OSR. The scale factors V̄, βv and f̄ can all be set to unity without changing the results. (As noted above, βv is absorbed into d, and V̄ and f̄ merely set bipolar cell soma voltage and ganglion cell firing levels, all of which are stages in an essentially linear system.) Desensitization, the LRC input current factor β, and the ganglion cell threshold Uθ do not affect OSR latency, although they change the form of the response, allowing us to reproduce both start-end and sustained firing cells. The calcium release time constant τCa is set at 300 ms, but values throughout the range 275 – 500 ms yield similar results.
The remaining six parameters determine the natural frequency of the LRC oscillator, but Eqn. (8) shows that it depends on four quantities: the timescale , the slope d and offset b of the sigmoid describing how calcium tunes the frequency, and the conductance ratio k = gl/ḡ. Numerical experiments show that, provided k ≪ 1 (consistent with subcritical damping) and the filter timescale is appropriate, only the first three of these require careful tuning to obtain realistic OSRs (indeed, only d and b are changed in passing from the high to the low frequency parameter set). In summary, only three of the twelve parameters listed in (10) are critical to the final results, and the model is more robust than its multiparameter form might suggest. Further details can be obtained from the first author.
3.5 Reality tests of the adaptive resonator model
To further test the model, we computed spike-triggered averages (STAs) from the ganglion cell firing rate response f(t) to white noise inputs (Dayan and Abbott, 2001). Fig. 5 (left panels) confirms that STAs obtained with both parameter sets are consistent with typical receptive field dynamics of ganglion cells observed in white noise experiments. The ON pathway bipolar terminal dynamics adds an oscillatory tail to the biphasic response of the filter alone, making the STA weakly triphasic, but this shape is consistent with STAs for many ganglion cells measured at the higher light levels used in previous studies of the OSR. See Appendix C for examples, and compare with biphasic STAs for lower light intensities in (Baccus and Meister, 2002; Segev et al., 2006).
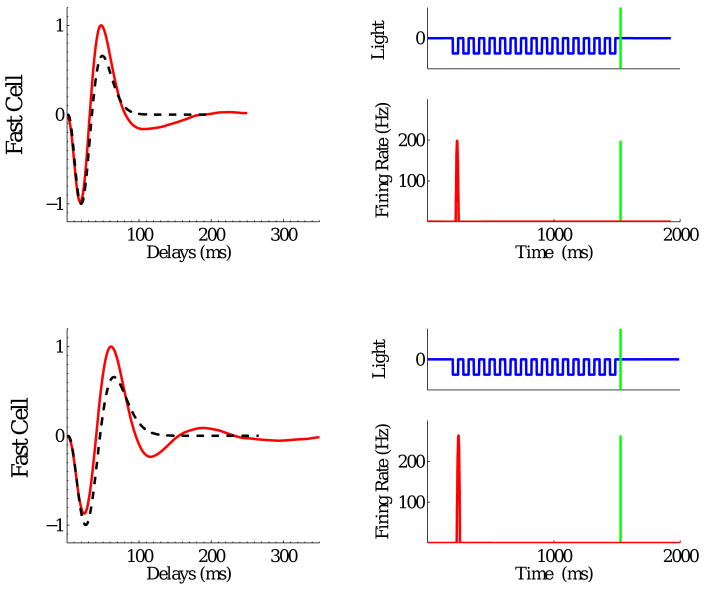
Figure 5.
Tests of the model cell with high frequency parameter set (top row), and with low frequency parameter set (bottom row). Left panels: normalized spike-triggered averages of model ganglion cells (solid red) in comparison with receptive fields of the bipolar cells (dashed black). Right panels: responses of model ganglion cells when ON bipolar cells are blocked.
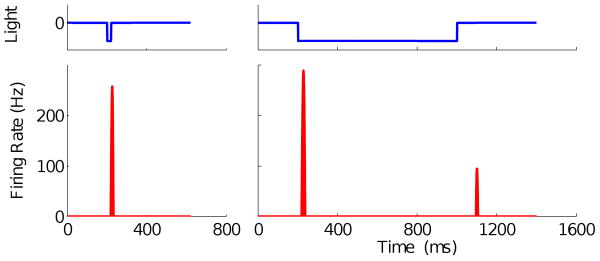
We also examined the model's response to step changes in intensity, confirming that a short flash evokes one burst of firing, and two bursts follow the onset and offset of a longer dark step, as shown in Fig. 6. These firing patterns resemble those of most ON/OFF-type ganglion cells, which comprise up to 75% of all ganglion cells in the salamander (Burkhardt et al., 1998; Segev et al., 2006; Schwartz et al., 2007a). (The ON pathway output had to be increased by adjusting β to bring it closer to that of the OFF pathway to obtain the second burst for the long flash; this is reasonable since the response to a long flash increases with increasing flash duration, indicating that light adaptation is involved in increasing the gain of the ON response.)
Figure 6.
Responses of the model with high frequency parameter set to single dark flash stimuli. Left: response to a 20 ms flash; right: response to an 800 ms flash. Here β = 80 pA/V.
To simulate the effect of the drug APB, which blocks light responses in ON bipolar cells, we also computed the response of the model with the ON pathway blocked (UON(t) ≡ 0). As shown in Fig. 5 (right panels), there is a substantial response to the first flash, little activity thereafter, and no OSR, closely resembling the experimental data (Schwartz and Berry II, 2008, Fig. 8b).
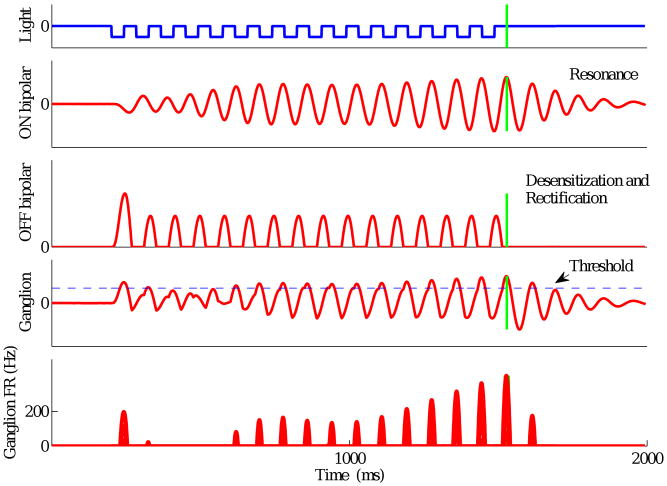
Figure 8.
Model response with slow filter and low frequency parameter set to a 12 Hz stimulus when OFF pathway output UOFF(t) is rectified prior to summation with ON pathway output UON(t). Panels from top to bottom show light intensity, ON and OFF bipolar cell outputs, ganglion cell voltage, and ganglion cell firing rate; vertical green lines indicate omitted flash onset.
To confirm that the calcium dynamics and terminal resonator mechanism is required for the two-pathway model to produce a realistic OSR, we carried out simulations of a simple LN model, using the fast filter of Fig. 4, but with the terminal dynamics disabled. Here the input to the ganglion cells is simply the sum VON + VOFF. We found that no OSR is produced in this case: an N-flash sequence elicits N peaks in the ganglion cell response, the final one being the “direct” response to the last flash. Indeed, while this final peak can occur after the omitted flash for higher frequency stimuli, the latency between the start of the omitted flash and this peak varies from −5 to +10 ms over the frequency range 12 – 18 Hz, i.e., at 12 Hz the final peak precedes the omitted flash. These results are not changed by choices of parameters such as the desensitization. The experimental data of Fig 7 show that latencies lie in the range of 66 – 84 ms for 12 – 16Hz, and remain nearly constant for a given cell. A sample of LN model data in shown in Appendix D. We also investigated two second order LN models as described in Appendix F and found that they, too, cannot produce the nearly-constant latency from omitted flash to OSR.
4 OSR simulation results
We now describe the model's response to sequences of dark flashes. We remark that duty cycles were kept constant at ≈50% as the frequency varied in some of the experiments reported in (Schwartz et al., 2007a; Schwartz and Berry II, 2008), while others were done with constant flash duration. For the model we use a 50% duty cycle throughout. Samples of results for the high and low frequency parameter sets appear in Fig. 7 (left and right columns, respectively). The bipolar cell outputs UON and UOFF and the summed ganglion cell voltage trace with firing threshold Uθ illustrate how the components of the model of Fig. 2 combine to produce the OSR.
The analysis of §3.3 suggests that specific bipolar cell parameters can produce constant latency OSRs over only part of the relevant frequency range. The simulations confirm this. With the fast receptive field filter of Fig. 4 and the high frequency parameter set, robust OSRs are obtained for stimuli in the range 12 – 18 Hz. The bottom left panel of Fig. 7 shows that latencies from the start of the omitted flash (vertical green bars) to the peak in firing rate of the OSR remain approximately constant (triangles), varying only from 74 to 83 ms. As in (Schwartz et al., 2007a; Schwartz and Berry II, 2008) we plot latencies vs. stimulus period. Very similar behavior was seen for three ganglion cells that were tested over the same range (dashed black lines; latencies measured with respect to the time of the last flash). The data indicate considerable variability among cells (≈ 10 ms) in absolute latency, but the slopes of last flash to OSR curves are reproduced accurately by the model.
The right column of Fig. 7 shows model simulations using the low frequency parameter set, also subject to a 12 Hz stimulus, as well as over the range 8 – 13 Hz (bottom). Again a robust OSR is observed although it is smaller than the response to the first flash. Absolute latencies for this slower model cell are significantly longer than those for the fast cell, since it has slower filters for the bipolar cells. The delay between the last flash and the OSR (circles in bottom panel) shifts in a predictive direction as the stimulus period increases. However, latencies measured with respect to the omitted flash are not constant (triangles). Similar behavior was observed in the experimental data (dashed black) over this frequency range. Model cells with different parameters can produce OSR latencies that are more nearly constant with respect to the omitted flash (cf. green curves in Fig. 4), but here we present model results parameterized to better match the data. The model also captures the experimental observations that both the fraction of cells exhibiting an OSR, and OSR strengths, decline with frequency. As noted above, calcium concentrations fluctuate more widely for low frequency stimuli, implying greater time variability in f0(t) and poorer matching between the circuit's resonant frequency and stimulus frequency.
In comparing model results and data in Fig. 7, one should recall that typical ganglion cells each produce OSRs over only part of the 6 – 20 Hz frequency range that was investigated experimentally. The data of (Schwartz et al., 2007a), including its Supplementary Materials, and of (Schwartz and Berry II, 2008, Figs. 1 and 3) (cf. Fig. 1), also indicate considerable variability in both OSR intensity and latencies from cell to cell, as reflected in the range of absolute latencies in the experimental data of Fig. 7. The model can reproduce this by using filters, DON(t) and DOFF(t), with different times to peak, but for clarity we present only a single choice. Similarly, peak model firing rates are between 50 and 150 Hz, similar to the 100 – 200 Hz data of (Schwartz et al., 2007a), but rates in the range 20 – 40 Hz have also been observed, as illustrated in the lower left panels of Fig. 1. The free parameter f̄ that scales the ganglion cell firing rate allows the model to encompass this variability; here it was kept fixed for all simulations.
As shown in Fig. 7, the OSR arises from a subtle interaction between the resonant oscillatory response of the ON bipolar cell terminals and the linearly filtered and desensitized OFF bipolar cell response. Our model does not rectify either signal until after they are summed (Eqn. (5)), but this simplification is not necessary. In Fig. 8 we show that an OSR is also produced when the OFF pathway output is rectified prior to summation with UON(t). While the OSR is relatively weak, we note that the rising firing rates prior to the last flash are qualitatively similar to responses of facilitation type cells: see Fig. 1 (bottom right) and the facilitating and weak OSR cell of (Schwartz and Berry II, 2008, Fig. 13B). Thus, differences among the properties of bipolar cells feeding into a given ganglion cell could help explain the diversity of ganglion cell response types observed experimentally.
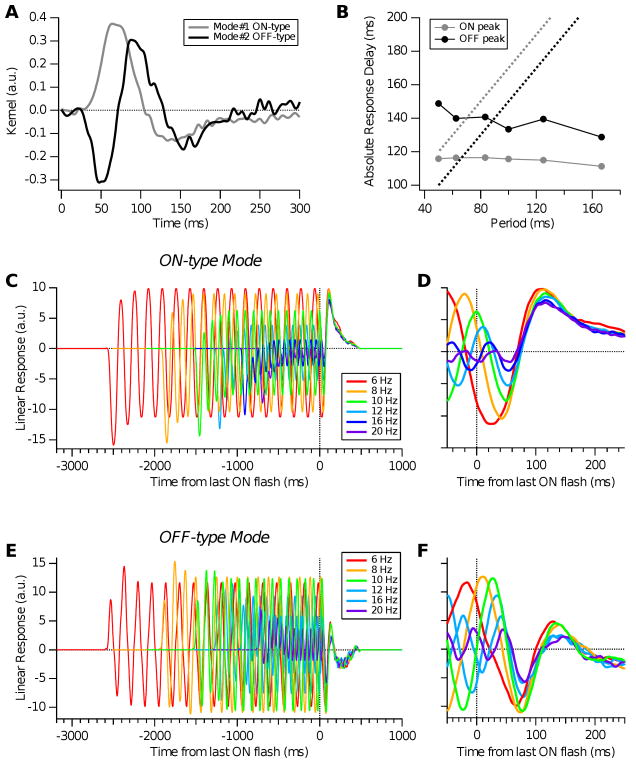
Figure 13.
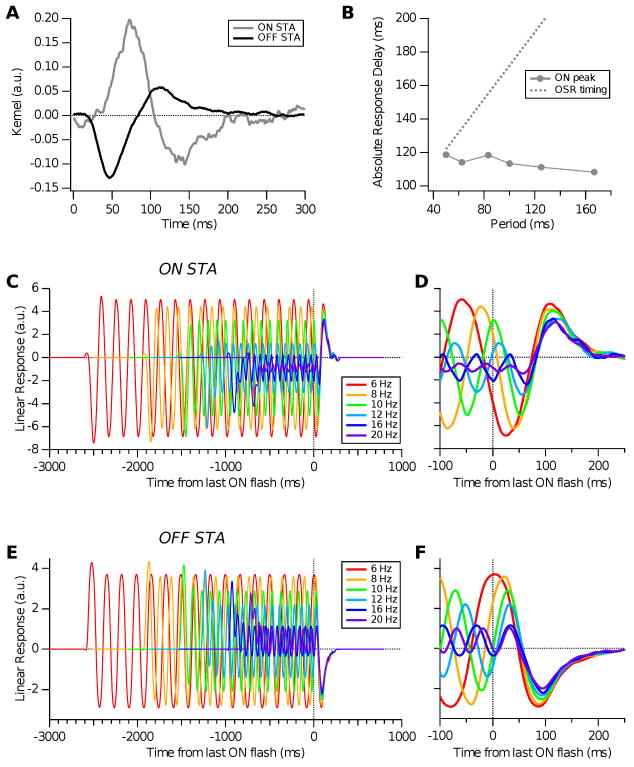
Covariance Model. A: Two significant visual features (eigenmodes) found by covariance analysis for a salamander retinal ganglion cell; ON-type mode shown in grey, OFF-type mode in black. B: Time of peak excitation from ON mode (grey circles) and OFF mode (black circles) plotted versus stimulus period, compared with perfectly predictive OSR latency (dotted), equal to the latency of each eigenmode's extremum (panel A) plus the stimulus period. C, D: Linear response of the ON mode for different stimulus frequencies (colors) over the stimulus period and expanded near its end. E, F: Linear response of the OFF mode for different stimulus frequencies (colors) over the stimulus period and expanded near its end.
5 Discussion and conclusions
In this paper we show that a simple LRC oscillator, with inductive and resistive elements modulated by release of a relatively slow ionic species, can dynamically adapt its resonant frequency to that of a periodic stimulus. In combination with other, static, circuit elements, this plays a central role in producing a response that follows an omitted event by a fixed latency. An earlier study of linearized conductance-based models also found that subthreshold resonances can be tuned by conductance and capacitance parameters (Richardson et al., 2003), although that oscillatory mechanism involves interactions between a single voltage equation and gating variables, while ours derives from membrane capacitance and inductance.
Our dual pathway model, including standard OFF bipolar cells and ON bipolar cells whose terminals adaptively resonate at the stimulus frequency, accounts for the omitted stimulus response (OSR) observed in isolated mouse and salamander retinas. The resonance arises from the interaction between voltage-gated calcium channels and calcium-gated potassium channels, as described in bipolar cells (Burrone and Lagnado, 1997; Protti et al., 2000) and other neurons (Art and Fettiplace, 1987). Unlike previous models, the electrical resonance adapts its frequency using calcium-mediated feedback. Such a mechanism is expected to operate for any resonator involving BK-type potassium channels, which are gated both by voltage and calcium (Hille, 1992; Jones et al., 1999). Thus, the key novel feature relies on well-known properties of ion channels in bipolar cells (Burrone and Lagnado, 1997; Sakaba et al., 1997). Moreover, since the mechanism is basically linear, and does not rely on subtle current-voltage characteristics, it may be more generally responsible for predictive responses to disruptions in regular patterns such as those noted in the Introduction.
The model captures several qualitative features of the experimental observations. First, it produces OSRs with constant latencies from the expected flash for the frequency range 12 – 18 Hz (Fig. 7, upper panel). Second, over the lower frequency range, 8 – 13 Hz, latencies of model OSRs shift in the predictive direction, albeit not proportionally to the stimulus period (Fig. 7, lower panel), and OSR strengths are relatively smaller and less robust (robustness results not shown). Third, with fixed parameters the model can produce an OSR either for the high or low frequency range, but not both. All these behaviors match experimental data from individual ganglion cells. Finally, the spike-triggered averages and responses to flash sequences with the ON bipolar cells blocked match those observed for ganglion cells, and the OSR survives rectification in the OFF bipolar pathway prior to summation at the ganglion cell.
As described in Appendix E, we also explored an alternative mechanism in which ganglion cells receive input from a spectrum of resonating bipolar cells with differing, but fixed, resonant frequencies. This resonator bank model generally fails to produce OSRs over a realistic frequency range. The addition of gap junction coupling can improve the range, but without producing constant latencies from expected flashes. This work does not rule out these or similar fixed parameter models, but it does suggest an important role for adaptation. It also shows that changes in stimuli can cause adaptation via calcium influx, with the natural prediction that manipulations that clamp intracellular calcium concentrations would lead to OSRs that cannot maintain a constant latency.
Our model includes desensitization in the OFF bipolar pathway, as has been observed experimentally to arise from the properties of ionotropic glutamate receptors (DeVries, 2000). Because different degrees of desensitization are found for kainate- versus AMPA-type glutamate (DeVries and Schwartz, 1999), we tried different degrees of desensitization in the model and found that the existence and timing of OSR was unaffected, even with no desensitization at all (results not shown). However, neglecting desensitization in the OFF pathway can lead to responses to second and succeeding flashes that are relatively large compared to the first flash response: behavior that is rarely observed. In addition, desensitization often caused the OFF bipolar pathway, alone, to fail to exceed threshold after the first flash (simulations not shown). This property is important to match the effects of the drug APB, which blocks ON bipolar cells, abolishing the OSR and the sustained response (Schwartz and Berry II, 2008).
In addition to bipolar cell terminals, adaptation can occur in photoreceptors, bipolar cell somas and ganglion cells. Our model ignores such detailed dynamics by describing the initial processing from photoreceptors to bipolar cell somas by a simple linear filter, and using a rectified linear relationship between terminal voltage and ganglion cell firing rate to produce the final output. Inclusion of these dynamics was not necessary to explain the salient features of the OSR, although they might be important to correctly predict firing rates of individual ganglion cells. The current model cannot produce OSRs for the more complex pattern violations observed in (Schwartz et al., 2007a; Schwartz and Berry II, 2008); nor does it produce the period doubling and higher harmonic patterns shown there. Addition of adaptive dynamics in other cells might solve this problem.
The adaptive resonator model was motivated specifically by the omitted stimulus response in the retina (Schwartz et al., 2007a), but its feedback mechanism, in which calcium accumulation changes the effective inductance of calcium-gated potassium channels, may be quite generic. This mechanism relies on well-established properties of BK-type ion channels, which are found widely in the brain. Thus, the ability of a resonator to adapt its characteristic frequency over some range of input frequencies might be active in cellular oscillators in other subcortical and cortical areas (Llinas and Yarom, 1986; Llinas, 1988; Puil et al., 1994; Gutfreud et al., 1995; Hutcheon et al., 1996; Pike et al., 2000; Hutcheon et al., 1994). An important factor is the accumulation of calcium with a time constant longer than each cycle of the stimulus, which allows the steady-state calcium level to track the stimulus frequency (Fig. 3). Cells with faster calcium dynamics will not significantly accumulate calcium, allowing resonators to be either fixed or adaptive depending on the calcium pumps and buffering.
Similar feedback may also be possible using the properties of Ih channels (Robinson and Siegelbaum, 2003). These channels are activated by hyperpolarization and produce a depolarizing current, which can drive a resonance. They also typically have long time constants, and so might encode stimulus frequency in a manner analogous to calcium accumulation in the current model. Ih channels exhibit diverse expression patterns in bipolar cells, with mixtures of all four molecular types (HCN1-4) in different bipolar cells (Ivanova and Müller, 2006), as well as in the axon terminals of ON bipolars (Fyk-Kolodziej and Pourcho, 2007). Interestingly, Ih channels can be gated by cyclic nucleotides in addition to voltage (Craven and Zagotta, 2006). Because the metabotropic glutamate receptors on ON bipolar cells act via changes in cGMP levels, Ih channels may interact in a complex way with this signaling cascade. Since our calcium feedback mechanism successfully captures the OSR observations, we have not attempted to add Ih channels to our model.
Acknowledgments
J.G. and P.H. were partially supported by PHS grants MH58480 and MH62196 (Cognitive and Neural Mechanisms of Conflict and Control, Silvio M. Conte Center). G.S. and M.B. were supported by grants EY14196 and EY17934 from the NEI. We thank the referees for valuable comments.
Appendix: Mathematical details
A Derivation of the LRC circuit equation
Denoting the voltage across the circuit of Fig. 2(A) by UON(t), the currents through the first two channels are described by
| (11) |
where C and gl are the capacitance and leak conductances. The current through the third, variable inductance and conductance channel is given by
| (12) |
Assuming that the cell is in its resting state at stimulus onset t = 0, we have I3(0) = 0 and (12) may be solved to yield
| (13) |
where and . Summing the currents in the three channels and using (11) and (13), we find that the dynamics governing the terminal voltage is described by
| (14) |
where I(t) = I1(t) + I2(t) + I3(t) is the total current flowing through the terminal. Multiplying both sides of (14) by and taking derivatives with respect to t yields Eqn. (4).
B Analysis of the terminal frequency vs. calcium concentration relation
Here we verify that the frequency vs. calcium concentration curve is monotonically decreasing for φ > b. Noting that the sigmoid expression 1 + e−4d(φ−b) in the denominator of Eqn. (8) is a monotonically decreasing function of φ, we define Φ = 1 + e−4d(φ−b) and rewrite Eqn. (8) in terms of this new variable:
| (15) |
where we also note that k = gl/ḡ ∈ (0, 1) and Φ ∈ (1, ∞). Computing the derivative of this expression with respect to Φ:
| (16) |
we find that it is always positive for Φ < 2 or, equivalently, for φ > b. We conclude that, as φ increases, both Φ and f0 decrease.
C Spike-triggered averages (STAs)
In the experimental studies on which this paper draws, visual stimulation was provided by a light-emitting diode (LED). However, many previous studies that have displayed STAs for retinal ganglion cells in the salamander used a computer monitor to generate visual stimuli (Baccus and Meister, 2002; M. Meister and Baylor, 1994); (Segev et al., 2006, Figs. 1 and 2). The experiments of (Schwartz et al., 2007a; Schwartz and Berry II, 2008) differ in that the LED stimulation had a higher average light level than was possible with a computer monitor. Moreover, some previous studies used flickering checkerboard stimuli to generate the STA and displayed the temporal profile of the receptive field center (Baccus and Meister, 2002; M. Meister and Baylor, 1994; Segev et al., 2006). This is not equivalent to the STA under spatially-uniform flicker, because it excludes the influence of the receptive field surround. We therefore display here typical examples of STAs taken with the same LED used in (Schwartz et al., 2007a; Schwartz and Berry II, 2008), for direct comparison with the model filters shown in Fig. 4.
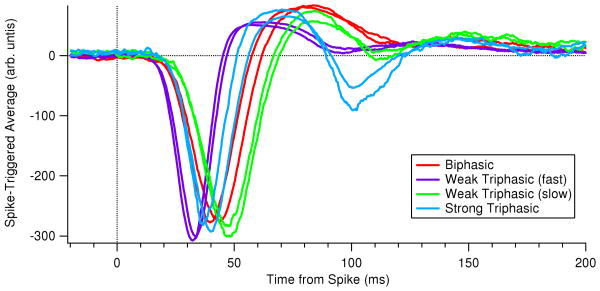
As seen previously (Segev et al., 2006), there was considerable diversity in STAs among different ganglion cells. Unlike previous studies, we found that under LED stimulation many cells had significantly triphasic STAs. Fig. 9 shows multiple examples from three different subtypes of triphasic STAs (blue: strong triphasic; purple: fast weak triphasic; green: slow weak triphasic). As described previously (Segev et al., 2006), these groupings should not be viewed as discrete functional classes, but instead as representatives of a continuum of functional properties. Also shown for comparison are examples of purely biphasic STAs (red). Finally, note that the latency of the first peak in the STAs typically is considerably shorter than in previous studies (30-50 ms), presumably because of the higher light level from the LED.
Figure 9.
OFF-type spike-triggered averages computed from data taken with a spatially-uniform flicker provided by LED, similar to the conditions used in studies of the OSR. See text for details.
Cell types were distributed as follows in this data set: triphasic STAs (13/43 cells), biphasic STAs (10/43 cells), monophasic STAs (8/43 cells), other response types (12/43 cells).
D The linear-nonlinear model
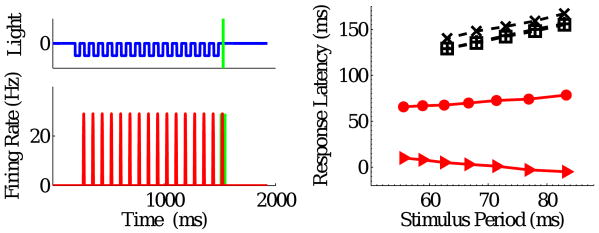
In Fig. 10 we show an example of the response of the LN model. As noted in §3.5, no OSR occurs: each dark flash produces one burst of spikes, due to desensitization in the OFF pathway. Moreover, in the 12 Hz case shown on the left panel the final peak precedes the missing flash. Response latencies vary significantly and remain substantially smaller than those of the experimental data. Compare with Fig. 7 (top panels). Further LN models are discussed in Appendix F.
Figure 10.
Simulations of the LN model. Left: light intensity and ganglion cell firing rate in response to a 12 Hz stimulus. Right: latencies from last flash to last response peak for the model (solid red, filled circles) and for data from three ganglion cells (dashed black, crosses, pluses and open symbols). Solid triangles show latencies from omitted flash onset to last response peak for the model.
E The resonator bank model
It is well known that in the retina multiple bipolar cells map to the same ganglion cell. In the adaptive resonator model, we assume that these bipolar cells have similar properties, hence the output of all ON bipolar cell terminals is represented by a single terminal. In contrast, the resonator bank model emphasizes differences among the properties of bipolar cell terminals. As in the adaptive resonator model, signal processing from photoreceptors to all ON bipolar cell somas is assumed to be identical, and the terminals are described as LRC circuits, but they are endowed with a range of resonant frequencies. Different phase shifts in the resulting terminal responses cause reinforcement and cancellation in the summed input to the ganglion cell that can produce OSRs.
Specifically, we ignore calcium-dependent ion channel dynamics and assume that each terminal is a damped linear LRC oscillator with common conductances gl, gk and capacitance C, and a unique inductance value , implying a unique resonant frequency. The LRC circuitry for each terminal is the same as in the adaptive resonator model of Fig. 2(A) and the dynamics for the ith terminal is also described by
| (17) |
Eqn. (17) differs from the adaptive resonator model (Eqn. (4) above) in that the inductance and conductance are time-independent, and the inductance differs for every terminal. As in the main text we assume a linear relationship between terminal voltages and glutamate release, and a rectified linear relationship between glutamate release and ganglion cell firing rates. This leads to the same expression for ganglion cell firing rates f(t) as in Eqn. (3) of the main text, but with .
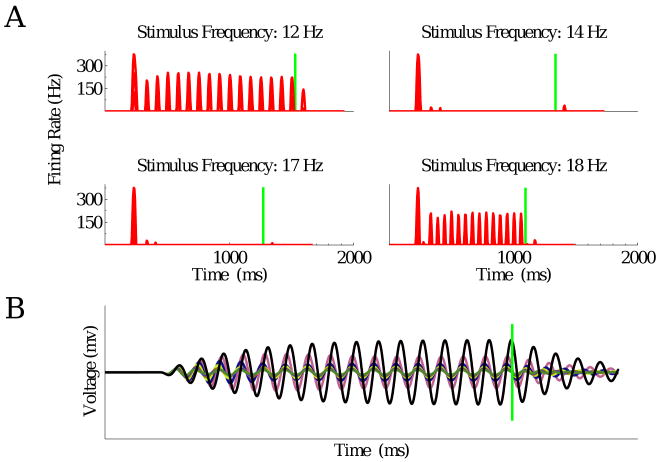
With appropriate parameter values the resonator bank model can produce OSRs, but only over a limited frequency range. Consider a model whose ON bipolar cell terminals have natural frequencies spanning the range 12 – 18 Hz. With the faster receptive field shown in Fig. 4 of the main text and the high frequency parameter set (except Uθ = 10 mV and β = 8pA/V in order to scale the contribution of the seven terminals to have approximately the same weight as before for the entire ON pathway), one can produce OSRs for stimuli in the range 12 – 15 Hz. However for 12 and 13 Hz, spikes persist throughout the flash sequences. Furthermore, no OSR occurs for 16 – 17 Hz, and two very weak OSR peaks are seen at 18 Hz. In all cases, OSR sizes are much smaller than the first firing rate peak, and in some cases, smaller than those in the middle of the sequence (Fig. 11A). Similar results are seen for the low frequency parameter set. This lack of robustness appears intrinsic, as we now explain.
Figure 11.
A: Responses of the resonator bank model to different stimuli. Vertical green lines represent timing of expected flashes. See text for discussion. B: Voltages of different bipolar cell terminals in a resonator bank model in response to a sequence of dark flashes at 12 Hz. Black line represents voltage of the terminal whose resonant frequency is 12 Hz.
Responses of different terminal oscillators exhibit different phase shifts in relation to the flashes. These phase shifts depend on stimulus period and they accumulate over time, leading to variable peak amplitudes and positions in the summed response (see Fig. 11B). Although the summed response is most strongly influenced by the oscillator tuned to the stimulus frequency, subtle interactions among the phases of other oscillators cause the OSR size and latency to vary as the number of flashes changes (results not shown), even for stimuli in a narrow frequency range. Lowering the damping term produces larger amplitude OSRs and more stable latencies from expected flash to OSR, but it also leads to multiple OSR peaks. A damping rate that is very low when the stimulus is on and high when it is off yields improved results, but at the expense of another form of adaptation.
Anatomical studies reveal widespread gap junctions among bipolar cells (Saito and Kujiraoka, 1988; Umino et al., 1993; Cook and Becker, 1995), which are generally believed to synchronize coupled cells. We tested the effects of gap junctions and synchronization for the parameter set specified in previous section. Gap junctions are modeled as linear ionic conductors connecting different LRC circuits. Assuming all-to-all connections in a network of N ON bipolar cells, the input current on the right hand side of Eqn. (14) is supplemented by the term , so that the dynamics of the ith terminal is now described by
| (18) |
where the coupling strength g is taken to be the same between different cells, and the superscript j denotes the jth ON bipolar cell terminal.
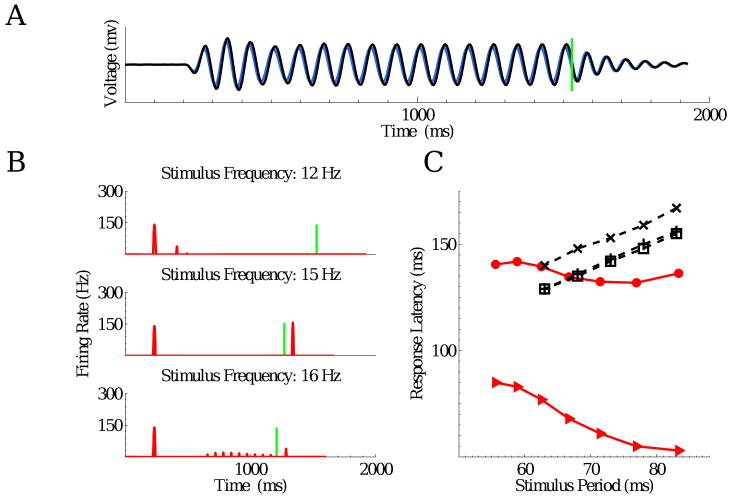
Numerical experiments show that with coupling strengths ≥ 0.05 nS, the voltages of different terminals synchronize, implying fixed phase shifts among the oscillators (Fig. 12A). The phase of the summed responses therefore approximately matches that of the oscillator whose resonant frequency lies in the middle of the range (15 Hz here). With all terminal responses synchronized, more reasonable OSRs can be obtained, albeit not over the entire frequency range (Fig. 12B). Latencies from expected flash to the peak OSR vary widely (from 53 to 85 milliseconds), in contrast to the near-constant latencies from last flashes (Fig. 12C), and this behavior is not restricted to a specific parameter set. It could possibly be improved by introducing a feedback loop which adjusts response phases, but this would again involve adding a further form of adaptation.
Figure 12.
A: Activities of different bipolar cell terminals are synchronized by gap-junction coupling. Format is as in Fig. 11B. Coupling strength g = 0.05 nS. B: Model cell responses to different stimuli. C: Latencies from expected flashes to firing rate peaks (triangles) systematically decrease as stimulus period increases, whereas latencies from last flashes (circles) remain almost constant.
F Alternative Models of the OSR
There is a substantial literature on models of ganglion cell function. Starting with the early work of Rodieck, quantitative models used the spatial and temporal dynamics of the receptive field to predict the time-varying firing rate of a ganglion cell (Rodieck and Stone, 1965a; Rodieck and Stone, 1965b). Such models involve convolution of the stimulus with a linear filter, followed by rectification. More general nonlinear functions have been used, resulting in linear-nonlinear (LN) models (Chichilnisky, 2001), in which the linear kernel describes processing carried out by the classical receptive field. These models have been extended to second order, using Wiener kernel methods (Marmarelis and Marmarelis, 1978; Sakai and Naka, 1987), covariance analysis (Fairhall et al., 2006; Pillow and Simoncelli, 2006), and a dual-LN model of ON/OFF cells (Geffen et al., 2007). Other models have predicted individual spike times using a linear filter followed by a threshold and spike afterpotential (Keat et al., 2001; Pillow et al., 2005), or have included refractoriness (Berry II and Meister, 1998).
Naturally, one wonders if such models, especially second-order ones, can explain the OSR. To this end, we explored two forms of second-order model: covariance and dual-LN. Covariance models have been shown to explain up to 100% of the information contained in spike times under white noise stimulation (Fairhall et al., 2006). The dual-LN model is often similar in practice to the covariance model and allows the interpretation that its two terms represent processing in the ON and OFF channels, mediated primarily through ON and OFF bipolar cells (Geffen et al., 2007). In each case, we used 30-60 min recordings of ganglion cell spiking under spatially uniform, temporally modulated white noise to derive a model.
The covariance model was formed as described in (Fairhall et al., 2006). In brief, the matrix of light intensity covariations at all pairs of times before a spike was compiled over all occurring spikes. This matrix was diagonalized, and the eigenvalue spectrum examined to determine how many stimulus features (each a corresponding eigenmode) were significant. Typically, two such features were identified. To formulate the dual LN model, the spike-triggered stimulus average (STA) was compiled over all occurring spikes (Geffen et al., 2007). Typically, the total STA was OFF-type. Then for each spike, the stimulus was convolved with the total STA. If the resulting value was positive (for an OFF-type total STA), the spike was classified as “OFF-type” and if it was negative, as “ON-type.” Finally, we calculated separate ON- and OFF-type STAs using the respective subsets of spikes.
We found that neither model could account for the predictive timing of the OSR. In both cases, the peak response locked approximately to the time of the last flash, rather than to the time at which the next flash would have occurred.
Fig. 13 shows an example cell analyzed with the covariance model. This cell has two significant eigenmodes; one of ON-type and the other OFF-type (Fig. 13A). Note that the latter has a shorter latency than the ON-type mode and also that it is somewhat triphasic. Each mode was convolved with a set of periodic stimuli having 12 flashes, 50% duty cycle, and different frequencies, and the response was aligned to the time of the last flash (Fig. 13C). We found that the ON-type mode produced a final peak of excitation, which was roughly invariant with respect to the time of the last ON flash, with a latency of ∼115 ms (Fig. 13D). The OFF-type mode produced an initial trough of inhibition, followed by excitation (Fig. 13E), again roughly invariant with respect to the last flash (Fig. 13F). Examining the timing of the peak in excitation from ON and OFF modes, we found that both showed a slight decrease in latency as the stimulus period increased (Fig. 13B, circles). This occurred because longer periods matched the bandwidth of the filters better and hence had a somewhat higher effective contrast. This behavior is strikingly different from a constant delay with respect to the time of the expected flash, as found for the OSR (Fig. 13B, dotted).
Fig. 14 shows analogous results for the dual LN model. Here, the OFF STA again has a shorter latency than the ON STA, but it is not appreciably triphasic (Fig. 14A). When the ON STA was convolved with stimuli at different frequencies, it produced a peak of excitation that was roughly invariant with respect to the last flash (Figs. 14C,D). The OFF STA produced only inhibition at the end of the flash sequence (Figs. 14E,F). The latency of excitation from the ON STA again decreased slightly as the stimulus period increased, in striking disagreement with the latency of the OSR (Fig. 14B).
Figure 14.
Dual LN Model. A: ON- and OFF-type spike-triggered averages (STAs) for a salamander retinal ganglion cell. B: Time of peak excitation from ON STA (grey circles) plotted versus stimulus period, compared with perfectly predictive OSR latency (dotted), equal to the latency of each eigenmode's extremum (panel A) plus the stimulus period. C, D: Linear response of the ON STA for different stimulus frequencies (colors) over the stimulus period and expanded near its end. E, F: Linear response of the OFF STA for different stimulus frequencies (colors) over the stimulus period and expanded near its end.
Both the covariance and dual LN models involve an additional nonlinearity. We have not implemented this step here, because a single static nonlinearity clearly cannot shift the OSR peak by different amounts for different frequencies. Nor have we implemented mechanisms of contrast gain control (Shapley and Victor, 1979; Berry II et al., 1999), because they also would not shift the peak differentially. Results are shown here for two example cells, but we observed no ganglion cells with behavior qualitatively different from these.
More recently, (B. Werner and Passaglia, 2008) have studied the OSR and concluded that the predictive shift in response timing can be explained by the ON channel of a dual LN model. Unfortunately, this result rests on a mistaken definition of response latency. In previous experimental studies (Schwartz et al., 2007a; Schwartz and Berry II, 2008), latency was measured with respect to the peak in the firing rate of a ganglion cell, while in (B. Werner and Passaglia, 2008), it is measured as the onset of the input current to a ganglion cell. This is a crucial difference. In an LN model, the onset of firing can be adjusted by changing the threshold of the static nonlinear function, while the peak time does not change, regardless of the form of nonlinear function. In fact, this is precisely how the “timing” of the OSR changed in the model of (B. Werner and Passaglia, 2008).
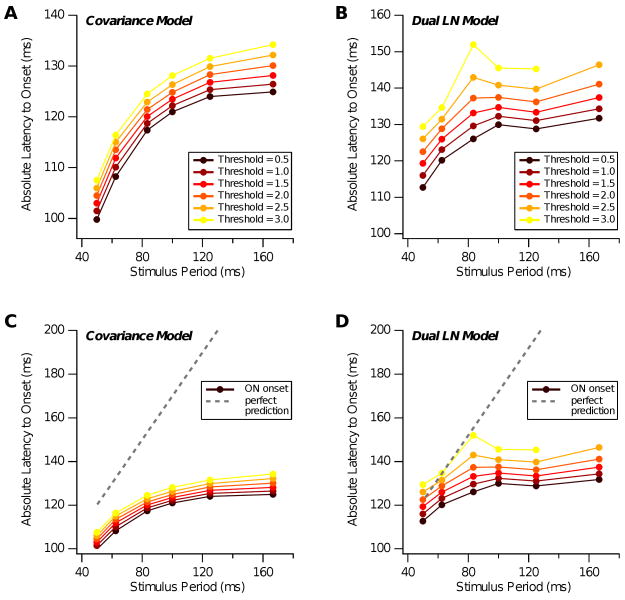
In Fig. 15 we demonstrate this property for the same LN models studied previously using a stimulus with flashes of constant 40 ms duration, as in (B. Werner and Passaglia, 2008). If we apply a threshold to the output of the ON channel, then this onset time can increase as the stimulus period increases, for at least part of that range. The exact form of this shift depends sensitively on the details of the linear filter (cf. Figs. 15A and 15B). Furthermore, a roughly proportional increase of latency versus stimulus period can sometimes occur even if the absolute latency is not predictive of the time of the next flash (cf. Figs. 15C and 15D). Note that for the same models, the time of the peak output from the ON channel does not shift in a predictive fashion (Figs. 13 and 14). We emphasize again that the experimental data shows that the time of peak firing shifts predictively as a function of the stimulus period, and hence, this is the property that any model must explain. Thus, we conclude that neither of these two types of second-order model can explain the OSR.
Figure 15.
Results for onset time. A, B. Time of threshold crossing of the ON channel for the (covariance, dual LN) models as a function of threshold value (colors); absolute latency is measured with respect to the time of the last real flash. C,D. Same results as in panels A and B plotted on a scale that includes a perfectly-predictive shift in response latency.
References
- Art J, Fettiplace R. Variation of membrane properties in hair cells isolated from the turtle cochlea. J Physiol. 1987;385:207–242. doi: 10.1113/jphysiol.1987.sp016492. [DOI] [PMC free article] [PubMed] [Google Scholar]
- Werner B, Passaglia C. Complex temporal response patterns with a simple retinal circuit. J Neurophysiol. 2008;100:1087–1097. doi: 10.1152/jn.90527.2008. [DOI] [PubMed] [Google Scholar]
- Baccus S, Meister M. Fast and slow contrast adaptation in retinal circuitry. Neuron. 2002;36:909–919. doi: 10.1016/s0896-6273(02)01050-4. [DOI] [PubMed] [Google Scholar]
- Bell C, Bodznick D, Montgomery J, Bastian J. The generation and subtraction of sensory expectations within cerebellum-like structures. Brain Behav Evol. 1997;50:17–31. doi: 10.1159/000113352. [DOI] [PubMed] [Google Scholar]
- Berry M, II, Brivanlou I, Jordan T, Meister M. Anticipation of moving stimuli by the retina. Nature. 1999;398:334–338. doi: 10.1038/18678. [DOI] [PubMed] [Google Scholar]
- Berry M, II, Meister M. Refractoriness and neural precision. J Neurosci. 1998;18:2200–2211. doi: 10.1523/JNEUROSCI.18-06-02200.1998. [DOI] [PMC free article] [PubMed] [Google Scholar]
- Bullock T, Hofmann M, Nahm F, New J, Prechtl J. Event-related potentials in the retina and optic tectum of fish. J Neurophysiol. 1990;64:903–914. doi: 10.1152/jn.1990.64.3.903. [DOI] [PubMed] [Google Scholar]
- Bullock T, Karamürsel S. Dynamic properties of human visual evoked and omitted stimulus potentials. Electroencephalogr Clin Neurophysiol. 1994;91:42–53. doi: 10.1016/0013-4694(94)90017-5. [DOI] [PubMed] [Google Scholar]
- Bullock T, Karamürsel S, Hoffman M. Interval-specific event related potentials to omitted stimuli in the electrosensory pathway in elasmobranchs: an elementary form of expectation. J Comp Physiol A. 1993;172:501–510. doi: 10.1007/BF00213532. [DOI] [PubMed] [Google Scholar]
- Burkhardt D, Fahey P. Contrast enhancement and distributed encoding by bipolar cells in the retina. J Neurophysiol. 1998;80:1070–1081. doi: 10.1152/jn.1998.80.3.1070. [DOI] [PubMed] [Google Scholar]
- Burkhardt D, Fahey P, Sikora M. Responses of ganglion cells to contrast steps in the light-adapted retina of the tiger salamander. Visual Neurosci. 1998;15:219–229. doi: 10.1017/s0952523898152021. [DOI] [PubMed] [Google Scholar]
- Burrone J, Lagnado L. Electrical resonance and Ca2+ influx in the synaptic terminal of depolarizing bipolar cells from the goldfish retina. J Physiol. 1997;505:571–584. doi: 10.1111/j.1469-7793.1997.571ba.x. [DOI] [PMC free article] [PubMed] [Google Scholar]
- Busse L, Woldorff M. The ERP omitted stimulus response to “no-stim” events and its implications for fast-rate event-related fMRI designs. NeuroImage. 2003;18:856–864. doi: 10.1016/s1053-8119(03)00012-0. [DOI] [PubMed] [Google Scholar]
- Chichilnisky E. A simple white noise analysis of neuronal light responses. Network. 2001;12:199–213. [PubMed] [Google Scholar]
- Cook J, Becker D. Gap junctions in the vertebrate retina. Microsc Res Tech. 1995;31:408–419. doi: 10.1002/jemt.1070310510. [DOI] [PubMed] [Google Scholar]
- Craven K, Zagotta W. CNG and HCN channels: two peas, one pod. Ann Rev Physiol. 2006;68:375–401. doi: 10.1146/annurev.physiol.68.040104.134728. [DOI] [PubMed] [Google Scholar]
- Dayan P, Abbott LF. Theoretical Neuroscience: Computational and Mathematical Modeling of Neural Systems. MIT Press; Cambridge, MA: 2001. [Google Scholar]
- Demb J, Zaghloul K, Haarsma L, Sterling P. Bipolar cells contribute to nonlinear spatial summation in the brisk-transient (Y) ganglion cell in mammalian retina. J Neurosci. 2001;21:7447–7454. doi: 10.1523/JNEUROSCI.21-19-07447.2001. [DOI] [PMC free article] [PubMed] [Google Scholar]
- Detwiler P, Hodgkin A, McNaughton P. Temporal and spatial characteristics of the voltage response of rods in the retina of the snapping turtle. J Physiol. 1980;300:213–250. doi: 10.1113/jphysiol.1980.sp013159. [DOI] [PMC free article] [PubMed] [Google Scholar]
- DeVries S. Bipolar cells use kainate and AMPA receptors to filter visual information into separate channels. Neuron. 2000;28:847–856. doi: 10.1016/s0896-6273(00)00158-6. [DOI] [PubMed] [Google Scholar]
- DeVries S, Schwartz E. Kainate receptors mediate synaptic transmission between cones and ‘off’ bipolar cells in a mammalian retina. Nature. 1999;397:157–60. doi: 10.1038/16462. [DOI] [PubMed] [Google Scholar]
- Fairhall A, Burlingame C, Narasimhan R, Harris R, Puchalla J, Berry M., II Selectivity for multiple stimulus features in retinal ganglion cells. J Neurophysiol. 2006;96:2724–2738. doi: 10.1152/jn.00995.2005. [DOI] [PubMed] [Google Scholar]
- Friedman D, Cycowicz Y, Gaeta H. The novelty P3: an event-related brain potential (ERP) sign of the brain's evaluation of novelty. Neuorosci Biobehav Rev. 2001;25:355–373. doi: 10.1016/s0149-7634(01)00019-7. [DOI] [PubMed] [Google Scholar]
- Fyk-Kolodziej B, Pourcho R. Differential distribution of hyperpolarization-activated and cyclic nucleotide-gated channels in cone bipolar cells of the rat retina. J Comp Neurol. 2007;501:891–903. doi: 10.1002/cne.21287. [DOI] [PubMed] [Google Scholar]
- Geffen M, de Vries S, Meister M. Retinal ganglion cells can rapidly change polarity from off to on. PLoS Biology. 2007;5:e65. doi: 10.1371/journal.pbio.0050065. [DOI] [PMC free article] [PubMed] [Google Scholar]
- Gutfreud Y, Yarom Y, Segev I. Subthreshold oscillations and resonant frequency in guinea-pig cortical neurons: physiology and modelling. J Physiol. 1995;483:621–640. doi: 10.1113/jphysiol.1995.sp020611. [DOI] [PMC free article] [PubMed] [Google Scholar]
- Hille B. Ionic Channels of Excitable Membranes. Sinauer Associates; Sunderland, MA: 1992. [Google Scholar]
- Hosoya T, Baccus S, Meister M. Dynamic predictive coding by the retina. Nature. 2005;436:71–77. doi: 10.1038/nature03689. [DOI] [PubMed] [Google Scholar]
- Hutcheon B, Miura R, Puil E. Subthreshold membrane resonance in neocortical neurons. J Neurophysiol. 1996;76:683–697. doi: 10.1152/jn.1996.76.2.683. [DOI] [PubMed] [Google Scholar]
- Hutcheon B, Miura R, Yarom Y, Puil E. Low-threshold calcium current and resonance in thalamic neurons: A model of frequency preference. J Neurophysiol. 1994;71:583–594. doi: 10.1152/jn.1994.71.2.583. [DOI] [PubMed] [Google Scholar]
- Hutcheon B, Yarom Y. Resonance, oscillation and the intrinsic frequency preferences of neurons. Trends in Neurosci. 2000;23:216–22. doi: 10.1016/s0166-2236(00)01547-2. [DOI] [PubMed] [Google Scholar]
- Ichinose T, Shields C, Lukasiewicz P. Sodium channels in transient retinal bipolar cells enhance visual responses in ganglion cells. J Neurosci. 2005;25:1856–1865. doi: 10.1523/JNEUROSCI.5208-04.2005. [DOI] [PMC free article] [PubMed] [Google Scholar]
- Ivanova E, Müller F. Retinal bipolar cell types differ in their inventory of ion channels. Vis Neurosci. 2006;23:143–154. doi: 10.1017/S0952523806232048. [DOI] [PubMed] [Google Scholar]
- Jääskeläinen I, Ahveninen J, Bonmassar G, Dale A, Ilmoniemi R, Levänen S, Lin FH, May P, Melcher J, Stufflebeam S, Tiitinen H, Belliveau J. Human posterior auditory cortex gates novel sounds to consciousness. Proc Natl Acad Sci USA. 2004;101:6809–6814. doi: 10.1073/pnas.0303760101. [DOI] [PMC free article] [PubMed] [Google Scholar]
- Jones E, Gray-Keller M, Fettiplace R. The role of Ca2+ activated K+ channel spliced variants in the tonotopic organization of the turtle cochlea. J Physiol. 1999;518:653–665. doi: 10.1111/j.1469-7793.1999.0653p.x. [DOI] [PMC free article] [PubMed] [Google Scholar]
- Karamürsel S, Bullock T. Dynamics of event-related potentials to trains of dark and light flashes: responses to missing and extra stimuli in elasmobranch fish. Electroencephalogr Clin Neurophysiol. 1994;90:461–471. doi: 10.1016/0013-4694(94)90138-4. [DOI] [PubMed] [Google Scholar]
- Keat J, Reinagel P, Reid R, Meister M. Predicting every spike: A model for the response of a visual neuron. Neuron. 2001;30:803–817. doi: 10.1016/s0896-6273(01)00322-1. [DOI] [PubMed] [Google Scholar]
- Klinke R, Fruhstorfer H, Finkenzeller P. Evoked responses as a function of external and stored information. Electroencephalogr Clin Neurophysiol. 1968;25:119–122. doi: 10.1016/0013-4694(68)90135-1. [DOI] [PubMed] [Google Scholar]
- Koch C. Cable theory in neurons with active linearized membrane. Biol Cybern. 1984;50:15–33. doi: 10.1007/BF00317936. [DOI] [PubMed] [Google Scholar]
- Llinas R. The intrinsic electrophysiological properties of mammalian neurons: insights into central nervous system function. Science. 1988;242:1654–1664. doi: 10.1126/science.3059497. [DOI] [PubMed] [Google Scholar]
- Llinas R, Steriade M. Bursting of thalamic neurons and states of vigilance. J Neurophysiol. 2006;95:575–582. doi: 10.1152/jn.00166.2006. [DOI] [PubMed] [Google Scholar]
- Llinas R, Yarom Y. Oscillatory properties of guinea-pig inferior olivary neurones and their pharmacological modulation. J Physiol. 1986;376:163–182. doi: 10.1113/jphysiol.1986.sp016147. [DOI] [PMC free article] [PubMed] [Google Scholar]
- Meister M, P J, Baylor DA. Fmulti-neuronal signals from the retina: acquisition and analysis. J Neurosci Methods. 1994;51:95–106. doi: 10.1016/0165-0270(94)90030-2. [DOI] [PubMed] [Google Scholar]
- Mao B, MacLeish P, Victor J. Relation between potassium-channel kinetics and the intrinsic dynamics in isolated retinal bipolar cells. J Comput Neurosci. 2002;12:147–163. doi: 10.1023/a:1016563028021. [DOI] [PubMed] [Google Scholar]
- Mao B, MacLeish P, Victor J. Role of hyperpolarization-activated currents for the intrinsic dynamics of isolated retinal neurons. Biophys J. 2003;84:2756–2767. doi: 10.1016/S0006-3495(03)75080-2. [DOI] [PMC free article] [PubMed] [Google Scholar]
- Margolis D, Detwiler P. Different mechanisms generate maintained activity in ON and OFF retinal ganglion cells. J Neurosci. 2007;27:5994–6005. doi: 10.1523/JNEUROSCI.0130-07.2007. [DOI] [PMC free article] [PubMed] [Google Scholar]
- Marmarelis P, Marmarelis V. Analysis of Physiological Systems: The White-Noise Approach. Plenum Press; New York: 1978. [Google Scholar]
- Pan Z. Differential expression of high- and two types of low-voltage-activated calcium currents in rod and cone bipolar cells of the rat retina. J Neurophysiol. 2000;83:513–527. doi: 10.1152/jn.2000.83.1.513. [DOI] [PubMed] [Google Scholar]
- Pike F, Goddard R, Suckling J, Ganter P, Kasthuri N, Paulsen O. Distinct frequency preferences of different types of rat hippocampal neurones in response to oscillatory input currents. J Physiol. 2000;529:205–213. doi: 10.1111/j.1469-7793.2000.00205.x. [DOI] [PMC free article] [PubMed] [Google Scholar]
- Pillow J, Paninski L, Uzzell V, Simoncelli E, Chichilnisky E. Prediction and decoding of retinal ganglion cell responses with a probabilistic spiking model. J Neurosci. 2005;25:11003–11013. doi: 10.1523/JNEUROSCI.3305-05.2005. [DOI] [PMC free article] [PubMed] [Google Scholar]
- Pillow J, Simoncelli E. Dimensionality reduction in neural models: an information-theoretic generalization of spike-triggered average and covariance analysis. J Vis. 2006;6:414–428. doi: 10.1167/6.4.9. [DOI] [PubMed] [Google Scholar]
- Prechtl J, Bullock T. Event-related potentials to omitted visual stimuli in a reptile. Electroencephalogr Clin Neurophysiol. 1994;91:54–66. doi: 10.1016/0013-4694(94)90018-3. [DOI] [PubMed] [Google Scholar]
- Protti D, Flores-Herr N, Gersdorff H. Light evokes Ca2+ spikes in the axon terminal of a retinal bipolar cell. Neuron. 2000;25:215–227. doi: 10.1016/s0896-6273(00)80884-3. [DOI] [PubMed] [Google Scholar]
- Puil E, Meiri H, Yarom Y. Resonant behavior and frequency preferences of thalamic neurons. J Neurophysiol. 1994;71:575–582. doi: 10.1152/jn.1994.71.2.575. [DOI] [PubMed] [Google Scholar]
- Richardson M, Brunel N, Hakim V. From subthreshold to firing rate resonance. J Neurophysiol. 2003;89:2538–2554. doi: 10.1152/jn.00955.2002. [DOI] [PubMed] [Google Scholar]
- Robinson R, Siegelbaum S. Hyperpolarization-activated cation currents: from molecules to physiological function. Ann Rev Physiol. 2003;65:453–480. doi: 10.1146/annurev.physiol.65.092101.142734. [DOI] [PubMed] [Google Scholar]
- Rodieck R, Stone J. Analysis of receptive fields of cat retinal ganglion cells. J Neurophysiol. 1965a;28:833–849. doi: 10.1152/jn.1965.28.5.833. [DOI] [PubMed] [Google Scholar]
- Rodieck R, Stone J. Response of cat retinal ganglion cells to moving visual patterns. J Neurophysiol. 1965b;28:819–832. doi: 10.1152/jn.1965.28.5.819. [DOI] [PubMed] [Google Scholar]
- Rogers R, Papanicolaou A, Baumannn S, Eisenberg H. Late magnetic fields and positive evoked potentials following infrequent and unpredictable omissions of visual stimuli. Electroencephalogr Clin Neurophysiol. 1992;83:146–152. doi: 10.1016/0013-4694(92)90028-g. [DOI] [PubMed] [Google Scholar]
- Roska B, Nemeth E, Werblin F. Response to change is facilitated by a three-neuron disinhibitory pathway in the tiger salamander retina. J Neurosci. 1998;18:3451–3459. doi: 10.1523/JNEUROSCI.18-09-03451.1998. [DOI] [PMC free article] [PubMed] [Google Scholar]
- Roska B, Werblin F. Vertical interactions across ten parallel, stacked representations in the mammalian retina. Nature. 2001;410:583–587. doi: 10.1038/35069068. [DOI] [PubMed] [Google Scholar]
- Saito T, Kujiraoka T. Characteristics of bipolar-bipolar coupling in the carp retina. J Gen Physiol. 1988;91:275–287. doi: 10.1085/jgp.91.2.275. [DOI] [PMC free article] [PubMed] [Google Scholar]
- Sakaba T, Ishikane H, Tachibana M. Ca2+-activated K+ current at presynaptic terminals of goldfish retinal bipolar cells. Neurosci Research. 1997;27:219–228. doi: 10.1016/s0168-0102(97)01155-3. [DOI] [PubMed] [Google Scholar]
- Sakai H, Naka K. Signal transmission in the catfish retina. IV. Transmission to ganglion cells. J Neurophysiol. 1987;58:1307–1328. doi: 10.1152/jn.1987.58.6.1307. [DOI] [PubMed] [Google Scholar]
- Schultz W. Predictive reward signal of dopamine neurons. J Neurophysiol. 1998;80:1–27. doi: 10.1152/jn.1998.80.1.1. [DOI] [PubMed] [Google Scholar]
- Schultz W, Dayan P, Montague P. A neural substrate of prediction and reward. Science. 1997;275:1593–1599. doi: 10.1126/science.275.5306.1593. [DOI] [PubMed] [Google Scholar]
- Schwartz G, Berry M., II Sophisticated temporal pattern recognition in retinal ganglion cells. J Neurophysiol. 2008;99:1787–1798. doi: 10.1152/jn.01025.2007. [DOI] [PMC free article] [PubMed] [Google Scholar]
- Schwartz G, Harris R, Shrom D, Berry M., II Detection and prediction of periodic patterns by the retina. Nature Neurosci. 2007a;10:552–554. doi: 10.1038/nn1887. [DOI] [PMC free article] [PubMed] [Google Scholar]
- Schwartz G, Taylor S, Harris R, Berry M., II Synchronized firing among retinal ganglion cells signals motion reversal. Neuron. 2007b;55:958–969. doi: 10.1016/j.neuron.2007.07.042. [DOI] [PMC free article] [PubMed] [Google Scholar]
- Segev R, Puchalla J, Berry M., II Functional organization of ganglion cells in the salamander retina. J Neurophysiol. 2006;95:2277–2292. doi: 10.1152/jn.00928.2005. [DOI] [PubMed] [Google Scholar]
- Shapley R, Victor J. The contrast gain control of the cat retina. Vis Res. 1979;19:431–434. doi: 10.1016/0042-6989(79)90109-3. [DOI] [PubMed] [Google Scholar]
- Sutton S, Teuting P, Zubin J, John E. Information delivery and the sensory evoked potential. Science. 1967;155:1436–1439. doi: 10.1126/science.155.3768.1436. [DOI] [PubMed] [Google Scholar]
- Umino O, Maehara M, Hidaka S, Kita S, Hashimoto Y. Electrical coupling between bipolar cells in the retina. Invest Ophthalmol Vis Sci. 1993;34:984. [Google Scholar]
- Wässle H, Boycott BB. Functional architecture of the mammalian retina. Physiol Rev. 1991;71:447–480. doi: 10.1152/physrev.1991.71.2.447. [DOI] [PubMed] [Google Scholar]
- Wässle H, Riemann H. The mosaic of nerve cells in the mammalian retina. Proc R Soc Lond [Biol] 1978;200:441–461. doi: 10.1098/rspb.1978.0026. [DOI] [PubMed] [Google Scholar]
- Wu S, Gao F, Maple B. Functional architecture of synapses in the inner retina: segregation of visual signals by stratification of bipolar cell axon terminals. J Neurosci. 2000;20:4462–4470. doi: 10.1523/JNEUROSCI.20-12-04462.2000. [DOI] [PMC free article] [PubMed] [Google Scholar]
- Zenisek D, Henry D, Studholme K, Yazulla S, Matthews G. Voltage-dependent sodium channels are expressed in nonspiking retinal bipolar neurons. J Neurosci. 2001;21:4543–4550. doi: 10.1523/JNEUROSCI.21-13-04543.2001. [DOI] [PMC free article] [PubMed] [Google Scholar]


