

Abstract
Evolutionary history of Mammalia provides strong evidence that the morphology of skull and brain change jointly in evolution. Formation and development of brain and skull co-occur and are dependent upon a series of morphogenetic and patterning processes driven by genes and their regulatory programs. Our current concept of skull and brain as separate tissues results in distinct analyses of these tissues by most researchers. In this study, we use 3D computed tomography and magnetic resonance images of pediatric individuals diagnosed with premature closure of cranial sutures (craniosynostosis) to investigate phenotypic relationships between the brain and skull. It has been demonstrated previously that the skull and brain acquire characteristic dysmorphologies in isolated craniosynostosis, but relatively little is known of the developmental interactions that produce these anomalies. Our comparative analysis of phenotypic integration of brain and skull in premature closure of the sagittal and the right coronal sutures demonstrates that brain and skull are strongly integrated and that the significant differences in patterns of association do not occur local to the prematurely closed suture. We posit that the current focus on the suture as the basis for this condition may identify a proximate, but not the ultimate cause for these conditions. Given that premature suture closure reduces the number of cranial bones, and that a persistent loss of skull bones is demonstrated over the approximately 150 million years of synapsid evolution, craniosynostosis may serve as an informative model for evolution of the mammalian skull.
Although it is commonly recognized that the morphological relationship, or “fit,” between skull and brain is precise and absolute across mammals, these two tissues are normally considered as separate entities. Old ideas (Klaauw, '46, '48–'52; Moss, '71) and new evidence from evolutionary developmental biology concerning developmental interactions among traits representing different tissue types (Köntges and Lumsden, '96; Wilkie and Morriss-Kay, 2001; Matsuoka et al., 2005) suggest that the processes important to evolution and development of the head are not necessarily organized along the distinct tissue boundaries recognized in mature organisms. Studies of tissue, cellular, and molecular interactions that control development provide clues relating to the complexity of the interactions underlying trait variation, especially for the head (Francis-West et al., 2003).
The embryonic skull does not develop in isolation but is dependent on proper coordination between neural and bony tissue precursors, as well as the other specialized soft tissues that make up the functioning organs of the head. Once formed, physical proximity of central nervous system (CNS) and skull also contribute to head shape, but these relationships are poorly understood and it is unclear whether the underlying processes stem from pleiotropic effects, biomechanical influences, tissue interactions, or an ontogenetically sensitive combination of these. An intimate skull–brain interaction was proposed some time ago on the basis of functional requirements of soft tissues of the head (van der Klaauw, '48–'52), but additional bases for the relationships that underlie neural and skull tissues (i.e., position-dependent gene expression, shared genetic pathways, interactions among cell products of various tissues, mechanotransduction) are now being offered (Carroll, 2001; Yu et al., 2001; Francis-West et al., 2003; Mao et al., 2003a,b; Weiss, 2005). In support of the idea that skull and brain develop jointly due to shared regulatory influences, we offer this phenotypic investigation of the developmental association of brain and skull through analysis of 3D data from individuals with premature closure of a neurocranial suture (Fig. 1).
Fig. 1.

3D reconstruction of CT images of the craniofacial skeleton and MR images of the central nervous system of a 21-week-old child with right unilateral synostosis of the coronal suture (RUCS). Features consistent with the diagnosis of RUCS include a flattened frontal bone on the side of the fused suture, and a “twisting” of the facial skeleton and cranial base (not shown). The four panels include: (a) anterior view of 3D reconstruction of skull; (b) anterior view of 3D reconstruction of brain; (c,d) anterior, lateral views of 3D reconstruction of skull superimposed (and ghosted for transparency) over the 3D brain reconstruction to show anatomical relationships of brain and skull. CT and MR images were acquired separately. Consequently, the superimposition used in this figure is based on anatomical knowledge rather than any superimposition or registration algorithm.
PHENOTYPIC INTEGRATION AND MODULARITY
Evolutionary and developmental biologists are revisiting the concept of morphological integration (Olson and Miller, '58) to understand the role of developmental systems in producing observed variation. The quantitative study of morphological, or phenotypic integration is largely concerned with the modular nature of phenotypes. Modules are characterized via patterns of interaction, quantified by correlation or covariation, among subsets of traits (Magwene, 2001). Studies of phenotypic integration attempt to demarcate those subsets of traits that strongly co-vary as a window into underlying developmental associations. Olson and Miller ('58) proposed a method based solely on phenotypic observations and showed that the degree of integration can be measured by the intensity of statistical associations of traits within the phenotype.
Cheverud ('82, '96) identified population-level integration, subdividing the concept into genetic and evolutionary integration. Genetic integration is the genetic modularization and co-inheritance of morphological traits (Chernoff and Magwene, '99). Evolutionary integration describes the coordinated evolution of morphological traits, occurring either because traits are inherited together or are inherited separately but selected together (Chernoff and Magwene, '99; Cheverud, '96). According to quantitative genetic theory, phenotypic correlations measure the effect of both genetic and environmental correlations. If information pertaining to genetics or environment is not available, studies of phenotypic integration provide a measure of this effect and biological hypotheses generated by such studies provide a statement of the underlying cause of phenotypic integration patterns (Chernoff and Magwene, '99).
Various analytical techniques have been advocated for the study of morphological integration (see Chernoff and Magwene, '99 for an informative discussion of various approaches), and applications of these methods have been limited to the analysis of single tissues, primarily bone. Bone is studied in isolation in part because most samples consist largely of skeletal (sometimes fossilized) remains, but also because our concepts of modules are often based on a view of anatomy where tissues are thought of as separate systems.
The study of phenotypic integration is concerned with modularity, the division of biological structure, developmental, and physiological properties into repeatable parts (Winther, 2001). Modules are often thought to consist of a single tissue or cell type corresponding to physical locations or domains where certain genes operate. However, a practical definition of modularity must allow for overlapping and hierarchical patterns of interaction (Wagner and Altenberg, '96). This has usually meant that within a tissue, traits can be organized into modules that are related to other modules within the same tissue at varying levels of organization. An emerging concept of modularity looks to intersecting hierarchies of developmental processes as the organizing principle (Carroll, 2001; Wolf et al., 2001; True and Carroll, 2002; Weiss, 2005). Consideration of modules as regulatory processes with varying effects on multiple tissues at differing time points does not negate the importance of structural associations among anatomical units, but adds to the explanation of why the associations occur.
If modules pattern head formation, then it is likely that the fields specified by modules cross tissue boundaries. And if phenotypic integration theory is correct, elevated correlations among phenotypic features of varying tissue types may indicate that correspondences arise from developmental relations. Delineation and confirmation of modules based on shared regulatory processes requires detailed molecular and cellular work. As we demonstrate in this study, phenotypic integration studies that include quantitative data from various tissue types can contribute to the discovery of hybrid-tissue units that either function together, or respond to network-based regulatory developmental modules that can subsequently be verified by molecular work.
MODULARITY OF CNS AND SKULL
The most prominent anatomical element of the vertebrate head is the neural component comprising primarily neurocranium, brain and meninges. We briefly discuss what has been proposed about modularity as it relates to each of these tissues.
Skull
The skull is easily divided into units organized around sensory organs and the jaw apparatus, and has been the focus of large numbers of phenotypic integration studies (Cheverud, '82, '95; Klingenberg et al., 2001, 2003; Klingenberg, 2003; Hallgrímsson et al., 2004; Lieberman et al., 2004). Cheverud's analyses of morphological integration of the skull (Cheverud, '82, '88, '95) adopted functional cranial analysis (Moss and Young, '60; Moss, '71) as the framework for considering functional and developmental relationships within the cranium. The functional components of the skull are organized around the various sensory tissues (e.g., auditory, visual, cognitive) and consist of a functional matrix (the soft tissues and spaces that carry out the function) and a skeletal unit (bone that surrounds the functional matrix). Cheverud ('82) demonstrated that correlations among linear measures within skeletal units were stronger than could be expected by random associations. These findings provided support for a concept of skull modules as series of traits organized around soft tissue functioning spaces (e.g., visual skeletal unit consists of all bone segments that form the bony orbit) rather than in terms of skeletal elements based on individual bones or osseous subdivisions (i.e., splanchnocranium, cranial base, anterior cranial fossa). Still, integration of osseous and soft tissues of the head has rarely been studied empirically.
Brain
The brain of all vertebrates develops from three swellings at the anterior end of the neural tube of the embryo: forebrain (or prosencephalon), mid-brain (mesencephalon), and hindbrain (rhombencephalon). The ultimate morphology of the brain is attained by differential expansion of the named regions of the tube concurrent with folding of these structures upon themselves to produce the component cortical and subcortical structures of the adult brain. Although the adult human brain bears little resemblance to its embryonic form, the named anatomical structures can be mapped to their specific precursors.
Redies and Puelles (2001) outline two types of modularity that underlie the adult vertebrate brain; one based on embryonic divisions of the neural tube, and the other based on mature functional neural circuits (Leise, '90; Jacobs and Jordan, '92; Di Ferdinando et al., 2001; Striedter, 2005). de Winter and Oxnard (2001) showed that functionally related structures were more highly correlated with one another than functionally unrelated structures using the size of various brain components measured across mammalian species. Their results suggested coevolution of brain structures related by function.
Meninges
Mesenchyme that surrounds the brain is initially arranged as a capsular membrane composed of two layers: (1) an inner endomeninx, and (2) an outer ectomeninx (Sperber, 2000). The two innermost coverings of the mature brain, the pia and arachnoid mater, are formed from the endomeninx. The two layers of the ectomeninx, though part of the same membrane, have separate fates. The inner layer of the ectomeninx becomes dura mater and remains unossified (Sperber, 2000), but the external surface of the ectomeninx is both osteo- and chondrogenic and thereby contributes to skull formation. Because the outer surface of the ectomenix differentiates into the inner periosteal layer of neurocranial bones (Moss and Young, '60; Sperber, 2000) and the inner surface directly covers the brain as dura mater, size and shape of the inner surface of neurocranial bones directly reflect the form of the brain.
Interaction of developing brain, meninges and neurocranium: the role of sutures
Evidence of the importance of the interaction between bone, meninges, and brain in the production of skull shape comes from several sources. First, indirect evidence from the evolutionary record demonstrates correspondence in the evolution of skull and brain shapes (Biegert, '63; Radinsky, '68; Hanken, '83; Hanken and Thorogood, '93). Second, certain craniofacial pathologies suggest developmental interactions of skull, meninges, and brain in morphogenesis of the head. As examples: (a) when the brain is absent (anencephaly), the calvarial bones do not form (acrania) (Zhao et al., '96; Dambska et al., 2003; Davies and Duran, 2003; Frey and Hauser, 2003); (b) hydrocephalus results in a greatly increased cerebral mass and thinned, but expanded, calvarial bones (Morimoto et al., 2003); and (c) lack of brain growth (microcephaly) produces a small skull with fused sutures (Chervenak et al., '84). Third, many studies have shown the role of dura as intermediary between brain and skull development. Moss and coworkers (Moss and Young, '60; Moss, '62) focused on the attachment of the falx cerebri and tentorium cerebelli to five sites on the cranial base and reasoned that growth of the brain places mechanical strain on the dura via these connections. He proposed the organization of this strain into forces transmitted to osteogenic cells thus influencing the patency of sutures and, in effect, skull shape. More recently, relationships among micro-strain at cranial sutures, subsequent changes in gene expression, and bone deposition at the sutures has been investigated (Yu et al., 2001; Kopher and Mao, 2003; Kopher et al., 2003; Mao et al., 2003a,b). Additional experimental work using grafted dural and skeletal tissues suggest that dural tissue is independently responsible for maintenance of suture patency via signaling mechanisms and in this way plays a crucial role in determining skull shape (Opperman et al., '93, '95, '98; Bradley et al., '96; Roth et al., '96; Mooney et al., 2001).
Craniosynostosis, the premature fusion of one or more cranial sutures, is an etiologically and pathogenetically heterogeneous condition suggested by skull shape, which predicts the particular suture that is closed prematurely (Morriss-Kay et al., 2001; Wilkie and Morriss-Kay, 2001). Recent research has indicated that not only skull morphologies, but characteristic cortical and sub-cortical brain shapes that are not reflected in the skull, are associated with premature closure of particular sutures (Fig. 2) (Aldridge et al., 2002, 2005a,b; Aldridge, 2004). After verification of suture closure by radiography, treatment of craniosynostosis includes major reconstructive surgery within the first year of life to release the mechanical constraint to normal skull growth and construct a more normally shaped skull. Since cranial sutures are considered primarily as sites of bone growth in humans (Opperman, 2000), premature suture closure is thought to reorient certain vectors of growth thus producing the apparent dysmorphology.
Fig. 2.

Superior view of 3D reconstructions of brain (left) and skull (right) of a morphologically normal child (a), a child with SS (b), and a child with RUCS (c). In all views, the anterior aspect of the head is at the top while the posterior aspect is below. The brain and skull of the SS individual (b) is elongated along the anteroposterior axis and reduced medio-laterally. The sagittal suture is obliterated. The brain of the RUCS individual (c) is obviously deformed on the right anterior aspect and appears somewhat wider than normal. The RUCS skull shows dysmorphology of the right frontal bone and distortion of the sagittal and lambdoid suture patterns. The right coronal suture is closed while the left remains patent. Images are not to scale.
When evolution of the vertebrate skull is considered however, sutures are recognized as much for their role in mediating cranial mechanics as for their contribution to bone growth (Herring, 2000). Vertebrate evolution reveals a general trend of reduced cranial kinesis through the loss or restriction of some intracranial joints (sutures) and reduction in the number of jaw and skull bones (and concurrently the number of sutures). Sidor (2001) quantitatively demonstrated a significant, scale-free reduction in the number of skull bones, either through loss or fusion, over approximately 150 million years of synapsid (mammal and mammal-like reptiles) history, and showed that this trend continued through the Cenozoic.
Though craniosynostosis in humans is considered a pathological condition, evolutionary trends in the mammalian skull and cases of craniosynostosis share two points in common:
decrease in the number of individual cranial elements. Regardless of which suture fuses prematurely, the process reduces the number of isolated cranial elements (i.e., bones) in the skull by one.
obvious changes in craniofacial shape. The form of both skull and brain are significantly different from normal in craniosynostosis and shape changes co-occur with the loss of cranial elements.
In both craniosynostosis and mammalian evolution, reduction in the number of skull bones could result from variation in developmental patterning processes. Though tentative at this point, this general idea is amenable to research at both the molecular and phenotypic levels of analysis. In this study we use three-dimensional (3D) data from human pediatric craniosynostosis patients to determine whether profound and distinct patterns of skull and brain dysmorphology indicate underlying differences in patterns of phenotypic integration. Analysis of these data sets provides information pertaining to how developmental changes alter integration patterns and produce craniofacial variation.
EXPECTATIONS
Craniosynostosis of any of the cranial sutures can present either as an isolated malformation (i.e., nonsyndromic craniosynostosis) or in association with other congenital anomalies in the context of a syndrome. Approximately 85% of craniosynostosis cases are believed to be nonsyndromic and caused by complex gene–gene and/or gene-environment interactions that remain to be identified (Chumas et al., '97; Cohen, 2000). Premature fusion of the sagittal suture results in a dolichocephalic skull and is the most common type of isolated craniosynostosis (Table 1, Fig. 2). Mutations in fibroblast growth factor receptors 1–3 (FGFR1–3) and TWIST that have been associated with syndromic synostosis were not found in 42 sagittal synostosis (SS) patients (Zeiger et al., 2002). An FGFR2 mutation (A315T) was found in one out of 29 patients with isolated sagittal craniosynostosis (Weber et al., 2001). Given the critical role that the fibroblast growth factor family plays in the activation of growth (Martin, '98; Wilkins, 2002), it is easy to imagine their role in a regulatory module that mediates localized signaling systems in the head (Goldfarb, '96; Martin, '98).
TABLE 1.
Epidemiological observations pertaining to sagittal and coronal synostosis
| Diagnosis | % of all craniosynostoses | Birth prevalence estimates (per 10,000 live births) |
Sex distribution |
|---|---|---|---|
| Sagittal synostosis | 40–58 | 1.9–2.3 | 3.5♂:1♀ |
| Unilateral and bilateral coronal synostosis | 20–30 | 0.8–1.0 | 1♂:2♀ |
Data taken from Hunter and Rudd ('76); Lajeunie et al. '95, ('96); Merrer et al. ('88).
Unilateral or bilateral fusion of the coronal suture is the second-most common form of craniosynostosis but the statistics provided in Table 1 may confound two etiologically distinct conditions because bilateral coronal craniosynostosis is most commonly diagnosed as part of a syndrome, while most cases of unilateral coronal craniosynostosis are isolated. Coronal craniosynostosis shows a higher proportion of familial cases (11.5–14.4%) as compared to SS. Moloney et al. ('97) suggested that up to 52% of all cases of isolated coronal craniosynostosis may have the FGFR3 mutation. Lajeunie et al. ('99) identified the same mutation in 20 out of 27 (74%) familial, and in six out of 35 (17%) sporadic coronal cases. Craniosynostosis was present in just 80% of the carriers of this mutation, suggesting incomplete penetrance. It is not known whether the etiologies of bilateral and unilateral coronal craniosynostosis are comparable since unilateral effects require a change in the genetic controls that regulate the development of bilateral symmetry.
We use unique, though small, samples to study phenotypic integration of brain and skull using data from computed tomography (CT) and magnetic resonance (MR) imaging of the head. Since development of brain, meninges, and skull are strongly linked and morphology of the skulls and brains of SS and unilateral coronal synostosis are profoundly different, we expect that:
(1) patterns of phenotypic integration will be different between the SS and unilateral coronal synostosis samples,
(2) the intensity of phenotypic integration will be reduced in the asymmetric cases (right uni-lateral coronal synostosis) relative to the symmetric anomaly (SS) because asymmetric suture closure might require additional changes in a regulatory pathway that guards symmetry in addition to one that regulates the establishment of sutures.
To test these expectations, we adopt novel methods of analysis of morphological integration that provide a bootstrap approach to the statistical comparison of local patterns of phenotypic integration between samples (Cole and Lele, 2002). Our aim is to explore the relationship between skull and brain by quantitatively considering tissues in combination rather than as separate entities. We provide baseline information pertaining to patterns of skull and brain integration that add to the growing body of data supporting views of modularity in head development and do not simply formulate units along anatomically identifiable boundaries.
MATERIALS AND METHODS
Methods for quantifying phenotypic integration
Modern quantitative approaches to the study of morphological integration commonly use matrix correlations to investigate the correspondence of a priori biological hypotheses with empirical patterns of covariation among traits, and permutation tests to evaluate a null hypothesis that the association between two matrices is not different than what would be expected by random chance. Though used routinely, the null hypothesis investigated (that the two matrices are similar) is not very informative, since even rejection of the null does not provide information regarding the specifics of how the two matrices differ (Cole and Lele, 2002).
Instead of using a matrix correlation methodology, we adopt an approach developed originally by Cole and Lele (2002) that is based on the statistical analysis of the differences between the elements of two correlation (or covariance) matrices. Calculations were carried out by MIBoot, a Windows-based software package (Cole, 2002). Suppose that we have two samples, A and B. A correlation matrix is estimated for each of the two samples from the measures taken directly from specimens within the two samples. We denote these matrices as R(A) and R(B). A correlation-difference matrix, RDM, is calculated by subtracting the elements of one matrix from the corresponding elements of the other matrix:
for all i,j = 1,…,p, where p is the number of measurements and i≠j. If the matrices are the same (the null hypothesis), all of these differences are expected to be zero.
When one or more elements of the RDM does not equal zero, the correlation differences can be explored to learn more about these differences. Details of a bootstrap approach for testing the null hypothesis of similarity in correlation values developed by Cole and Lele (2002) are outlined here. We begin with a set of p linear measurements recorded on the skulls and brains of individuals within two samples A and B, with sample sizes of nA and nB, respectively. The steps are as follows:
- (1) Use raw measures or, if the raw data are nonlinear, transform the data to natural logarithms. Compute the sample correlation matrices R(A) and R(B) and use them to compute the empirical correlation-difference matrix:
(2) For sample A, randomly generate a pseudosample of nA independent observations by choosing observations from A randomly and with replacement. Call this sample A*. Similarly, randomly generate a pseudosample B* of nB independent observations from sample B.
- (3) Using the respective pseudosamples, compute bootstrap estimates of the sample correlation matrices, calling them R(A)* and R(B)*. Using these matrices, compute a bootstrap estimate of the correlation-difference matrix:
(4) Repeat the preceding step M times (where M>1,000), to obtain a bootstrap distribution of M independently generated RDM* matrices. This collection of matrices will be used to estimate confidence intervals for the off-diagonal elements of the matrix RDM.
(5) For a given off-diagonal element, RDMij, rank-order all of the corresponding elements . Truncate the extremes of the rank-ordered array to get chosen percentile estimates of the marginal confidence intervals for RDMij (Davison and Hinkley, '97; Hall and Martin, '88). Use to do the same to obtain confidence intervals for each of the remaining elements of RDM. Examine each confidence interval to determine whether it includes zero (the expected value under the null hypothesis). If RDMij does not include zero, reject the null hypothesis of equal associations for that measurement pair.
If parametric bootstrapping is desired, assume that the (raw or ln-transformed) measurements have multivariate normal distributions MVN[xA, S(A)] and MVN[xB, S(B)] respectively, with mean-vector estimates x (a row vector) and variance–covariance matrix estimates S. Nonparametric bootstrapping does not require this assumption. Calculations are carried out by MIBoot (Cole, 2002), a Windows-based software package that offers nonparametric and parametric bootstrapping and calculates 90%, 95%, and 99% confidence intervals. Here we use nonparametric bootstrapping and report 95% confidence intervals.
Each individual generated by step 2 of the bootstrapping algorithm consists of p measurements, and correlations are calculated for each measurement pair. The test of the empirical correlation difference matrix is based on marginal confidence intervals of the bootstrap estimates of the correlation difference matrix. Bonferroni-type corrections are not needed for these marginal confidence intervals in this study for two reasons. First, our goal is not to test biological hypotheses but rather to explore this unique data set through statistical comparisons. Confidence intervals are estimated to generate hypotheses regarding fundamental relations between skull and brain. Though we expect differences, this is an exploratory study and so we do not predict specific linear distances pairs that will show differences in association of brain and skull between the two samples. Our approach offers broad coverage for potential associations between aspects of skull and brain anatomy. Second, our chosen approach does not conduct multiple tests of linear distance pairs (LDPs) using the same data. With each bootstrapping step, all measures are estimated for an individual and correlations between all measurement pairs are computed. The single test takes place in a high-dimensional space where each dimension represents a unique measurement pair. Since we cannot visualize this high-dimensional space, we report the low-dimensional projections of these results for each measurement pair.
Data
The study sample includes 3D whole brain MR images and head CT images of human infants diagnosed with isolated SS or isolated right unilateral coronal synostosis (RUCS). All MR and CT images were acquired for clinical purposes at either the Oklahoma University Medical Center, Oklahoma City, OK or at St. Louis Children's Hospital, St. Louis, MO (Table 2). The data were acquired and used under approved IRB protocols. Beyond quality of the images, the criterion for inclusion of any imaging study in this research is that the pre-operative CT and MR images were acquired within a 24-hr period. The relatively rare occurrence of these craniosynostosis conditions (see following discussion), coupled with our inclusion criteria result in relatively small sample sizes. Although we have samples of MR and CT images of morphologically normal individuals (children who were imaged due to unexplained seizures, suspected concussion, headaches, etc.), we do not have both CT and MR of any morphologically normal individuals and, for this reason, cannot provide information on patterns of association between skull and brain in morphologically normal individuals for comparison.
TABLE 2.
Sample size and imaging parameters used in the study
| Right unicoronal synostosis (RUCS) | Sagittal synostosis (SS) | |
|---|---|---|
| Sample size | 7 (4♀, 3♂) | 11 (2♀, 9♂ |
| Age range (in weeks) | ♀ (8–70) | ♀ (37–80) |
| ♂ (26–86) | ♂ (14–80) | |
| CT parameters | Obtained in the axial plane Pixel size: range 0.38–0.98 mm Slice thickness: range 1.0–2.5 mm |
|
| MRI parameters | Obtained in the sagittal plane using a MPRAGE sequence Pixel size: range 0.9–0.98 mm Slice thickness: range 1.0–1.3 mm |
|
Sex distribution reflects the more common prevalence of sagittal synostosis in males. Ages represent the infant's age at imaging.
Image data were transferred from the hospitals for archive and data collection. Three-dimensional reconstructions were produced from the CT image data, and the 3D coordinate locations of 13 neurocranial landmarks (Table 3, Fig. 3) were collected using eTDIPS, a multi-dimensional volume visualization and analysis software, co-developed by the National Institutes of Health and the National University of Singapore. For the MR data, all non-neural tissue was first stripped from each slice image following a semi-automated procedure (Aylward et al., '97; Buchanan et al., '98). A 3D reconstruction of the remaining brain tissue was produced using MEASURE software (Barta et al., '97) and the 3D locations of 12 neural landmarks, representing cortical and subcortical structures, were recorded for each individual (Table 3, Fig. 3).
TABLE 3.
Skeletal and neural landmarks collected from CT and MR images respectively and used in analysis
| Abbreviation | Description |
|---|---|
| CT calvarial landmarks (“R” preceding an abbreviation indicates a bilateral landmark and stands for right side) | |
| BRG | Bregma |
| LAM | Lambda |
| NAS | Nasion |
| RAST | Asterion |
| RFZJ | Fronto-zygomatic junction |
| RPTNP | Pterion posterior |
| CT internal cranial base landmarks (“R” preceding an abbreviation indicates a bilateral landmark and stands for right side) | |
| BAS | Basion |
| OPI | Opisthion |
| RACP | Anterior clinoid process |
| RFOV | Foramen ovale |
| RIAM | Internal acoustic meatus |
| CT external cranial base landmarks | |
| VSJ | Vomer–sphenoid junction |
| RJUG | Jugular process |
| MRI subcortical landmarks(“R” preceding an abbreviation indicates a bilateral landmark and stands for right side) | |
| AC | Midline of anterior commissure |
| IP | Midline, most inferior aspect of the pons |
| PC | Midline of posterior commissure |
| 4VP | Midline, posterior-most aspect of the 4th ventrical |
| RAMY | Centroid of amygdala |
| RCN | Centroid of head of caudate nucleus |
| RTH | Centroid of thalamus |
| RVP | Tip of posterior horn of lateral ventricle |
| MRI cortical surface landmarks (“R” preceding an abbreviation indicates a bilateral landmark and stands for right side) | |
| RFP | Frontal pole |
| RFSS | Posterior termination of the superior frontal sulcus |
| ROP | Occipital pole |
| RSF | Posterior termination of the Sylvian fissure |
Landmarks are pictured in Figure 3. The abbreviation for each landmark and a short descriptive name are given here. Landmarks are classified according to broad regional categories though some landmarks could be put into more than one category. More detailed definitions of these landmarks can be found on the Richtsmeier laboratory website: http://getahead.psu.edu
Fig. 3.

Brain and skull landmarks used in this analysis labeled with abbreviations described in Table 3. The top row represents 3D CT reconstructions of the skull of a child diagnosed with RUCS. Views from left to right are: lateral view of the skull, superior view of the endocranial base, and inferior view of the ectocranial base. Starting at left, the bottom row shows 3D MRI reconstructions of: right lateral surface of the brain (posterior at left, anterior to right), and superior surface of the cerebrum (anterior at top, posterior at bottom). The figure at right represents a lateral view of landmarks located on a model of subcortical structures within the 3D MR images (posterior at left, anterior to right). The approximate location of landmarks AC, PC and 4VP are shown on this view though their true anatomical location lies on the sagittal plane.
Anatomical landmarks are biologically meaningful, specific loci that can be repeatedly located with a high degree of accuracy and precision (Richtsmeier et al., '95; Lele and Richtsmeier, 2001). Landmark location and labels for both brain and skull are given in Figure 3, while detailed anatomical definitions for these landmarks collected from CT and MR images can be found on the landmark collection page of the Richtsmeier laboratory website, http://getahead.psu.edu. Measurement error for these 3D landmark data sets was evaluated following methods presented previously (Valeri et al., '98; Aldridge, 2004) and minimized statistically by digitizing each specimen two times, checking for overt or gross error (e.g., mislabeling of left and right sides), and using the average of two data collection trials.
Research design
We begin with landmark data for skull collected from 3D CT and brain from MR of each individual (Fig. 3). As MR and CT images were acquired separately, we did not attempt to register them in the same coordinate system. Consequently we did not consider distances that join a landmark on the brain with one on the neurocranium. Instead, linear distances between landmarks were calculated separately for skull and for brain. For example, from the skull landmarks (number of landmarks represented as KS), the linear distances for all unique landmark pairs are calculated. This set includes KS(KS–1)/2 linear distances. For the landmarks collected from MR images of the brain, KB, the set includes KB(KB–1)/2 linear distances. Since measures such as skull breadth and hemisphere length reflect the combination of the effects of localized measures, we focus here on a subset of 61 linear distances (27 from brain and 34 from skull) on the right side of the head that traverse local areas rather than linear distances that pass through whole anatomical structures. This is done to allow evaluation of differences in localized patterns of phenotypic integration.
Our analytical approach to phenotypic integration is based on a pairwise comparison of correlation matrices. For each sample, RUCS and SS, correlation matrices are estimated for the correspondence between pairs of linear distances (one measuring skull, the other measuring brain). Given the number of linear distances considered in each study, the number of linear distance pairs (LDPs) analyzed was large; a total of 918 LDPs per correlation matrix. We use these matrices to explore patterns of phenotypic integration within each sample, and statistically test for differences in the strength of correlations of specific LDPs between the samples by confidence interval, thereby summarizing inter-sample differences in patterns of phenotypic integration.
RESULTS
Differences in size of skull and brain in RUCS and SS
To determine the role that brain size might have in determining the relationship between brain and skull in these two samples, we statistically compared brain size in SS and RUCS. Using a bootstrapping procedure to estimate confidence intervals (α = 0.05) for the difference in scale (Lele and Cole, '96), we found no significant difference in brain size measured as the geometric mean of all neural linear measures (SS geometric mean = 51.08; RUCS geometric mean = 48.19). Similarly, we found no significant difference in skull size between SS and RUCS estimated as the geometric mean of all skull linear distances (SS = 56.78, RUCS = 54.41).
Using the same nonparametric approach, the samples were similarly explored for sexual dimorphism of brain and skull size within diagnostic categories. Using the geometric mean of the distances, we found no significant difference between sexes in scale of brain or skull using the study samples. Though samples are exceedingly small, on the basis of the results of these nonparametric tests, we pooled male and female infants in our analysis. These relationships need to be explored further with larger data sets.
Overall patterns of phenotypic integration of skull and brain
Figure 4 summarizes both the strength and pattern of raw correlation coefficients between measures of the skull and of the brain for SS and RUCS individuals. The correlation matrices for the two craniosynostosis samples are neither equivalent, nor are they proportional, but they do overlap for many measures. The majority of correlation coefficients in both groups are moderately to strongly positive (Table 4), though the RUCS coefficients are more uniformly positive, indicating more generalized positive associations between brain and skull dimensions in the asymmetric condition of RUCS than in the symmetric case of SS. However, there is marked variation in both strength and sign of associations between brain and skull LDPs in both samples (Table 4, Fig. 4).
Fig. 4.

A plot of the elements of the correlation matrices for our two samples. The magnitudes of the raw correlation coefficients are plotted on the Y-axis, while the LDPs are on the X-axis. Each open square represents the correlation coefficient for a pair of linear distances measured on the RUCS sample, one measured on the brain and another measured on the skull. Correlation coefficients for pairs of linear distances measured on SS are designated by closed triangles. The measurement pairs are sorted from left to right in terms of the magnitude of the differences in correlation between the samples, thus the correlations for the two synostosis groups are plotted in the same order. An interactive version of this figure is available on our laboratory website (http://getahead.psu.edu) which allows the user to point to any given symbol and the value for any specific LDP is provided.
TABLE 4.
Descriptive statistics of correlation coefficients for the SS and RUCS samples
| Correlation coefficients |
|||
|---|---|---|---|
| Sample | Mean value |
Standard deviation |
Range |
| RUCS | 0.648 | ±0.27 | −0.504 to 0.99 |
| SS | 0.489 | ±0.28 | −0.47 to 0.95 |
Confidence intervals calculated for inter-sample difference in correlations between skull and brain measures indicate that 89% of the LDPs show no statistical difference in the strength of association between RUCS and SS (Fig. 5). This reveals an overall similarity in the statistical association of measures of the skull and brain in these synostosis samples. There are only two LDPs for which the SS sample shows significantly stronger associations than observed in the RUCS sample (RACP-to-NAS with RSF-to-RFSS and RACP-toBRG with ROP-to-AC). In contrast, 99 LDPs (11%) are significantly more strongly correlated in the RUCS sample (Figs. 5 and 6). We discuss those regions that show an increased degree of phenotypic integration of skull and brain in RUCS below.
Fig. 5.

Differences in raw correlation values and associated confidence interval limits for comparison of correlations between measures of skull and brain in RUCS and SS. Correlation difference values are shown as filled diamonds with the associated 95% confidence interval limits (CI upper and CI lower) estimated by bootstrapping shown as open squares. Correlation differences are sorted from minimum (indicating the correlation value for RUCS is greater than the associated value in the SS sample) to maximum. The black horizontal line intersecting the Y-axis at 0 represents the null hypothesis of no difference between RUCS and SS correlations. The shaded gray square includes those linear distances in which the correlation coefficients calculated for RUCS are shown to be significantly different from SS by confidence interval. An interactive version of this figure is available on our laboratory website (http://getahead.psu.edu) which allows the user to point to any given symbol and the value for any specific LDP is provided.
Fig. 6.

Correlation coefficients for the 99 LDPs that show significantly stronger correlation in RUCS as compared to SS by confidence interval. The correlation differences shown in the shaded gray square on the far left of Fig. 5 were computed from the correlation coefficients shown on this graph. The osseous linear distance of the skull-brain LDPs are labeled along the X-axis. An interactive version of this figure is available on our laboratory website (http://getahead.psu.edu), which allows the user to point to any given symbol and the value for any specific LDP is provided.
Localized patterns of increased phenotypic integration of brain and skull in RUCS
The skull and brain LDPs that show significantly different associations between SS and RUCS are shown in Figures 7-10. In these figures, skull measures (shown in red) are more strongly associated with brain measures (shown in blue and green) in RUCS. The following discussion is organized around the cranial measures, although this choice is arbitrary.
Fig. 7.
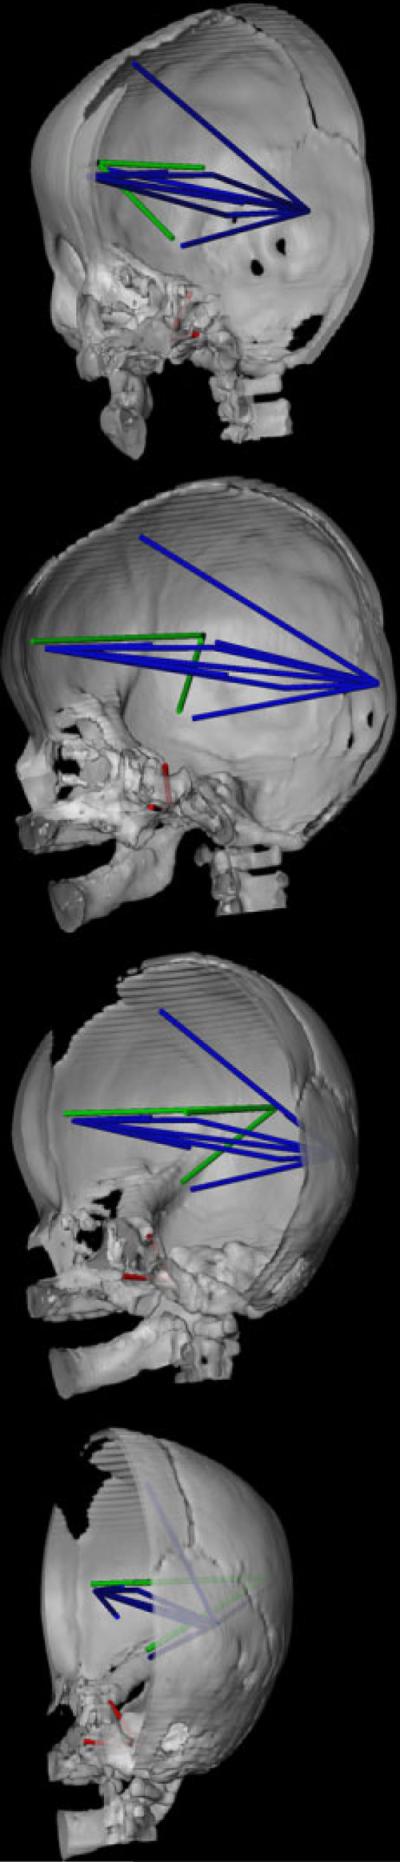
CT reconstruction of the skull (right half of skull and mandible shown) to show distances on the skull (in red) and the brain (in blue and green) that are associated differently in RUCS and SS. Orientation of the views are given with reference to the orientation of the face. When the nasal bones point directly at the reader, the skull is at 0°. As the skull rotates to its right, we provide views (from top to bottom in the panel) at approximately 30° (top), 90°, 120°, and 170°. This figure depicts those measures of the brain (in blue) that are significantly more strongly associated in RUCS with two measures on the cranial base shown in red: VSJ-to-RFOV and RACP-to-RFOV. Linear distances among neural landmarks shown in green are more strongly associated with the distance between cranial base landmarks RACP-to-RFOV in RUCS as compared to SS. Refer to text for further discussion.
Fig. 10.
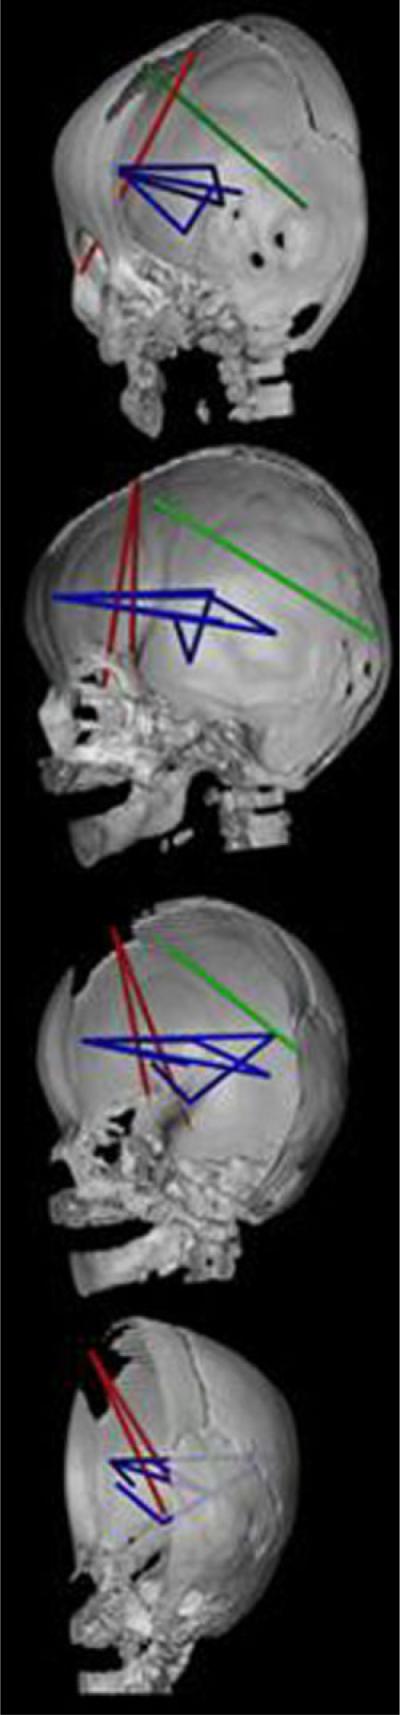
CT reconstruction of the skull (right half of skull and mandible shown) to show distances on the skull (in red) and the brain (in blue and green) that are associated differently in RUCS and SS. Orientations of the views are the same as those in Figure 7. This figure depicts those measures of the brain that are significantly more strongly associated with two measures of the anterior cranial vault shown in red: RPTNP-to-BRG and RFZJ-to-BRG. Linear distances among neural landmarks shown in blue are more strongly associated with both skull measures in RUCS. The single measure of the brain shown in green (RFSS-to-ROP) is more strongly associated with RFZJ-to-BRG. Refer to text for further discussion.
Anterior and middle cranial fossa
The majority of the strongest differences between these two samples involve the association of multiple brain measures with two linear distances on the anterior cranial base: (1) vomer-sphenoid junction to right foramen ovale (VSJ-to-RFOV) and (2) RFOV to right anterior clinoid process (RFOV-to-RACP) (shown in red in Fig. 7). The distance VSJ-to-RFOV represents a mediolateral (ML) distance between a midline osseous point, linking the junction of the external cranial base and the posterior margin of the bony nasal septum with the floor of the middle cranial fossa. The distance RFOV-to-RACP is oriented along the superoinferior (SI) axis, connecting the floor of the middle cranial fossa with the most posterior point of the anterior cranial fossa. Correlations between these two osseous measures and many anteroposterior (AP) dimensions of the brain are high and positive in the RUCS sample (the majority are > 0.80) (Fig. 6). In contrast, correlations between VSJ-to-RFOV and neural measures are primarily negative in the SS sample (ranging from −0.46 to 0.19; Fig. 6). Correlations between RFOV-to-RACP and these same neural measures are low to moderately positive in the SS sample (ranging from 0.103–0.559).
The neural measures (Fig. 7, in blue) that show stronger association with these cranial base measures in RUCS include distances that measure: (1) AP and SI dimensions of posterior aspects of the cerebrum, measured from the occipital pole on the cortical surface to various cortical and subcortical landmarks; (2) AP dimensions of anterior aspects of the cerebrum measured from the frontal pole on the cortical surface to various subcortical points; and (3) overall cerebral length.
There is an additional set of significant differences between RUCS and SS in the association between the brain and the linear distance RFOV-to-RACP (Fig. 7). These three neural measures (shown in green in Fig. 7) share a single endpoint on the lateral cortical surface (RSF) and measure AP and ML dimensions of the frontal and parietal lobes of the cerebrum. These linear distances occupy an endocranial space that traverses the (fused) coronal suture in RUCS and are strongly positively associated with RFOV-to-RACP in RUCS but show a mild negative association in SS.
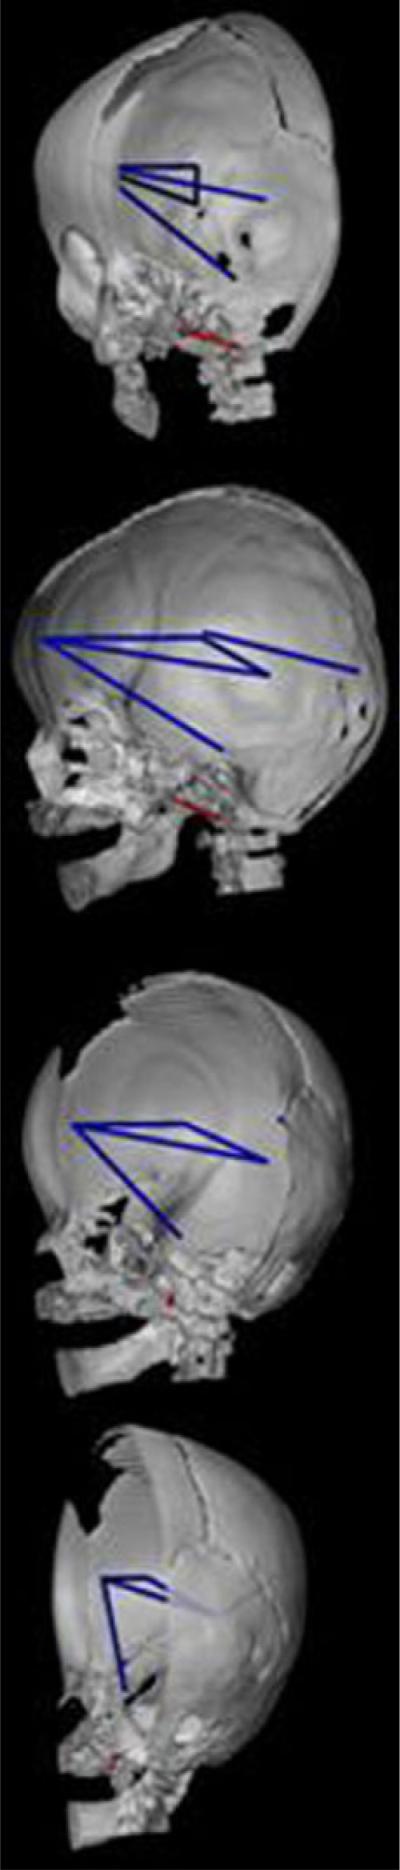
Posterior cranial fossa
Two osseous linear distances that together describe dimensions of the posterior cranial fossa and the relative position of foramen magnum (right asterion to basion (RAST-to-BAS) and RAST to opisthion (RAST-to-OPI)) are both significantly more strongly associated with five dimensions of the cerebrum in RUCS (Fig. 8). The brain linear distances are centrally located (blue lines), and oriented along the AP and SI axes. The primarily SI dimensions join the temporal pole to the lateral cortical surface (RAMY-to-RSF) and to a midline subcortical point (RAMY-to-AC). The remaining linear distances connect the occipital pole with the frontal cortical surface (ROP-to-RFSS), the frontal pole to the lateral cortical surface (RFP-to-RSF), and the thalamus with the posterior horn of the lateral ventricle (RTH-to-RVP) subcortically. These associations between measures of the skull and brain are designated by high and positive correlations in RUCS, as compared to moderate positive correlations in SS.
Fig. 8.
CT reconstruction of the skull (right half of skull and mandible shown) to show distances on the skull (in red) and the brain (in blue) that are associated differently in RUCS and SS. Orientations of the views are the same as given in Figure 7. This figure depicts those measures of the brain that are significantly more strongly associated with two measures on the cranial base shown in red: RAST-to-BAS and RAST-to-OPI. Linear distances among neural landmarks shown in blue are more strongly associated with both skull measures in RUCS. See text for further discussion.
Posterior cranial base
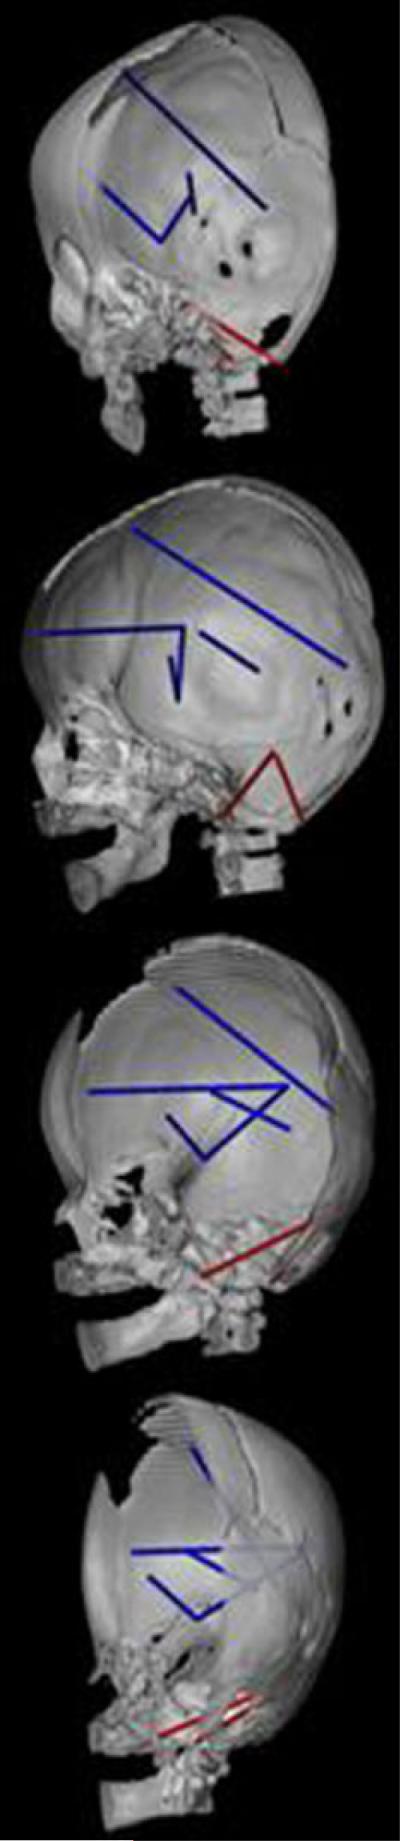
The interval between foramen ovale and the anterior edge of foramen magnum (RFOV-to-BAS) in the posterior cranial fossa shows significantly stronger associations with measures that connect the frontal pole to the pons (RFP-to-IP), to the posterior horn of the lateral ventricle (RFP-to-RVP), and to the thalamus (RFP-to-RTH) (Fig. 9). This skull measure (RFOV-to-BAS) is also more strongly associated with a single measure of the posterior aspect of the cerebrum (RSF-to-ROP) and with a subcortical measure between the posterior aspect of the lateral ventricle and the thalamus (RVP-to-RTH).
Fig. 9.
CT reconstruction of the skull (right half of skull and mandible shown) to show distances on the skull (in red) and the brain (in blue) that are associated differently in RUCS and SS. Orientations of the views are the same as those in Figure 7. This figure depicts those measures of the brain that are significantly more strongly associated in RUCS with a single measure of the cranial base shown in red: RFOV-to-BAS.
Anterior cranial vault
Two dimensions of the skull that reflect anterior skull height and encase the suture prematurely closed in RUCS (RPTNP-to-BRG and RFZJ-to-BRG) show significantly stronger positive associations with AP measures of the anterior portion of the cerebrum in RUCS as compared to SS (Fig. 10). The neural measures include linear distances from the frontal pole to the Sylvian fissure (RFP-to-RSF), to the lateral ventricle (RFP-to-RVP), to the thalamus (RFP-to-RTH), and to the posterior commissure (RFP-to-PC) (Fig. 10). These two skull measures are also disproportionately positively associated with subcortical measures from the anterior commissure to the amygdala (AC-to-RAMY), between the thalamus and posterior lateral ventricle (RTH-to-RVP), and the distance between the amygdala and the Sylvian fissure (RAMY-to-RSF) in RUCS relative to SS. The more anterior of these two skull measures (RFZJ-to-BRG) is also significantly more strongly associated with an oblique AP/SI measure of the posterior aspect of the cerebrum in RUCS (RFSS-to-ROP shown in green in Fig. 10).
The discussion above highlights some of the significant differences in morphological integration of brain and skull that we have quantified between the two samples studied here. We reiterate that 89% of the LDPs studied showed no significant difference in phenotypic integration patterns of brain and skull between RUCS and SS and that the majority of the measures were strongly positive.
DISCUSSION
Our study represents the first empirical evidence of phenotypic integration of brain and skull in 3D, although indirect evidence has been accumulating for years. We interpret the observed differences in patterns of phenotypic integration of brain and skull between the two samples to be due to differences in development and reflective of the etiology of the two conditions.
We presented two expectations earlier in this paper. The first, that patterns of phenotypic integration would be different between the two samples, was supported, at least in part, by our data (Figs. 5-10). Localized patterns of phenotypic integration distinguish the two craniosynostosis samples, but the overwhelming finding is one of similarity in patterns of strong positive associations between skull and brain. The second expectation, that the intensity of phenotypic integration will be reduced in RUCS, was not supported by our data. In fact, RUCS showed an increased average measure of phenotypic integration as well as significantly stronger associations between brain and skull for particular measures (11% of the measurement pairs). Our results provide a basis for the formulation of novel hypotheses regarding the etiology of isolated craniosynostosis (see below), as well as the processes responsible for the reduction in cranial elements over evolutionary time.
Of the skull measures that show significantly increased association with neural dimensions in RUCS relative to SS, only one set includes bony dimensions that are anatomically proximate to the prematurely closed suture (Fig. 10). The majority of significantly increased associations involve dimensions of the cranial base, especially those local to the middle and posterior cranial fossae. These observations are intriguing, as it has long been known that the cranial base is dysmorphic in craniosynostosis, and cranial base dysmorphology has been proposed by some to be fundamental to the etiology of premature suture closure (Moss and Young, '60; Richtsmeier et al., '91). This hypothesis notwithstanding, cranial sutures are primarily considered as bone growth sites and closure of the suture is the favored hypothesis concerning the origin of any isolated craniosynostosis condition (see for example the excellent review by Opperman (2000)). The suture remains the primary focus of most craniosynostosis research. Although we do not have a morphologically normal sample to use in this study, we predict that if premature suture closure is both the cause and the effect of the condition called craniosynostosis, then detectable changes in associations of brain and skull measures (either strengthened or weakened) close to the site of suture closure should occur. Our comparison of two craniosynostosis samples does not emphasize differences in association among measures of brain and skull adjacent to either closed suture.
In clinical terms, craniosynostosis is considered a pathological condition. The logical assumption is that dysmorphology is associated with decreased morphological integration. However, several recent studies have uncovered patterns demonstrating increased phenotypic variation coupled with increased morphological integration in cases of genetic mutation or chromosomal anomalies (Richtsmeier et al., 2002, 2003; Hallgrímsson et al., 2005). Hallgrímsson et al. (2006) posit that the increase in both phenotypic variance and morphological integration in the skulls of brachymorph mice are related; local variation introduced by the specific mutation has secondary (epigenetic) effects throughout the skull. In the brachymorph example, the genetic insult results in a morphogenetic event local to the cartilaginous cranial base and other components are then adjusted in response to this dysmorphology. The authors view the increase in integration as an obvious consequence of the developmental relationships among craniofacial components.
To explore the expectation that among-individual variation is increased in RUCS, we compared the variances for the ln-transformed data following VanValen (2005). Our results suggest that overall RUCS is more variable than SS (Fig. 11). However, the magnitude of the variances of brain measurements are nearly identical in the two samples. Consequently, the difference in overall variation can be attributed to a greater degree of variation in skull measurements in the RUCS sample. The sample sizes are far too small, relative to the number of measurements, to do any statistical testing, so these relationships remain tentative until they can be confirmed with additional data sets.
Fig. 11.

Variances of linear distance data (ln) for brain, skull, and brain skull combined (total) for the RUCS and SS samples. Variance calculations follow VanValen (2005).
The generally strong and positive associations presented here suggest that brain, meninges, and skull are interacting in coordinated and integrated ways with changing patterns of suture closure. Although our analysis cannot offer any evidence of the genetic underpinnings of these relationships, we consider the position, patterning, patency, and closure of sutures as a progression regulated by hierarchical processes of developmental control. Jiang et al. (2002) demonstrated in the mouse skull that both the coronal and sagittal sutures are formed at neural crest-mesoderm interfaces. The authors found evidence of these tissue juxtapositions as early as embryonic day 9.5 in the mouse, before calvarial ossification begins. Importantly, while ossification of the neural crest-derived frontal bone is seemingly autonomous, ossification of the parietal bones requires interaction with the underlying meninges that are neural crest derived (Jiang et al., 2002). Our analysis of morphological integration of brain and skull reveals strong positive associations between these tissues with little support for craniosynostosis as a strictly local phenomenon. Developmental modules of the head may bear less resemblance to what we recognize as hierarchical units of mature anatomy than we might expect.
Köntges and Lumsden ('96) demonstrated a highly constrained pattern of connectivity between cranial skeletal and muscular tissue. Each rhombomeric population of neural crest cells was found to remain invariable throughout ontogeny, forming both the connective tissues of specific muscles and the bony tissue of their respective attachment sites on the skull. This coherence explains how cranial skeletomuscular patterns can be conserved over evolutionary time despite the diversity of skull shapes (Köntges and Lumsden, '96). Matsuoka et al. (2005) recently demonstrated a precisely defined code of connectivity that mesenchymal stem cells of both neural crest and mesodermal origin follow when forming muscles and skeleton of the head and neck. The authors identified cryptic cell boundaries traversing the skeleton of the neck and shoulders that have little to do with anatomical definition of muscle and bone margins and hypothesize a shared molecular basis for muscle patterning and osteogenic differentiation from single embryonic cell populations.
On the basis of these findings, we speculate that if individual mesenchymal cell populations can be directed to form the connective tissue of muscle, as well as the bone of osseous muscle attachment points, a similar dural scaffold system with an equally precise code of connectivity between bone and neural tissue may exist that explains the evolutionary history of the vertebrate head. This scaffold would allow flexibility (e.g., in suture patterning and the loss of bony elements) while being subject to other constraints. Importantly, this hypothetical scaffold system could relate primarily (or solely) to the formation of specific regions of the endocranial surface of skull bones while their ectocranial surfaces might be composed of other cell populations and/or respond to other regulatory systems that perhaps, combine to define suture patterns of the skull. Detailed examples of the modifications in genetic architecture underlying the evolution of vertebrate neck, shoulder and limb diversity, insect wing diversity, and changes in body segmentation patterns (e.g, Carroll, '95, 2001, 2005; Köntges and Lumsden, '96; Wilkins, 2002; Matsuoka et al., 2005) provide ideas, though vague at this stage, about the mechanisms of regulatory genetic hierarchies potentially accountable for changes in cranial suture patterning. The existence of such conserved cell population boundaries controlled by genetic hierarchies would also explain why the strongest associations among brain and skull in our craniosynostosis cases are not necessarily proximate to the closed suture. If modifications in suture patterning are indeed due to changes in gene regulatory networks, then the changes in suture pattern and skull shape may be clinically (and paleontologically) the most evident changes, but perhaps not the most fundamental changes, affecting the organization of the relationships between brain, meninges and skull.
The broad diversity, but general conservation, of aspects of skull shape across all vertebrates suggests that development progresses through a common regulatory program. While the output of mesoderm/neural crest interaction (bone formation) may be conserved, diversification of cranial suture patterning could arise by changes in the regulatory hierarchies of genetic control, shifting spatial boundaries of these hierarchies or gene expression domains, and/or changes in the assortment of target genes regulated by the initiation of bone formation. Obvious changes in skull shape over evolutionary time may be coupled with shifting suture patterns that are coupled with soft tissue changes. Internal constraints on connectivities between dura, neural tissue, and skull may also condition the shape of realized forms. Formation and closure of a suture, whether premature or at the appropriate time, may simply be a consequence of suture patterning determined by the regulatory hierarchy.
An important issue facing evolutionary developmental biology is to understand the developmental mechanisms that regulate variability in natural populations, as well as their significance in both evolutionary and biomedical contexts (Hallgrímsson et al., 2002). We cannot at this time provide empirical evidence of our ideas of regulatory networks controlling cranial suture patterning. We have simply offered an example that, although diagnosed as a disorder in human populations, may provide insight into a demonstrated trend in synapsid evolution (Sidor, 2001), as well as into a somewhat common variant in natural populations (Schultz, '60; Smith et al., '77; Corner and Richtsmeier, '92; Mooney et al., '94). Our ideas are not inconsistent with the findings of single mutations associated with premature suture closure (Wilkie and Morriss-Kay, 2001). Since much of evolution occurs by adjustments in developmental programs, and because evolutionary changes in development can arise from modifications in the operation of regulatory hierarchies, changes in patterns of suture closure or ossification center formation may not require mutations of specific single genes, though such mutations could certainly be involved.
The difference between studies of the reduction in synapsid cranial elements over evolutionary time and craniosynsostosis in modern humans is based on the differing foci of biomedicine on one hand, and evolutionary developmental biology on the other. Modern biomedicine is aimed at finding the proximate cause of any condition so that a therapy can be designed to prevent or fix the observed problem. Evolutionary developmental biology focuses on the developmental basis for morphological variation and trait evolution and therefore requires an understanding of how animal form is generated (Carroll, 2001). An explanation of morphogenesis and morphological variation that considers serial and parallel gene functions that act within and between regulatory hierarchies, though perhaps more complex to unravel than the mechanics of a single gene mutation, is a more satisfying explanation for the pattern observed in cranial evolution, and perhaps for the human condition generally known as craniosynostosis.
ACKNOWLEDGMENTS
We thank Tim Ryan for excellent assistance with computer graphics. Cheryl Hill and Brenda Frazier provided helpful comments on previous versions of this manuscript.
Grant sponsor: PHS Grants; Grant numbers: R01-HD38384, P01-HD024605, and R01-DE016886.
LITERATURE CITED
- Aldridge K. Organization of the human brain: development, variability and evolution. Johns Hopkins University; Baltimore: 2004. PhD Dissertation. [Google Scholar]
- Aldridge K, Marsh JL, Govier D, Richtsmeier JT. Central nervous system phenotypes in craniosynostosis. J Anat. 2002;201:31–39. doi: 10.1046/j.1469-7580.2002.00074.x. [DOI] [PMC free article] [PubMed] [Google Scholar]
- Aldridge K, Kane A, Marsh J, Govier D, Richtsmeier JT. Relationship of brain and skull in pre- and post operative sagittal synostosis. J Anat. 2005a;206:373–385. doi: 10.1111/j.1469-7580.2005.00397.x. [DOI] [PMC free article] [PubMed] [Google Scholar]
- Aldridge K, Kane A, Marsh J, Panchal J, Boyd S, Yan P, Govier D, Ahmad W, Richtsmeier JT. Brain morphology in non-syndromic unicoronal craniosynostosis. Anat Rec A Discov Mol Cell Evol Biol. 2005b;285:690–698. doi: 10.1002/ar.a.20201. [DOI] [PubMed] [Google Scholar]
- Aylward E, Habbak R, Warren A, Pulsifer M, Barta P, Jerram M, Pearlson G. Cerebellar volume in adults with Down syndrome. Arch Neurol. 1997;54:209–212. doi: 10.1001/archneur.1997.00550140077016. [DOI] [PubMed] [Google Scholar]
- Barta P, Dhingra L, Royall R, Schwartz E. Improving stereological estimates for the volume of structures identified in three-dimensional arrays of spatial data. J Neurosci Meth. 1997;75:111–118. doi: 10.1016/s0165-0270(97)00049-6. [DOI] [PubMed] [Google Scholar]
- Biegert J. The evaluation of characteristics of the skull, hands, and feet for primate taxonomy. In: Washburn SL, editor. Classification and human evolution. Aldine Publishing Company; Chicago: 1963. pp. 116–145. [Google Scholar]
- Bradley J, Levine J, Blewett C, Krummel T, McCarthy J, Longaker M. Studies in cranial suture biology: in vitro cranial suture fusion. Cleft Palate Craniofac J. 1996;33:150–156. doi: 10.1597/1545-1569_1996_033_0150_sicsbv_2.3.co_2. [DOI] [PubMed] [Google Scholar]
- Buchanan R, Vladar K, Barta P, Pearlson G. Structural evaluation of the prefrontal cortex in schizophrenia. Am J Psychiatry. 1998;155:1049–1055. doi: 10.1176/ajp.155.8.1049. [DOI] [PubMed] [Google Scholar]
- Carroll S. Homeotic genes and the evolution of arthropods and chordates. Nature. 1995;376:479–485. doi: 10.1038/376479a0. [DOI] [PubMed] [Google Scholar]
- Carroll S. From DNA to diversity: molecular genetics and the evolution of animal design. Blackwell; Oxford: 2001. [Google Scholar]
- Carroll SB. Evolution at two levels: on genes and form. PLoS Biol. 2005;3:e245. doi: 10.1371/journal.pbio.0030245. [DOI] [PMC free article] [PubMed] [Google Scholar]
- Chernoff B, Magwene P. Afterword. In: Olson E, Miller R, editors. Morphological integration. University of Chicago Press; Chicago: 1999. pp. 319–348. [Google Scholar]
- Chervenak F, Jeanty P, Cantraine F, Chitkara U, Venus I, Berkowitz R, Hobbins J. The diagnosis of fetal microcephaly. Am J Obstet Gynecol. 1984;149:512–517. doi: 10.1016/0002-9378(84)90027-9. [DOI] [PubMed] [Google Scholar]
- Cheverud J. Phenotypic, genetic, and environmental morphological integration in the cranium. Evolution. 1982;36:1737–1747. doi: 10.1111/j.1558-5646.1982.tb05070.x. [DOI] [PubMed] [Google Scholar]
- Cheverud J. A comparison of genetic and phenotypic correlations. Evolution. 1988;42:958–968. doi: 10.1111/j.1558-5646.1988.tb02514.x. [DOI] [PubMed] [Google Scholar]
- Cheverud J. Morphological integration in the saddle-back tamarin (Saguinus fuscicollis) cranium. Am Nat. 1995;145:63–89. [Google Scholar]
- Cheverud J. Developmental integration and the evolution of pleiotropy. Am Zool. 1996;36:44–50. [Google Scholar]
- Chumas P, Cinalli G, Arnaud E, Marchac D, Renier D. Classification of previously unclassified cases of craniosynostosis. J Neurosurg. 1997;86:177–181. doi: 10.3171/jns.1997.86.2.0177. [DOI] [PubMed] [Google Scholar]
- Cohen MJ. Craniosynostosis: diagnosis, evaluation, and management. Oxford University Press; New York: 2000. [Google Scholar]
- Cole TM., III . MIBoot Windows-based software for bootstrap-based comparison of morphological integration patterns. U of Missouri-Kansas City School of Medicine; Kansas City: 2002. [Google Scholar]
- Cole TM, III, Lele S. Bootstrap-based methods for comparing morphological integration patterns. Am J Phys Anthropol. 2002;34(Suppl):55. [Google Scholar]
- Corner BD, Richtsmeier JT. Experiments of nature: premature unicoronal cranial synostosis in mantled howler monkeys (Alouatta palliata) Cleft Palate Craniofac J. 1992;29:143–151. doi: 10.1597/1545-1569_1992_029_0143_eonpuc_2.3.co_2. [DOI] [PubMed] [Google Scholar]
- Dambska M, Schmidt-Sidor B, Maslinska D, Laure-Kamionowska M, Kosno-Kruszewska E, Deregowski K. Anomalies of cerebral structures in acranial neonates. Clin Neuropathol. 2003;22:291–295. [PubMed] [Google Scholar]
- Davies BR, Duran M. Malformations of the cranium, vertebral column, and related central nervous system: morphologic heterogeneity may indicate biological diversity. Birth Defects Res Part A Clin Mol Teratol. 2003;67:563–571. doi: 10.1002/bdra.10080. [DOI] [PubMed] [Google Scholar]
- Davison AC, Hinkley DV. Bootstrap methods and their applications. Cambridge University Press; Cambridge: 1997. [Google Scholar]
- de Winter W, Oxnard CE. Evolutionary radiations and convergences in the structural organization of mammalian brains. Nature. 2001;409:710–714. doi: 10.1038/35055547. [DOI] [PubMed] [Google Scholar]
- Di Ferdinando A, Calabretta R, Parisi D. Evolving modular architectures for neural networks. In: French R, Sougne J, editors. Proceedings of the sixth neural computation and psychology workshop: evolution, learning, and development. Springer-Verlag; London: 2001. pp. 253–262. [Google Scholar]
- Francis-West PH, Robson L, Evans DJR. Craniofacial development: the tissue and molecular interactions that control development of the head. Springer; Berlin: 2003. [DOI] [PubMed] [Google Scholar]
- Frey L, Hauser WA. Epidemiology of neural tube defects. Epilepsia. 2003;44(Suppl 3):4–13. doi: 10.1046/j.1528-1157.44.s3.2.x. [DOI] [PubMed] [Google Scholar]
- Goldfarb M. Functions of fibroblast growth factors in vertebrate development. Cytokine Growth Factor Rev. 1996;7:311–325. doi: 10.1016/s1359-6101(96)00039-1. [DOI] [PubMed] [Google Scholar]
- Hall P, Martin M. On the bootstrap and two-sample problems. Austr J Stat. 1988;30A:179–192. [Google Scholar]
- Hallgrímsson B, Willmore K, Hall BK. Canalization, developmental stability, and morphological integration in primate limbs. Am J Phys Anthropol Suppl. 2002;35:131–158. doi: 10.1002/ajpa.10182. [DOI] [PMC free article] [PubMed] [Google Scholar]
- Hallgrímsson B, Willmore K, Dorval C, Cooper DM. Craniofacial variability and modularity in macaques and mice. J Exp Zoolog Part B Mol Dev Evol. 2004;302:207–225. doi: 10.1002/jez.b.21002. [DOI] [PubMed] [Google Scholar]
- Hallgrímsson B, Brown J, Ford-Hutchinson A, Sheets H, Zelditch M, Jirik F. The brachymorph mouse and the developmental-gentic basis for canalization and morphological integration. Evol Dev. 2006;8 doi: 10.1111/j.1525-142X.2006.05075.x. in press. [DOI] [PubMed] [Google Scholar]
- Hanken J. Miniaturization and its effects on cranial morphology in plethodontid salamenders, genus Thorius (Amphibia, Plethodontidae): II. The fate of the brain and sense organs and their role in skull morphogenesis and evolution. J Morphol. 1983;177:255–268. doi: 10.1002/jmor.1051770304. [DOI] [PubMed] [Google Scholar]
- Hanken J, Thorogood P. Evolution and development of the vertebrate skull: the role of patern formation. TREE. 1993;8:9–14. doi: 10.1016/0169-5347(93)90124-8. [DOI] [PubMed] [Google Scholar]
- Herring S. Sutures and craniosynostosis: a comparative, functional, and evolutionary perspective. In: Cohen M Jr, MacLean R, editors. Craniosynostosis. Oxford University; New York: 2000. pp. 1–10. [Google Scholar]
- Hunter A, Rudd N. Craniosynostosis. I. Sagittal synostosis: its genetics and associated clinical findings in 214 patients who lacked involvement of the coronal suture(s) Teratology. 1976;14:185–193. doi: 10.1002/tera.1420140209. [DOI] [PubMed] [Google Scholar]
- Jacobs R, Jordan M. Computational consequences of a bias toward short connections. J Cogn Neurosci. 1992;4:323–336. doi: 10.1162/jocn.1992.4.4.323. [DOI] [PubMed] [Google Scholar]
- Jiang X, Iseki S, Maxson RE, Sucov HM, Morriss-Kay GM. Tissue origins and interactions in the mammalian skull vault. Dev Biol. 2002;241:106–116. doi: 10.1006/dbio.2001.0487. [DOI] [PubMed] [Google Scholar]
- Klingenberg C. Developmental instability as a research tool: using patterns of fluctuating asymmetry to infer the developmental origins of morphological integration. In: Polak M, editor. Developmental instability: causes and consequences. Oxford University Press; New York: 2003. [Google Scholar]
- Klingenberg C, Badyaev A, Sowry S, Beckwith N. Inferring developmental modularity from morphological integration: analysis of individual variation and asymmetry in bumblebee wings. Am Nat. 2001;157:11–23. doi: 10.1086/317002. [DOI] [PubMed] [Google Scholar]
- Klingenberg C, Mebus K, Auffray J-C. Developmental integration in a complex morphological structure: how distinct are the modules in the mouse mandible? Evol Dev. 2003;5:522–531. doi: 10.1046/j.1525-142x.2003.03057.x. [DOI] [PubMed] [Google Scholar]
- Köntges G, Lumsden A. Rhombencephalic neural crest segmentation is preserved throughout craniofacial onto-geny. Development. 1996;122:3229–3242. doi: 10.1242/dev.122.10.3229. [DOI] [PubMed] [Google Scholar]
- Kopher RA, Mao JJ. Suture growth modulated by the oscillatory component of micromechanical strain. J Bone Miner Res. 2003;18:521–528. doi: 10.1359/jbmr.2003.18.3.521. [DOI] [PubMed] [Google Scholar]
- Kopher RA, Nudera JA, Wang X, O'Grady K, Mao JJ. Expression of in vivo mechanical strain upon different wave forms of exogenous forces in rabbit craniofacial sutures. Ann Biomed Eng. 2003;31:1125–1131. doi: 10.1114/1.1603259. [DOI] [PubMed] [Google Scholar]
- Lajeunie E, El Ghouzzi V, Le Merrer M, Munnich A, Bonaventure J, Renier D. Sex related expressivity of the phenotype in coronal craniosynostosis caused by the recurrent P250R FGFR3 mutation. J Med Genet. 1999;36:9–13. [PMC free article] [PubMed] [Google Scholar]
- Lajeunie E, Merrer ML, Bonaiti-Pellie C, Marchac D, Renier D. Genetic study of nonsyndromic coronal craniosynostosis. Am J Med Genet. 1995;55:500–504. doi: 10.1002/ajmg.1320550422. [DOI] [PubMed] [Google Scholar]
- Lajeunie E, Merrer ML, Bonaiti-Pellie C, Marchac D, Renier D. Genetic study of scaphocephaly. Am J Med Genet. 1996;62:282–285. doi: 10.1002/(SICI)1096-8628(19960329)62:3<282::AID-AJMG15>3.0.CO;2-G. [DOI] [PubMed] [Google Scholar]
- Leise EM. Modular construction of nervous systems: a basic principle of design for invertebrates and vertebrates. Brain Res Brain Res Rev. 1990;15:1–23. doi: 10.1016/0165-0173(90)90009-d. [DOI] [PubMed] [Google Scholar]
- Lele S, Cole TM., III A new test for shape differences when variance-covariance matrices are unequal. J Hum Evol. 1996;31:193–212. [Google Scholar]
- Lele S, Richtsmeier JT. An invariant approach to the statistical analysis of shapes. Chapman & Hall/CRC Press; London: 2001. [Google Scholar]
- Lieberman D, Krovitz G, McBratney-Owen B. Testing hypotheses about tinkering in the fossil record: the case of the human skull. J Exp Zool B. 2004;302:284–301. doi: 10.1002/jez.b.21004. [DOI] [PubMed] [Google Scholar]
- Magwene P. New tools for studying integration and modularity. Evolution. 2001;55:1734–1745. doi: 10.1111/j.0014-3820.2001.tb00823.x. [DOI] [PubMed] [Google Scholar]
- Mao JJ, Wang X, Kopher RA. Biomechanics of craniofacial sutures: orthopedic implications. Angle Orthod. 2003a;73:128–135. doi: 10.1043/0003-3219(2003)73<128:BOCSOI>2.0.CO;2. [DOI] [PubMed] [Google Scholar]
- Mao JJ, Wang X, Mooney MP, Kopher RA, Nudera JA. Strain induced osteogenesis of the craniofacial suture upon controlled delivery of low-frequency cyclic forces. Front Biosci. 2003b;8:a10–7. doi: 10.2741/917. [DOI] [PubMed] [Google Scholar]
- Martin GR. The roles of FGFs in the early development of vertebrate limbs. Genes Dev. 1998;12:1571–1586. doi: 10.1101/gad.12.11.1571. [DOI] [PubMed] [Google Scholar]
- Matsuoka T, Ahlberg P, Kessaris N, Iannarelli P, Dennehy U, Richardson W, McMahon A, Koentges G. Neural crest origins of the neck and shoulder. Nature. 2005;436:347–355. doi: 10.1038/nature03837. [DOI] [PMC free article] [PubMed] [Google Scholar]
- Merrer ML, Ledinot V, Renier D, Marchac D, Briard M. Genetic counseling in craniostenosis. Results of a prospective study performed with a group of studies on craniofacial malformations. J Genet Hum. 1988;36:295–306. [PubMed] [Google Scholar]
- Moloney D, Wall S, Ashworth G, Oldridge M, Glass I, Francomano C, Muenke M, Wilkie A. Prevalence of Pro250Arg mutation of fibroblast growth factor receptor 3 in coronal craniosynostosis. Lancet. 1997;349:1059–1062. doi: 10.1016/s0140-6736(96)09082-4. [DOI] [PubMed] [Google Scholar]
- Mooney MP, Losken HW, Siegel MI, Lalikos JF, Losken A, Burrows AM, Smith TD. Development of a strain of rabbits with congenital simple nonsyndromic coronal suture synostosis. Part II: Somatic and craniofacial growth patterns. Cleft Palate Craniofac J. 1994;31:8–16. doi: 10.1597/1545-1569_1994_031_0008_doasor_2.3.co_2. [DOI] [PubMed] [Google Scholar]
- Mooney M, Burrows A, Smith T, Losken H, Opperman L, Dechant J, Kreithen A, Kapucu R, Cooper G, Ogle R, Siegel M. Correction of coronal suture synostosis using suture and dura mater allografts in rabbits with familial craniosynostosis. Cleft Palate Craniofac J. 2001;38:206–225. doi: 10.1597/1545-1569_2001_038_0206_cocssu_2.0.co_2. [DOI] [PubMed] [Google Scholar]
- Morimoto K, Nishikuni K, Hirano S, Takemoto O, Futagi Y. Quantitative follow-up analysis by computed tomographic imaging in neonatal hydrocephalus. Pediatr Neurol. 2003;29:435–439. doi: 10.1016/s0887-8994(03)00401-6. [DOI] [PubMed] [Google Scholar]
- Morriss-Kay GM, Iseki S, Johnson D. Genetic control of the cell proliferation-differentiation balance in the developing skull vault: roles of fibroblast growth factor receptor signalling pathways. Novartis Found Symp. 2001;232:102–116. doi: 10.1002/0470846658.ch8. discussion 116-21. [DOI] [PubMed] [Google Scholar]
- Moss M. The functional matrix. In: Kraus B, Reidel R, editors. Vistas in orthodontics. Lea and Febiger; Philadelphia: 1962. pp. 85–98. [Google Scholar]
- Moss M. Functional cranial analysis and the functional matrix. Am Speech Hear Assoc Rep. 1971;6:5–18. [Google Scholar]
- Moss M, Young R. A functional approach to craniology. Am J Phys Anthropol. 1960;18:281–292. doi: 10.1002/ajpa.1330180406. [DOI] [PubMed] [Google Scholar]
- Olson E, Miller R. Morphological integration. University of Chicago; Chicago: 1958. [Google Scholar]
- Opperman LA. Cranial sutures as intramembranous bone growth sites. Dev Dyn. 2000;219:472–485. doi: 10.1002/1097-0177(2000)9999:9999<::AID-DVDY1073>3.0.CO;2-F. [DOI] [PubMed] [Google Scholar]
- Opperman LA, Passarelli R, Morgan E, Reintjes M, Ogle R. Cranial sutures require tissue interactions with dura mater to resist osseous obliteration in vitro. J Bone Miner Res. 1995;10:1978–1987. doi: 10.1002/jbmr.5650101218. [DOI] [PubMed] [Google Scholar]
- Opperman LA, Chhabra A, Nolen A, Bao Y, Ogle R. Dura mater maintains rat cranial sutures in vitro by regulating suture cell proliferation and collagen production. J Craniofac Genet Dev Biol. 1998;18:150–158. [PubMed] [Google Scholar]
- Opperman LA, Sweeney T, Redmon J, Persin J, Ogle R. Tissue interactions with underlying dura mater inhibit osseous obliteration of developing cranial sutures. Dev. Dyn. 1993;198:312–322. doi: 10.1002/aja.1001980408. [DOI] [PubMed] [Google Scholar]
- Radinsky LB. A new approach to mammalian cranial analysis, illustrated by examples of prosimian primates. J Morphol. 1968;124:167–180. doi: 10.1002/jmor.1051240204. [DOI] [PubMed] [Google Scholar]
- Redies C, Puelles L. Modularity in vertebrate brain development and evolution. Bioessays. 2001;23:1100–1111. doi: 10.1002/bies.10014. [DOI] [PubMed] [Google Scholar]
- Richtsmeier JT, Grausz HM, Morris GR, Marsh JL, Vannier MW. Growth of the cranial base in craniosynostosis. Cleft Palate Craniofac J. 1991;28:55–67. doi: 10.1597/1545-1569_1991_028_0055_gotcbi_2.3.co_2. [DOI] [PubMed] [Google Scholar]
- Richtsmeier JT, Paik CH, Elfert PC, Cole TM, III, Dahlman HR. Precision, repeatability, and validation of the localization of cranial landmarks using computed tomography scans. Cleft Palate Craniofac J. 1995;32:217–227. doi: 10.1597/1545-1569_1995_032_0217_pravot_2.3.co_2. [DOI] [PubMed] [Google Scholar]
- Richtsmeier JT, Leszl J, Hill C, Aldridge K, Aquino V, Reeves R. Development of skull dysmorphology in Ts65Dn segmentally trisomic mice; American Society of Human Genetics Annual meeting; 2002. p. 280. abstract. [Google Scholar]
- Richtsmeier JT, Leszl J, Hill C, Budd J, Reeves R. Developmental instability of the skull in aneuploidy; Ninth Congress of the European Society for Evolutionary Biology; 2003. abstract. [Google Scholar]
- Roth D, Bradley J, Levine J, McMullen H, McCarthy J, Longaker M. Studies in cranial suture biology. 2. Role of the dura in cranial suture fusion. Plast Reconstr Surg. 1996;97:693–699. doi: 10.1097/00006534-199604000-00001. [DOI] [PubMed] [Google Scholar]
- Schultz A. Age changes and variability in the skulls and teeth of the Central American monkeys Alouatta, Cebus, and Ateles. Proc Zool Soc (Lond) 1960;133:337–390. [Google Scholar]
- Sidor C. Simplification as a trend in synapsid cranial evolution. Evolution. 2001;55:1419–1442. doi: 10.1111/j.0014-3820.2001.tb00663.x. [DOI] [PubMed] [Google Scholar]
- Smith J, Genoways H, Jones J. Cranial and dental anomalies in three species of platyrrhine monkeys from Nicaragua. Folia Primatol. 1977;28:1–42. doi: 10.1159/000155796. [DOI] [PubMed] [Google Scholar]
- Sperber G. Craniofacial development. BC Decker; Lewiston, NY: 2000. [Google Scholar]
- Striedter G. Principles of brain evolution. Sinauer Associates; Sunderland, MA: 2005. [Google Scholar]
- True JR, Carroll SB. Gene co-option in physiological and morphological evolution. Annu Rev Cell Dev Biol. 2002;18:53–80. doi: 10.1146/annurev.cellbio.18.020402.140619. [DOI] [PubMed] [Google Scholar]
- van der Klaauw CJ. Cerebral skull and facial skull. Arch Neerl Zool. 1946;7:16–37. [Google Scholar]
- van der Klaauw CJ. Size and position of the functional components of the skull: a contribution to the knowledge of the architecture of the skull, based on data in the literature. Arch Neerl Zool. 1948–1952;9:1–159. [Google Scholar]
- Valeri CJ, Cole TM, III, Lele S, Richtsmeier JT. Capturing data from three-dimensional surfaces using fuzzy landmarks. Am J Phys Anthropol. 1998;107:113–124. doi: 10.1002/(SICI)1096-8644(199809)107:1<113::AID-AJPA9>3.0.CO;2-O. [DOI] [PubMed] [Google Scholar]
- VanValen L. The statistics of variation. In: Hallgrímsson B, Hall BK, editors. Variation: a central concept in biology. Elsevier, Academic Press; New York: 2005. pp. 29–48. [Google Scholar]
- Wagner G, Altenberg L. Complex adaptations and the evolution of evolvability. Evolution. 1996;50:967–976. doi: 10.1111/j.1558-5646.1996.tb02339.x. [DOI] [PubMed] [Google Scholar]
- Weber I, Ninkovic M, Janicke A, Utermann B, Witsch-Baumgartner M, Anderl H, Utermann G. Molecular analyisis of 74 patients with craniosynostosis. Eur J Hum Genet. 2001;9:179. P0409. [Google Scholar]
- Weiss KM. The phenogenetic logic of life. Nat Rev Genet. 2005;6:36–45. doi: 10.1038/nrg1502. [DOI] [PubMed] [Google Scholar]
- Wilkie AO, Morriss-Kay GM. Genetics of craniofacial development and malformation. Nat Rev Genet. 2001;2:458–468. doi: 10.1038/35076601. [DOI] [PubMed] [Google Scholar]
- Wilkins A. The evolution of developmental pathways. Sinaer Associates; Sunderland, MA: 2002. [Google Scholar]
- Winther R. Varieties of modules: kinds, levels, origins, and behaviors. J Exp Zool. 2001;291:116–129. doi: 10.1002/jez.1064. [DOI] [PubMed] [Google Scholar]
- Wolf JB, Frankino WA, Agrawal AF, Brodie ED, III, Moore AJ. Developmental interactions and the constituents of quantitative variation. Evol Int J Org Evol. 2001;55:232–245. doi: 10.1111/j.0014-3820.2001.tb01289.x. [DOI] [PubMed] [Google Scholar]
- Yu JC, Lucas JH, Fryberg K, Borke JL. Extrinsic tension results in FGF-2 release, membrane permeability change, and intracellular Ca++ increase in immature cranial sutures. J Craniofac Surg. 2001;12:391–398. doi: 10.1097/00001665-200107000-00018. [DOI] [PubMed] [Google Scholar]
- Zeiger J, Beaty T, Hetmanski J, Wang H, Scott A, Kasch L, Raymond G, Jabs E, VanderKolk C. Genetic and environmental risk factors for sagittal craniosynostosis. J Craniofac Surg. 2002;13:602–606. doi: 10.1097/00001665-200209000-00002. [DOI] [PubMed] [Google Scholar]
- Zhao Q, Behringer RR, de Crombrugghe B. Prenatal folic acid treatment suppresses acrania and meroanencephaly in mice mutant for the Cart1 homeobox gene. Nat Genet. 1996;13:275–283. doi: 10.1038/ng0796-275. [DOI] [PubMed] [Google Scholar]