
Figure 7.
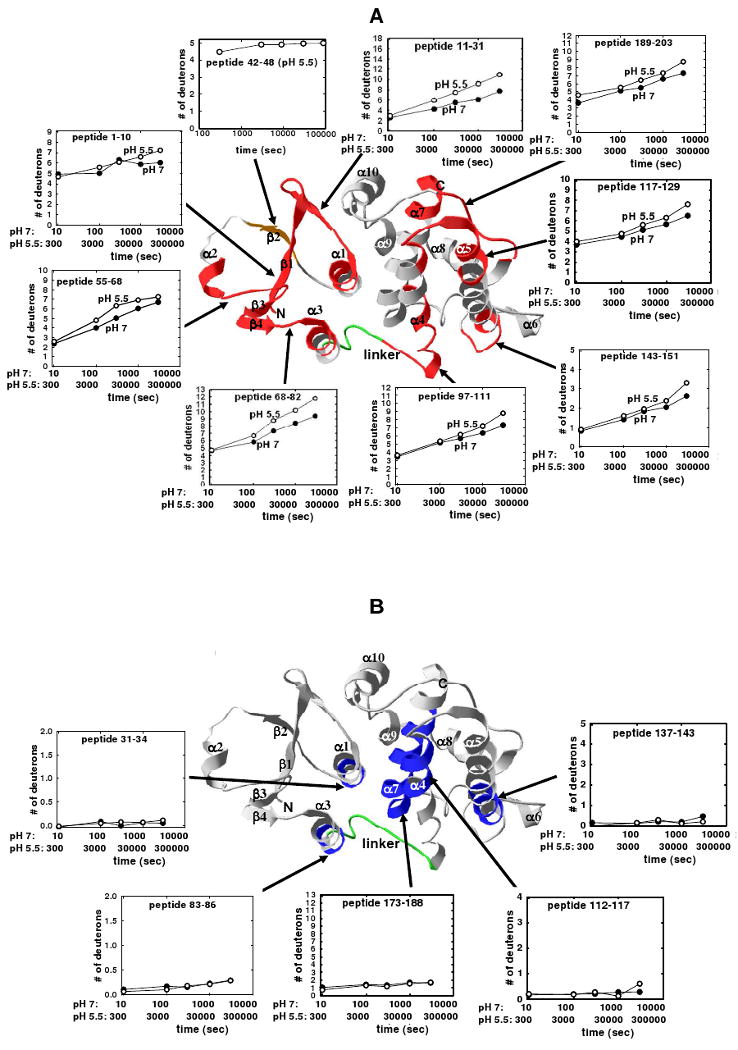
H/D exchange kinetics for CLIC1 segments mapped on the crystal structure of CLIC1 (PDB code 1k0m (11)). A. The red ribbons represent the eight regions for which the difference in deuteration at pH 7 and pH 5.5 at least at one time point was > 10% (see Figure 6), while the orange ribbon represents the exchange data for a peptide (residues 42-48), in the transmembrane region, that was only obtained at pH 5.5. B. The blue ribbons represent the five regions that display little or no deuterium incorporation at pH 7 and pH 5.5 (see Figure 5). α-Helices, β-strands, and the N- and C-termini are labeled. The linker region connecting the two domains is in green. The time axes for the H/D exchange kinetics at pH 7 and at pH 5.5 are shown and account for the 30-fold slower exchange rate at pH 5.5 (41). H/D exchange kinetics at pH 7 are in filled circles and the kinetics at pH 5.5 are in open circles.