Abstract
Commercially available polymer-based monolithic and perfusive stationary phases were evaluated for their applicability in chromatography of biologics. Information on bed geometry, including that from electron microscopy (EM), was used to interpret and predict accessible volumes, binding capacities, and pressure drops. For preparative purification of biologics up to at least 7 nm in diameter, monoliths and perfusive resins are inferior to conventional stationary phases due to their low binding capacities (20–30 g/L for BSA). For larger biologics, up to several hundred nanometers in diameter, calculations from EM images predict a potential increase in binding capacity to nearly 100 g/L. The accessible volume for adenovirus calculated from the EM images matched the experimental value. While the pores of perfusive resins are essentially inaccessible to adenovirus under binding conditions, under non-adsorbing conditions the accessible intrabead porosity is almost as large as the interbead porosity. Modeling of breakthrough curves showed that the experimentally observed slow approach to full saturation can be explained by the distribution of pore sizes.
Keywords: perfusion, monolith, protein, virus, SEM, TEM, binding capacity, permeability, porosity, pore size distribution, breakthrough curve
1. Introduction
Chromatography remains the most widely used separations technique for therapeutic proteins and it is increasingly being applied to purification of larger biologics, such as viruses and even whole cells [1–6]. New types of stationary phases, including perfusive resins [7–10], monoliths [11–17], and membranes [18–24], have been developed to improve chromatography of larger biologics by using convective transport to overcome the diffusive limitations in typical resin beads. However, understanding of specific structure-function relationships for convective media has been limited.
Knowledge of the geometric characteristics of the pore space, such as the pore size distribution (PSD), is useful in understanding and predicting chromatographic performance. The goal of this work was to relate the experimentally observed permeability, porosity and binding capacity for different solutes in convective media to the stationary-phase geometry. Three commercially available polymeric monoliths and a perfusive resin were compared using single-component pulse and step response experiments and pressure drop measurements. Breakthrough curves provide binding capacities, which determine column sizing and pool concentration. Pulse response analysis under non-binding conditions provides information on porosity, which was translated into a PSD. Pressure drop (ΔP) was considered because it often limits throughput in chromatography. It is particularly important at large scale, where equipment is typically rated for relatively low pressures. While the Kozeny-Carman equation predicts ΔP for packed beds, it is not directly applicable to monoliths. A method for normalizing the permeability by both porosity and pore diameter is presented here.
Various pore models relevant to understanding transport phenomena in porous media have been reviewed previously [25]. In view of the good agreement that has been observed between resin porosities determined from electron microscopy (EM) and chromatographic measurements [26], we used EM to study one of the monoliths in detail. The PSDs of chromatographic stationary phases are commonly found by either mercury intrusion porosimetry or inverse size exclusion chromatography, both of which require assumptions concerning the pore geometry [27–29]. EM has the advantage of exposing the details of the pore structure [26,30]. The trade-off is that EM is based on local regions instead of the whole sample, so while it is well suited for macroscopically homogeneous samples, many images from various regions of a sample are required if there are significant spatial variations in sample geometry. The monolith studied by EM in this work (CIM) was assumed to have a relatively homogeneous pore structure, and the analysis is based on a number of representative images. Although it is possible to use 3-D reconstructions of the stationary-phase pore structure [26], obtaining these reconstructions is a lengthy process that may not be practical for screening many potential stationary phases. In this work, only 2-D images were used under the assumption that the pore structure is comparable in the third dimension.
In a packed bed, the pore space consists of large interstitial pores and small intrabead pores. If the bead diameter is reduced sufficiently and the pore diameter is maximized, the effective pore size between the beads would be comparable to the intrabead pores and the packed bed should behave like a monolith in terms of having convective transport be significant throughout the bed. In an effort to study such a scenario, we chose a commercial resin with the largest pores and the smallest particle size: PL-SAX 4000 Å 10 μm (Polymer Labs/Varian). Although only anion-exchangers were studied here, the findings are based on geometry, so they are likely to extend to other chromatographic modes as well.
2. Materials and methods
2.1. Model solutes and solution conditions
The model solutes used for porosity measurements are listed in Table 1; BSA and ovalbumin were also used for binding capacity measurements. The background buffer was 20 mM HEPES, pH 7.8 throughout. Pulse experiments for porosity measurements were carried out under non-retentive conditions: 1.5 M NaCl in the buffer for Ad5 and 1 M NaCl for UMP and the proteins. These concentrations were sufficiently high to ensure that retention was not affected by the NaCl concentration. Breakthrough curves were obtained without added NaCl.
Table 1.
Model solutes and their characteristics. For the virus and the proteins, diameter was measured by DLS [1], for Na+ and Cl−, the given diameter is that of hydrated ions [2], and for UMP, the diameter was estimated from molecular structure.
| Probe | Manufacturer | Cat. # | Lot # | MW | Hydrodynamic diameter (nm) | pI |
|---|---|---|---|---|---|---|
| NaCl (Na+, Cl−) | Fisher | S271 | 067655 | (23, 35) | (0.72, 0.66) | n/a |
| uridine 5′-monophosphate (UMP) | Sigma | U6375 | 32H0433 | 324 | 1.3 | n/a |
| ovalbumin | Sigma | A5503 | 076K7045 | 44,300 | 6 | 4.6 |
| bovine serum albumin (BSA) | Sigma | A0281 | 075K7545 | 66,430 | 7 | 4.7 |
| human adenovirus serotype 5 (Ad5) | Baylor College of Medicine, Vector Development Lab | Ad5-CMV-eGFP | 102307, 030206 | 170,000,000 | 100 | 4.5 |
2.2. Stationary phases
A goal of this study was to compare monolithic and perfusive stationary phases. The characteristics of the stationary phases used in this study are given in Table 2. All three types of commercially available polymeric monoliths were evaluated, but silica-based monoliths were not studied because they are unstable at elevated pH. The two types of perfusive resins that are available (POROS and PL) are very similar, so only one was chosen (PL). The resin was packed into a 0.5 cm ID Waters AP-Minicolumn and the monoliths were supplied with their own housings.
Table 2.
Properties of the stationary phases used in this study.
| Stationary phase | Manufacturer | Lot # | Bed dimensions (cm) | Type | Base matrix | Functional group | |
|---|---|---|---|---|---|---|---|
| Diameter | Height | ||||||
| 4 DEAE CIM disks | BIA Separations | 05-GE01-012-001B | 1.2 | 1.2 | monolithic | poly-methacrylate | tertiary amine (DEAE) |
| ProSwift WAX-1S | Dionex | 006-06-012 | 0.46 | 4.4 | |||
| UNO Q-1 | Bio-Rad | Q1-4188 | 0.7 | 3.5 | poly-(acrylamide/vinyl) | quaternary amine (Q) | |
| PL-SAX 4000Å 10 μm | Varian/Polymer Labs | 10M-SAX40-199A | 0.5 | 4.8 | perfusive | PS-DVB | |
2.3. Equipment
An ÄKTA Explorer 100 liquid chromatography system (GE Healthcare) was used to run all pulse and step response experiments. The extra-column volume was minimized by reducing it to less than 5% of the column volume and no-column control runs were performed to account for the extra-column effects. A detection wavelength of 260 nm was used for Ad5 and UMP and 280 nm for the proteins. Loading to generate the breakthrough curves (BTCs) was performed using an LKB 2150 HPLC pump (LKB-Produkter AB, Bromma, Sweden). Data analysis was carried out in Matlab (MathWorks).
2.4. Pressure drop measurements
ΔP was measured using water at room temperature. To compare values from different columns, they were normalized by the bed dimensions, with permeability (K) defined as
| (1) |
where μ is the mobile phase viscosity, L is the bed height, and us is the superficial flow velocity.
2.5. Porosity measurements
Under non-adsorbing conditions, first moment data provide information on the bed volume accessible to the probe molecule, i.e., an apparent porosity, ε, defined as
| (2) |
where V0 is the elution volume for a non-adsorbing pulse, excluding the extra-column volume, and VT is the total bed volume. To find V0, a 30 μL pulse of a probe of interest was injected into a column and the elution time was measured. Because of the skewed nature of most peaks that were obtained, the peaks were analyzed using the method of moments [31]. Flow rates in the range 0.2–10 cm/min were tested to check if the peak elution volume was affected by the flow rate. No significant change in elution volume with flow rate was observed, so the elution volume data from different flow rates were simply averaged. Probe concentrations in the pulse were 3.5 × 10¹¹ p/mL (0.1 g/L) for Ad5, 2.5 g/L for proteins, and 0.25 g/L for UMP. For NaCl spikes, the background contained 0.15 M NaCl and the pulse contained 1 M NaCl.
2.6. Step-response measurements
Breakthrough curves (BTC) were obtained only for proteins (BSA and ovalbumin) because the virus was too expensive to be used to saturate a full bed, even though the column volume was on the order of only 1 mL. A column was first equilibrated with 20 mM HEPES buffer, pH 7.8, at the target flow rate. The protein solution of interest in the same buffer was then fed at a concentration of 2.5 g/L. After the run was completed, bound protein was eluted using 2 M NaCl and the column was cleaned with 0.5 M NaOH. Different flow rates were tested in random order. The dynamic binding capacity was found from the BTC and corrected for extra-column effects.
2.7. Electron microscopy
2.7.1. Sample preparation and imaging
Chemicals used for fixation, staining and imaging were from Electron Microscopy Sciences. About 1–2 mm thick pieces of a DEAE CIM monolith (BIA Separations) were allowed to equilibrate overnight (12–14 hrs) in a 5 g/L solution of α-lactalbumin (Sigma) in 20 mM phosphate, pH 7.6. The samples were chemically fixed using 1% paraformaldehyde, 1% glutaraldehyde, and subsequently 2% osmium tetroxide solutions. Following dehydration with acetone, the samples were infiltrated with Embed 812 resin kit mixture, poured into molds and cured in an oven at 65°C for 3 days. Approximately 65 nm thick serial sections were obtained from the hardened capsules using a Reichert-Jung Ultracut E microtome. Serial sections were collected with a loop and placed on a drop of distilled water glass coverslip, air-dried and post-stained with Reynolds’s lead citrate and 2% uranyl acetate solutions.
Transmission electron microscopy (TEM) imaging was performed on a Zeiss CEM 902 TEM operating at a voltage of 80 kV. For scanning electron microscopy (SEM), samples were immobilized on aluminum stubs and the periphery of the coverslip with sections was covered with silver paint to enhance conductivity. The samples were then carbon coated on a Denton Bench Top Turbo III coater. Backscattered electron SEM imaging was performed on a Hitachi S4700 FESEM with an accelerating voltage of 3.0 kV and an emission current of 40uA.
2.7.2. Image analysis
Grayscale EM images were binarized using Adobe Photoshop with a fixed threshold value, and the noise in the resulting images was filtered out. Matlab version 7.1 (MathWorks) with the Image Processing Toolbox was used to execute algorithms for estimating porosity and binding capacity. The porosity was found from binarized images by applying basic operations of mathematical morphology [32]. Briefly, a circular probe (structuring element) of a chosen diameter is used for an erosion operation followed by dilation on a binarized image. This sequence eliminates all parts of the pore space that are inaccessible to that particular probe, thus returning only the pore space accessible to probes that are of the selected probe size or smaller [30]. Implementation of this procedure for a range of probe sizes yields the inverse cumulative distribution (porosity as a function of probe size) and, in turn, the corresponding differential PSD.
To estimate the binding capacity for a certain probe size from the 2D images, an algorithm was implemented to find the maximum number of probes (disks) that can be placed or “adsorbed” onto the accessible solid boundaries without overlapping with each other or with the solid matrix. This placement was performed in two different ways. In the first, a close-packed placement algorithm, probes were positioned as close to each other as possible, thus resulting in tight formations. In the second approach, random placement was assumed, with probes placed randomly on unoccupied parts of the pore periphery, which results in a lower packing density of particles on the surface; this algorithm is analogous to random sequential adsorption [33–35].
After the probe placement was complete, the number of probes placed was converted into binding capacity by assuming that the image represents a three-dimensional slab with a thickness equal to that of the probe diameter, so square packing is assumed in the direction normal to the plane of the two-dimensional EM images. The probes were approximated as spheres. Calculating the mass of the probes and dividing it by the volume of the slab gives an estimate for the binding capacity. Similar methods to estimate equilibrium binding capacity from surface area have been described previously for flat interfaces [36], particulate adsorbents [37,38], and monoliths [39]. The binding capacity predictions made here can be customized for a particular biologic simply by multiplying them by its specific gravity. The density of cells is approximately 1.0–1.1 g/mL [40,41]; densities of proteins and viruses are in the range 1.2–1.5 g/mL [42–44].
3. Results and discussion
3.1. Porosities and pore size distributions
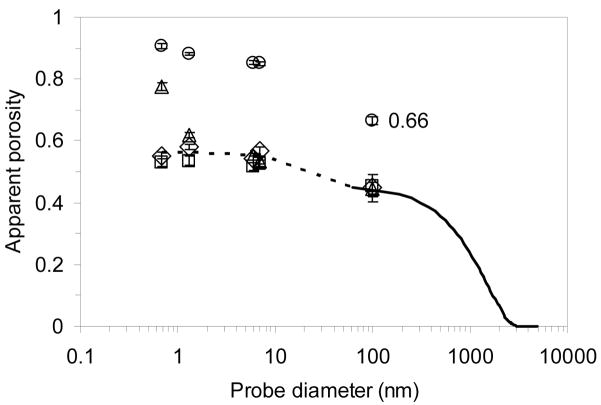
For packed columns, a distinction is normally made between the interstitial and the intraparticle porosity. Since this distinction does not apply to monoliths, a single measure is used for all the stationary phases studied here. The apparent porosities of the four stationary phases are shown in Figure 1. As expected, ε either stays constant or decreases with increasing probe size, but it does not change significantly with flow rate. For the monoliths, ε is around 0.5, which is consistent with reports that it is 15% greater than the interstitial porosity in beds packed with spherical resin beads (εi) [14], which is approximately 0.35–0.42 [29,45]. The apparent porosity of the perfusive resin is substantially higher than that of the monoliths. That ε of PL-SAX for Ad5 (0.66) is considerably greater than εi indicates that the virus enters the pores of the resin under non-interacting conditions. It was previously found, however, that under binding conditions the virus does not enter the pores of the resin significantly, which supports the hypothesis that bound virus particles prevent other virus particles from entering the pores, resulting in lower binding capacities for Ad5 [46].
Figure 1.
Experimental ε as a function of bioparticle diameter for CIM (◇), ProSwift (□), Uno Q (△), and PL-SAX (○); ε for CIM calculated from SEM images (––––). The range for the curve calculated from the SEM images is limited by resolution of the images, so it was extended (- - - -) using the chromatographic ε data. Two extension points were added: one is an average of the small molecule data and the other is an average of the protein data for this stationary phase. The experimental ε values shown are averages of the ε values at different flow rates. Error bars represent one standard deviation (n=7). The data label on one of the data points emphasizes that the virus is able to penetrate into the pore space of the perfusive resin under non-interacting conditions.
The earlier study was carried out using batch uptake, so it is conceivable that the flow in a column would help virus particles enter the pores. This seems unlikely because only a small fraction of the flow actually passes through the resin beads [47–49]. If such flow-assisted pore entry is possible at all, it would be more likely to occur at relatively high ionic strength, where the virus binding is weaker, but we did not test this possibility experimentally because of the prohibitive cost of a breakthrough experiment using the virus.
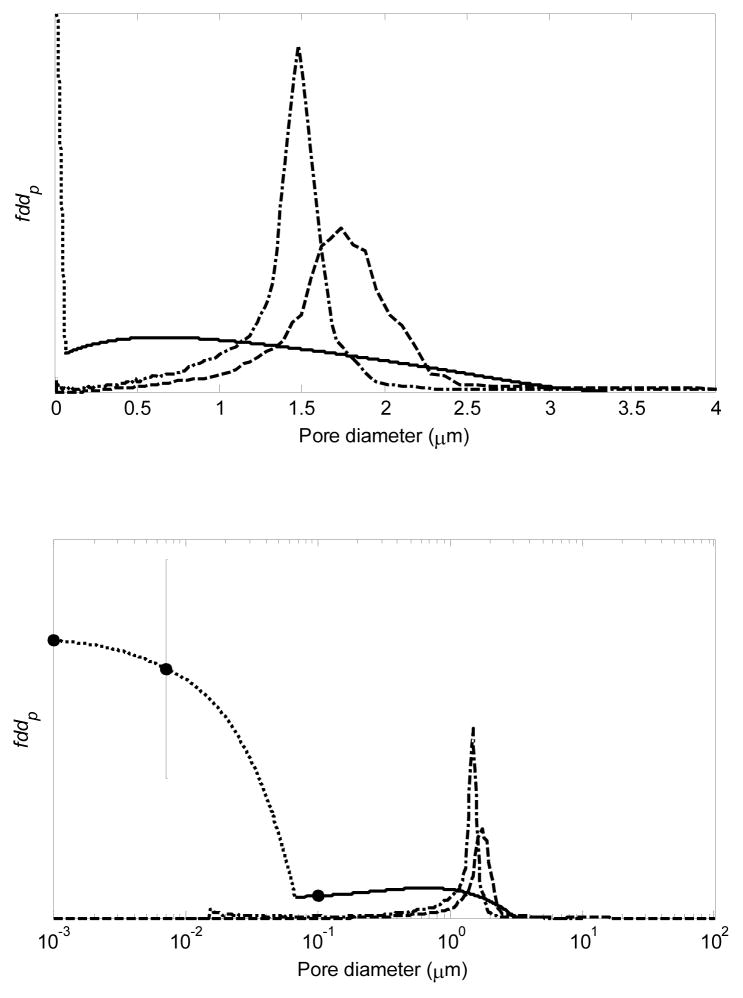
The range of experimental data in Figure 1 is limited by the largest probe that was used (Ad5). For bioparticles larger than Ad5, ε can be estimated from SEM images of thin slices of the monolith. This estimate for CIM is shown as the continuous curve in Figure 1. As an example, Figure 2 shows one of the SEM images used to generate the data and the binarized form of the image, and Figure 3 shows an example of the ε calculation for an arbitrary probe diameter. The data in Figure 1 can be converted to a PSD, shown in Figure 4, using
Figure 2.
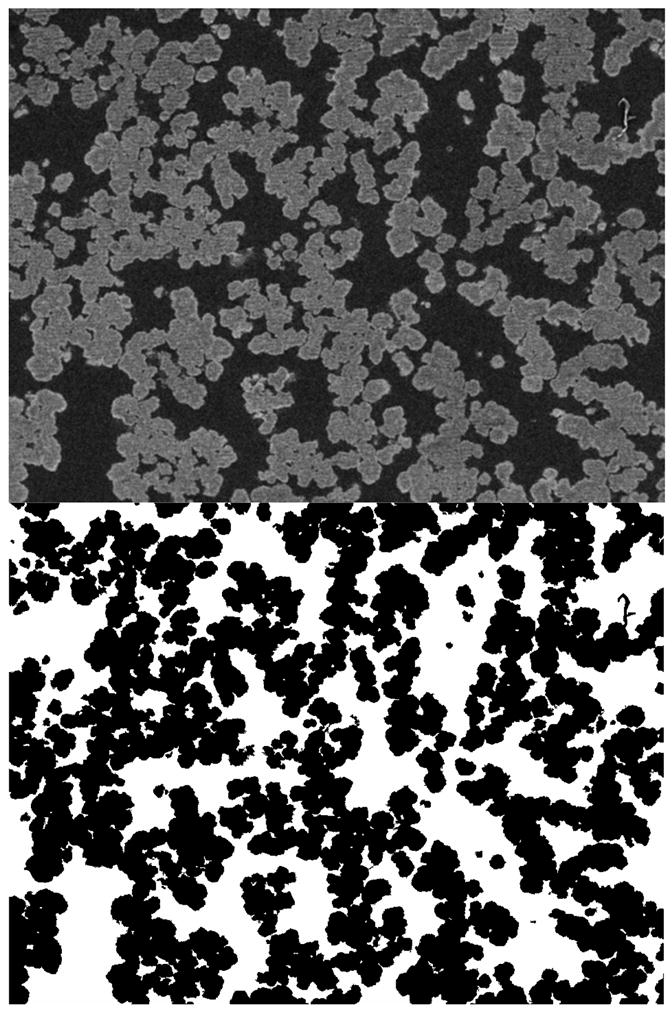
SEM image of CIM disk (top) and binarized form of the image (bottom). In the original image, the lighter areas are the solid polymer matrix and the darker areas are the pore space. In the binarized image, the black areas are the solid matrix and the white areas are the pore space. Dimensions: 32 μm × 26 μm.
Figure 3.
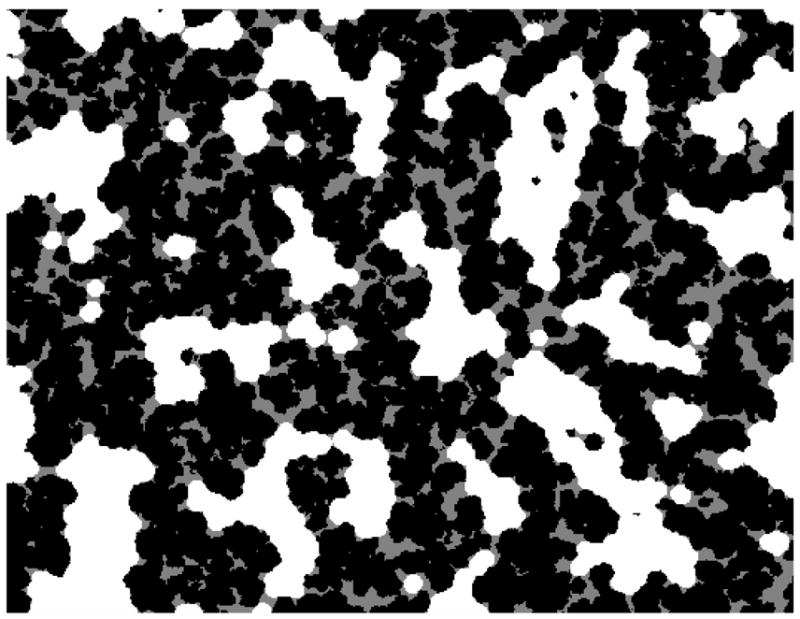
Example of an ε calculation using the binarized SEM image from Figure 2. Black areas are the solid polymer matrix, white areas are the accessible pore space for an arbitrary probe diameter of 0.66 μm, and grey areas are inaccessible to this probe size. Same image dimensions as in Figure 2 (32 × 26 μm).
Figure 4.
PSD for CIM from SEM data (––––) extended using linear interpolation with the non-binding pulse data (· · · · · · · ·) for bioparticles of different size (●); PSD for CIM from MIP (– · – · –) [15]; PSD for ProSwift from MIP (– – –) (manufacturers’ data). Data in top and bottom plots are the same, but the abscissa in the bottom plot is logarithmic to emphasize the smaller pores. The error bar on the protein data represents 90% confidence interval. Although the small-molecule data point (10−3 μm) is not statistically different from zero, it is included for completeness.
| (3) |
where F is the fraction of the pore volume accessible to the bioparticle of interest, da is the analyte diameter, εmax is the maximum observed ε, which occurs at the smallest da, f is the differential PSD (f [=] m−1), and dp is the pore diameter. In Figure 4, the ratio of the area under a PSD curve between any two values of dp to the total area under the curve corresponds to the fraction of the pore space contributed by pores in that diameter range. Various methods of quantifying porosity and PSD are described elsewhere [50]. The PSDs from mercury intrusion porosimetry (MIP) in Figure 4 are manufacturers’ data, and the corresponding pore diameter statistics are given in Table 3.
Table 3.
Summary of pore diameter data in Figure 4. Mean square pore diameter, , is used here for breakthrough curve modeling and to relate permeability to pore geometry.
| Monolith | Method | Pore diameter (μm) | ||||
|---|---|---|---|---|---|---|
| Mean | Median | Mode | ||||
| CIM | ε (Figure 1) | 1.06 | 0.96 | 0.001 | 1.75 | |
| CIM | MIP | 1.48 | 1.46 | 1.48 | 2.52 | |
| ProSwift | MIP | 2.37 | 1.77 | 1.74 | 11.5 | |
The PSD from MIP in Figure 4 is much narrower than the PSD from the ε data. The ε data show that CIM pores with diameters less than about 60 nm make up roughly 8% of the total pore volume in this monolith, whereas the MIP data suggest that this fraction is less than 0.5%, although a small spike in volume fraction at small pore diameters can also be seen on the MIP data. As discussed in the following section, the PSD from the ε data predicts the binding capacity for the model proteins much better than the PSD from MIP. Significant differences between the PSDs from MIP and other methods have been observed previously [51–53]. The discrepancy could be due to inaccessibility of some of the pores by mercury, compressibility of the polymer matrix during intrusion, narrow pore constrictions, and differences in sample preparation [27,28]. The PSD from the SEM porosity data is based on a small part of the monolith and might not accurately represent the whole monolith if the pore structure is not homogeneous. If the PSD from SEM were based on three-dimensional data, the distribution may have been narrower to some extent because pore constrictions in the third dimension are likely to be closer to the average pore size. Additionally, processing of SEM images involves binarization (Figure 2), which could also lead to some error. Despite the significant differences between the CIM PSDs from SEM and MIP, however, the average pore diameters are reasonably comparable.
3.2. Breakthrough curves and binding capacity
3.2.1. Binding Capacity Predictions from Porosity and Electron Microscopy
The equilibrium binding capacity (qm) can be estimated from the PSD by making assumptions regarding the adsorbate packing on the surface and by calculating the accessible surface area per unit volume of stationary phase (A). If the ratio of surface area to volume for a pore is taken as the limiting value of 4/dp for a cylindrical pore, then
| (4) |
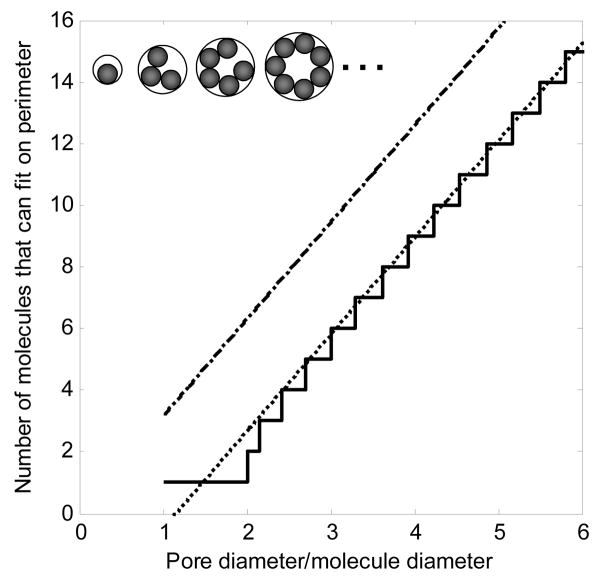
The total surface area (for a point probe) per unit volume is then simply , where the bar indicates the average value. For particles of finite size, however, not only are smaller pores (dp < da) inaccessible, but adsorbed bioparticles in a concave pore can also sterically hinder adsorption of others (inset schematic in Figure 5). One way to account for the resulting reduction in accessible area is to calculate the surface area accessible to the probe centers [29,54], but an alternative method is presented here. The staircase-like function plotted in Figure 5 is the number of bioparticles (filled circles in the schematic) that can fit along the wall of a pore (larger circles in the schematic). Geometric considerations show that, for a ratio γ of pore diameter to adsorbate diameter (γ= dp/da), the number of particles n that can bind on the perimeter is given for γ ≥ 2 by
Figure 5.
Calculating maximum binding capacity using the cylindrical pore approximation. Pore perimeter/molecule diameter (– · – · –), maximum number of molecules that can fit on the perimeter (–––––). The inset schematic shows a cross-section of a cylindrical pore with bound molecules. The least squares line fit (· · · · · · · ·, perimeter/adsorbate diameter − 3.64) is the asymptote that the fit approaches as the range of pore diameters increases.
| (5) |
where n is rounded down to a positive integer. For 1 ≤ γ < 2, n is 1, and for γ < 1, n is 0. Since using a discrete piecewise function is inconvenient and we are only estimating the binding capacity, n in Equation 5 can be approximated by a least squares linear fit to Equation 5 as
| (6) |
for γ > 3.64/π and 0 otherwise. Applying the correction to Equation 4 gives
| (7) |
Calculating the area accessible to the probe centers yields a very similar correction [29], namely −1/γ, which is very close to the −3.64/(πγ) correction used here. The difference results from placing the adsorbate molecules on the perimeter of a circle with diameter dp − da rather than on that of a polygon with a side length da inscribed in the circle with diameter dp − da.
If bioparticles are approximated as spheres with a density ρ that each occupy an area when bound, qm can be estimated from Equation 7 as
| (8) |
For pores that are much larger than the adsorbing molecules, the correction (negative term in Equations 5–8) is negligible. Although pore surfaces are equally likely to be concave or convex, the correction is necessary for small γ because for a bioparticle fitting in a particular region of pore space, the net surface curvature is inward: Figure 3 shows that smaller pore cross-sections tend to lose the “islands” in the middle and become more circular. Also, for equal volume fractions, smaller pores contribute more to the surface area and, consequently, binding capacity, so the correction for net inward surface curvature may not be negligible.
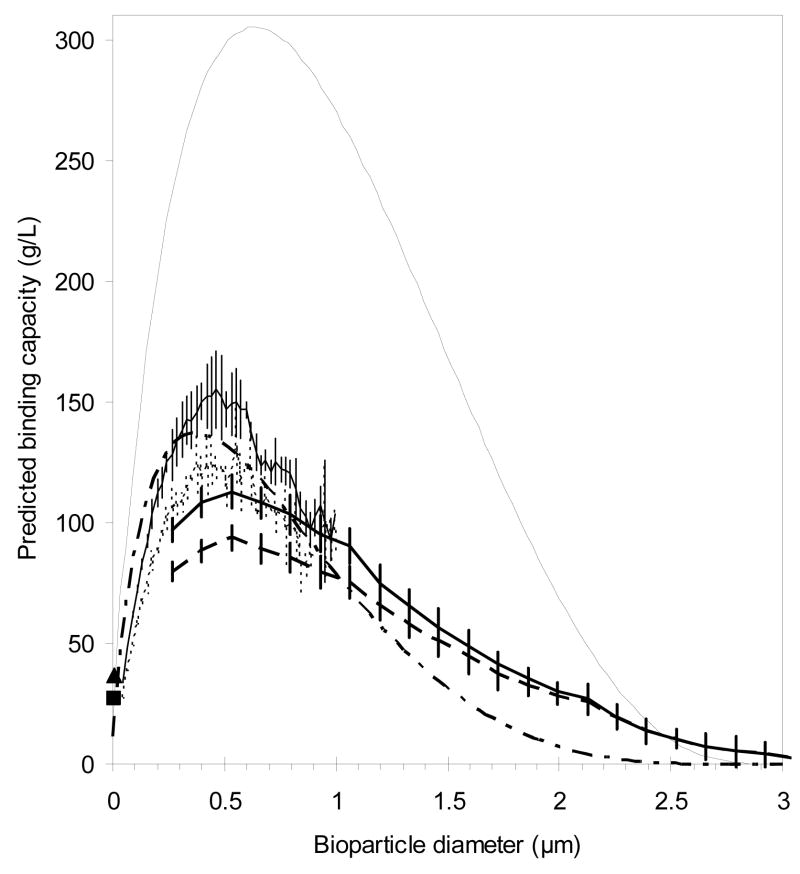
Further evidence for the importance of this correction comes from estimating the binding capacity from EM images such as the one in Figure 2. An example of binding capacity prediction for an arbitrary bioparticle size is shown in Figure 6. The close-packed placement algorithm necessarily predicts binding capacities that are the same as or higher than those based on assuming random placement. Figure 7 overlays the binding capacity predictions from EM for a range of probe sizes. As expected, the predicted binding capacity goes through a maximum, which occurs for an adsorbate of diameter around 0.5 μm, so the binding capacity is predicted to increase with virus size. For Ad5 (0.1 μm), the predicted binding capacity is about 50 g/L (1.8 × 10¹⁴ p/mL), which is greater by factors of 4 and 20 than the equilibrium binding capacities observed on PL-SAX 4000 Å 30 μm and Q Sepharose XL, respectively [46]. However, for larger bioparticles, dynamic binding capacity could be significantly lower than the values predicted in Figure 7 because, as discussed in Section 3.1, bound bioparticles can obstruct some pores, thus lowering the attainable binding capacity. Figure 7 also shows qm predictions from Equation 8 with and without the correction for net inward curvature of pore surface (negative term in the integral of Equation 8).
Figure 6.
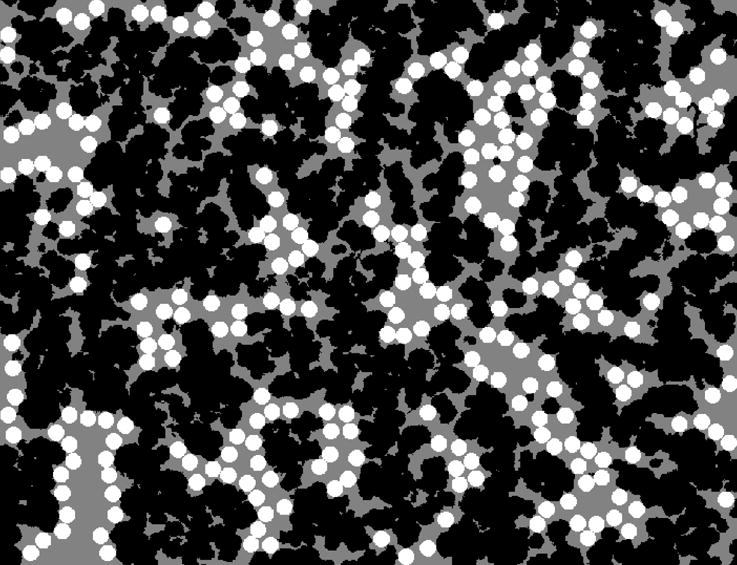
An example of binding capacity prediction from the random placement algorithm using the binarized SEM image in Figure 2. The black areas are the solid polymer matrix, grey areas are the pore space, and the white disks are the probes with the same arbitrary diameter as in Figure 3 (0.66 μm). Same image dimensions as in Figures 2 and 3 (32 × 26 μm).
Figure 7.
Binding capacity estimates from the PSD: Equation 8 without correction for net inward surface curvature (–· · – · · –) and with the correction ( ). Binding capacity estimates from EM images like that in Figure 6: SEM: random packing (
 ) and close packing (
 ); TEM: random packing (· · · · · · · ·) and close packing (–––––). Experimental DBC for BSA at us of 0.8 cm/min on CIM at 5% b.t. (■) and 95% b.t. (▲). Error bars represent one standard deviation; n=10 for SEM predictions; n=2 for TEM predictions; n=2 for experimental data (error bars are smaller than the symbols). Specific gravity of adsorbate is set to be 1, so the predictions can be multiplied by the specific gravity of a biologic of interest to obtain the customized prediction.
The SEM data in Figure 7 are likely to be more accurate than the TEM data because the former are based on ten images whereas the latter are based on only two. Additionally, the SEM images capture a larger area, so they are expected to be more representative of the whole monolith. The advantage of TEM images is their higher resolution, which allows predictions for smaller probe sizes. The discrepancy in prediction for random and close-packed placement vanishes for larger probes because eventually only zero or one probe particle can fit per pore (in 2-D), so it does not matter if the placement is random or not. The predictions for the largest adsorbates are likely to be too high due to the presence of pore throats.
The prediction from Equation 8 without the correction for net inward curvature of pore surface is expected to be the least accurate of those in Figure 7 since it significantly exceeds all other predictions. With the correction, on the other hand, the prediction from Equation 8 is much more reasonable and is the prediction of choice because it covers the full range of probe sizes and requires only a PSD, not detailed images of pore structure. The large effect of the correction shows that most of the binding capacity is provided by pores that are not much bigger than adsorbate particles.
3.2.2. Binding capacity prediction for resins
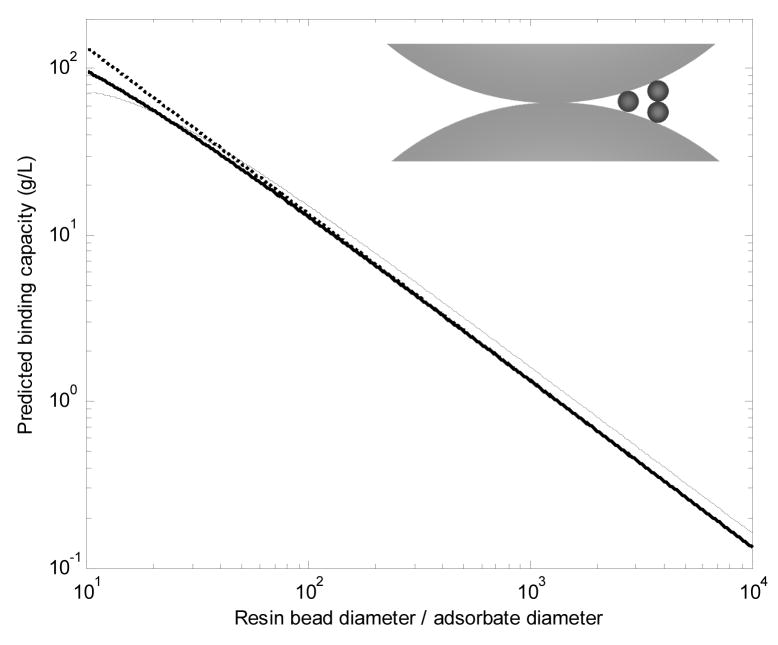
If the pores of a resin are narrower than the bioparticle of interest, qm can be estimated from the resin bead size by assuming monolayer binding on the external surface of spherical resin beads. Such predictions are useful for chromatography of viruses, plasmids or cells on conventional small-pore stationary phases. In some cases, this method can give the correct order of magnitude for qm even if the pores are several times wider than the bioparticle [46]. The maximum surface coverage (θ) can be estimated as 0.55, the jamming limit for random sequential adsorption on a flat surface [35]. The slight increase in capacity due to the surface curvature is negligible for the estimates here because the resin bead diameter generally exceeds the adsorbate diameter by at least an order of magnitude.
In units of mass of adsorbate per unit bed volume, qm is a function only of the ratio of the adsorbate diameter (da) to the resin bead diameter (dr). In grams/liter, qm is
| (9) |
where εi is the interstitial porosity between resin beads, which is typically around 0.35–0.42 for packed beds [29,45]. In units of adsorbate particles per unit of bed volume, qm is
| (10) |
Equations 9 and 10 assume that the resin beads are incompressible spheres of uniform size and that contacts between resin beads do not significantly reduce the surface area available for binding. The schematic in the inset of Figure 8 shows that bioparticles (small spheres) are excluded from areas directly adjacent to the contact area between resin beads (large spheres). To account for the exclusion, the surface area beyond which a bioparticle of a given size cannot fit was subtracted from the total surface area in a packed bed and the area where the touching resin particles cannot both have a bioparticle bound at the same location was divided by two. The average number of contacts for a resin bead is 6 in a randomly packed bed [45] and 12 in a hypothetical close-packed bed, for which . Figure 8 shows that the effect of contacts between resin beads is negligible, except for the smallest dr/da ratios, and the packing arrangement of resin beads does not appear to make a large difference in qm either.
Figure 8.
Single-component binding capacity predictions on spherical, non-porous, incompressible resin beads, taking into account the limited accessibility of the contacts between resin beads. The inset shows an example of a contact area between resin beads with an arbitrary resin-to-adsorbate diameter ratio of 27. Three column packing formats are considered: randomly packed resin (––––), close-packed resin (– – –), and expanded bed (· · · · ·, Equation 9). Bioparticle density was set to 1 g/mL, so the prediction can be multiplied by the specific gravity of the bioparticle of interest to get a more accurate prediction.
On agarose-based and other compressible resins, the reduction in binding capacity on the external surface due to contacts among resin beads is expected to be greater. Poor accessibility of proteins in contact areas between resin beads has been reported previously [55,56]. For the expanded bed case, resin beads were assumed not to be in contact with one another, but the volume was based on the randomly packed case, so the increase in volume due to fluidization of the bed (typically 2–3×) was not included in the calculation. Equations 9 and 10 or Figure 8 can be used to estimate the maximum monolayer binding capacity for any bioparticle on any resin as long as the resin is either non-porous or its pores are smaller than the bioparticle. Additionally, Figure 8 shows that the binding capacity can be quite high even if the intrabead pores are not accessible.
3.2.3. Experimental Breakthrough Curves and Binding Capacities
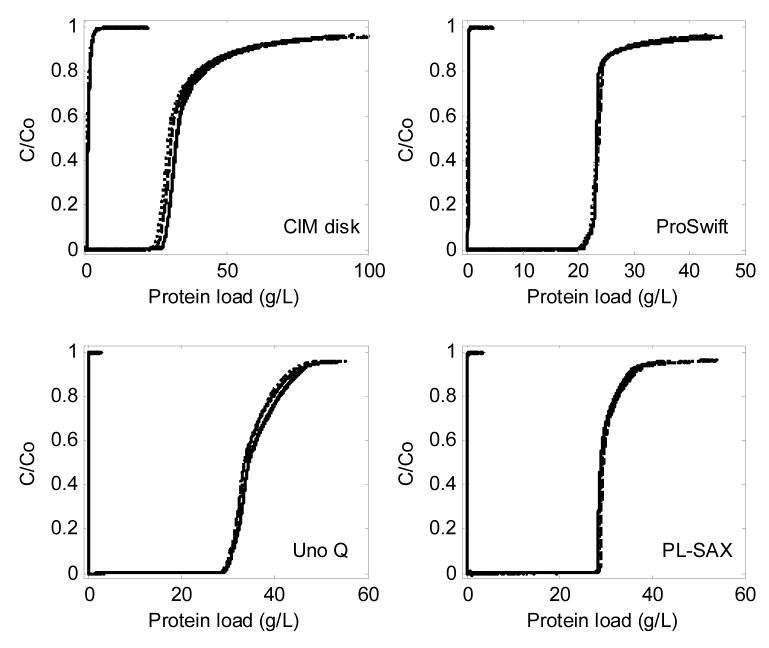
Experimental equilibrium binding capacities for Ad5 on resins were previously found to be roughly comparable to the predicted values from Equations 9 and 10 [46]. BTCs for BSA on the monolithic and perfusive stationary phases are shown in Figure 9, and correspond to DBCs of only 20–30 g/L, which is several fold lower than typical DBCs for proteins on conventional resins. The curves did not shift significantly with increasing flow rate, except for a small shift on the CIM disk, which was eliminated when another disk was added. While the DBC is known to be fairly independent of flow rate on perfusive resins [10,47,57] and monoliths [12,58–60], the very gradual approach to full saturation has not been explained mechanistically. Yang and Etzel modeled this phenomenon using an empirical adsorption rate constant that decreased with increasing coverage [61]. The following section explores mechanisms that may determine the shape of the BTCs and provides a possible mechanistic explanation for the very gradual approach to full saturation.
Figure 9.
BSA breakthrough curves on the four stationary phases, along with no-column controls. The three different flow rates, slowest (–––), intermediate (– – –), and fastest (· · · · · · · ·), are: 0.8, 2.4, 4.1 cm/min for CIM; 2.8, 5.6, 8.3 cm/min for ProSwift; 2.4, 4.8, 9.6 cm/min for Uno Q; 2.3, 4.7, 9.4 cm/min for PL-SAX. The linear flow rates differ somewhat between the stationary phases because this practice reduced the number of necessary control runs and the maximum volumetric flow rate was also limited by the loading pump. Mobile phase: 20 mM HEPES, pH 7.8. C0 = 2.5 g/L BSA.
Table 4 summarizes the DBC results from Figure 9 for 1%, 5%, 10% and 95% breakthrough (b.t.). The DBC for BSA on the CIM disk agrees well with a previously reported value [62]. Table 5 gives the DBC data for ovalbumin, including those on Q Sepharose XL, a typical narrow-pore resin, which demonstrates that narrow-pore resins are much better for preparative purification of medium-sized proteins than the convective media. The closest estimate for qm in convective media is the DBC at the lowest us and highest percent b.t. Integrating the area under BTC up to a given b.t. point shows that loading the columns up to 10% b.t. resulted in loss of < 1% in all cases.
Table 4.
DBC and yield results for BSA breakthrough curves in Figure 9.
| Stationary phase | us (cm/min) | DBC (g/L) @ % b.t. | Loss @ % b.t. | ||||||
|---|---|---|---|---|---|---|---|---|---|
| 1% | 5% | 10% | 95% | 1% | 5% | 10% | 95% | ||
| CIM disk | 0.8 | 26 | 27 | 28 | 37 | 0.1% | 0.2% | 0.4% | 54% |
| 2.4 | 24 | 25 | 26 | 35 | 0.1% | 0.3% | 0.5% | 55% | |
| 4.1 | 23 | 24 | 25 | 35 | 0.2% | 0.3% | 0.5% | 59% | |
| ProSwift | 2.8 | 21 | 22 | 22 | 24 | 0.1% | 0.3% | 0.5% | 40% |
| 5.6 | 21 | 22 | 22 | 25 | 0.2% | 0.2% | 0.5% | 36% | |
| 8.3 | 20 | 21 | 22 | 24 | 0.2% | 0.3% | 0.6% | 34% | |
| Uno Q | 2.4 | 29 | 30 | 31 | 36 | 0.2% | 0.2% | 0.3% | 25% |
| 4.8 | 29 | 30 | 30 | 35 | 0.1% | 0.2% | 0.3% | 28% | |
| 9.6 | 29 | 30 | 31 | 35 | 0.2% | 0.3% | 0.5% | 24% | |
| PL-SAX | 2.3 | 28 | 28 | 28 | 30 | 0.2% | 0.2% | 0.2% | 23% |
| 4.7 | 29 | 29 | 29 | 31 | 0.2% | 0.2% | 0.2% | 21% | |
| 9.4 | 28 | 28 | 28 | 31 | 0.2% | 0.2% | 0.2% | 26% | |
Table 5.
DBC and yield results for ovalbumin. Maximum breakthrough to which the run was taken (max % b.t.) was not held constant in this case, it varied among the runs as indicated.
| Stationary phase | us (cm/min) | DBC (g/L) @ % b.t. | Max % b.t. | Loss @ % b.t. | ||||||
|---|---|---|---|---|---|---|---|---|---|---|
| 1% | 5% | 10% | max | 1% | 5% | 10% | max | |||
| CIM disk | 0.8 | 14 | 15 | 16 | 25 | 92% | 0.1% | 0.3% | 0.6% | 55% |
| 2.4 | 13 | 14 | 15 | 26 | 93% | 0.1% | 0.3% | 0.7% | 61% | |
| 4.1 | 13 | 15 | 15 | 28 | 93% | 0.1% | 0.4% | 0.7% | 64% | |
| ProSwift | 2.8 | 11 | 12 | 13 | 16 | 93% | 0.1% | 0.2% | 0.5% | 50% |
| 5.6 | 11 | 12 | 13 | 17 | 96% | 0.1% | 0.3% | 0.6% | 68% | |
| 8.3 | 12 | 13 | 13 | 19 | 95% | 0.0% | 0.2% | 0.5% | 71% | |
| Uno Q | 2.4 | 21 | 21 | 22 | 27 | 91% | 0.1% | 0.2% | 0.3% | 33% |
| 4.8 | 22 | 23 | 23 | 28 | 90% | 0.1% | 0.2% | 0.3% | 33% | |
| 9.6 | 21 | 22 | 22 | 27 | 92% | 0.1% | 0.1% | 0.3% | 34% | |
| PL-SAX | 2.3 | 17 | 18 | 18 | 19 | 91% | 0.1% | 0.1% | 0.1% | 15% |
| 4.7 | 17 | 17 | 18 | 20 | 92% | 0.1% | 0.1% | 0.1% | 39% | |
| 9.4 | 16 | 16 | 16 | 18 | 90% | 0.3% | 0.3% | 0.3% | 37% | |
| Q Seph. XL | 2.5 | 172 | 187 | 195 | 255 | 58% | 0.1% | 0.3% | 0.6% | 14% |
| 5.1 | 154 | 169 | 178 | 227 | 59% | 0.1% | 0.3% | 0.7% | 13% | |
| 10.2 | 137 | 152 | 160 | 206 | 60% | 0.2% | 0.4% | 0.8% | 14% | |
E.I. Trilisky, A.M. Lenhoff, J Chromatogr A 1142 (2007) 2.
E.R. Nightingale, Journal of Physical Chemistry 63 (1959) 1381.
Using the PSD from ε data, Equation 8 predicts that CIM’s capacity for both BSA and ovalbumin should be around 20 g/L, which is close to the experimental DBCs in Tables 4 and 5. The PSDs from the MIP data, on the other hand, predict a 4 g/L capacity on CIM and 3 g/L on ProSwift – approaching an order of magnitude less than the experimentally observed values. The much better predictions for the binding capacity of the model proteins provided by the PSD from SEM and the experimental ε data suggest that the PSD from MIP may be inaccurate in describing at least the smaller pores in the monoliths.
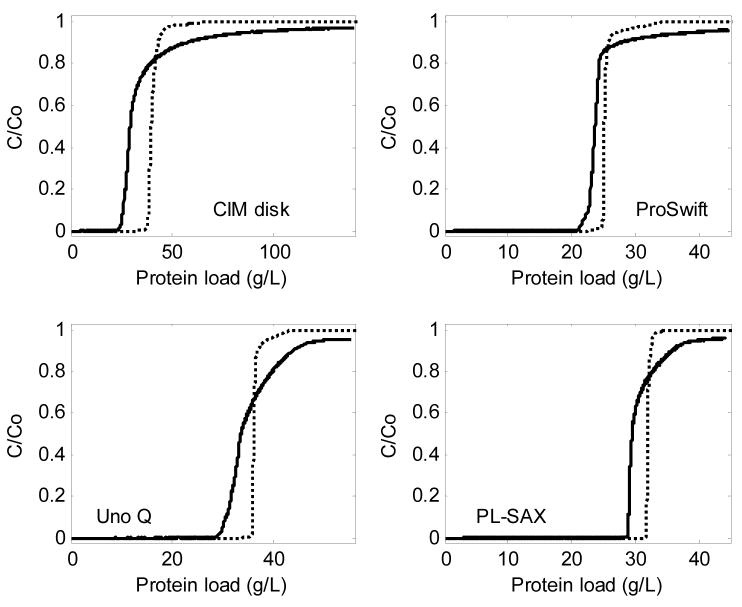
It is of interest to determine what physical phenomena dictate the shape of the BTCs in Figure 9. We first compare the BTCs under adsorbing conditions to those that would be expected for non-adsorbing BTCs. The non-adsorbing BTCs were obtained by integrating peaks from non-adsorbing pulse injections, which were performed at the same flow rate and with the same feed BSA concentrations (C0) of 2.5 g/L, but with 1 M NaCl in the background to screen electrostatic interactions between BSA and the ion-exchangers. In order to compare BTCs under adsorbing and non-adsorbing conditions, they were plotted on the same graph such that the points of breakthrough were at the same value of protein load q (grams of protein loaded per unit bed volume). To convert the abscissa for a non-adsorbing BTC (qna) to the adsorbing scale (qa), the difference between the maximum binding capacity (qm) and the mass of protein loaded during one average residence time (tR) per column volume (CV) was added to qna:
| (11) |
where Ac is the cross-sectional area of the bed. In other words, the non-adsorbing BTC was simply shifted to the right to align with the adsorbing BTC at equal amounts of protein loaded. Figure 10 shows the overlay of the BTCs from adsorbing and non-adsorbing data. Since there was no significant dependence on flow rate in either case, only one intermediate flow rate is shown for simplicity. As expected, dispersion is greater under adsorbing conditions. The following section addresses this difference using a conceptual model of column breakthrough.
Figure 10.
Comparison of BTCs under adsorbing conditions (solid lines) to those expected from non-adsorbing conditions data (dotted lines, calculated using Equation 11); us ≈ 4 cm/min, but the result is essentially independent of flow rate.
3.2.4. Modeling Breakthrough Curves
A step input of a macromolecular solute results in a BTC as the solute flows through the bed and saturates it. The flow is effectively one-dimensional and we assume that the PSD is macroscopically uniform throughout the column. Entrance and exit effects can be neglected because the bed height exceeds the pore diameter by 3 orders of magnitude. The Reynolds number for experiments here is 10−5 – 10−2 (creeping flow) so the flow patterns are not expected to vary with flow rate. Tables 4 and 5 show that roughly 10–40% of qm remains unused if loading is stopped at 10% b.t. due to tailing of the BTC. The discussion below suggests a possible reason for this behavior despite the relative invariance of the DBC with flow rate in convective media.
If time-dependent processes, such as binding kinetics or diffusion, were responsible for the BTC non-ideality, the BTC would be expected to shift or broaden with increasing flow rate, as is generally the case for protein chromatography on narrow-pore resins. Figure 9, however, shows that the BTCs on convective media do not change significantly with changing flow rate, as has also been demonstrated previously [12,59]. Non-adsorbing pulse-response peaks did not change significantly with increasing flow rate either [63]. In addition, the residence time exceeds the characteristic time for diffusion to the pore surface by at least 3 orders of magnitude, and dispersion due to axial diffusion or convective dispersion in individual channels is negligible [63]. Such order-of-magnitude analysis indicates that diffusion from the bulk liquid in pores to the surface can be assumed to be fast and axial dispersion within individual channels is negligible.
We hypothesize that the observed dispersion results primarily from convective dispersion due to velocity differences in pores of different diameters, the imperfect connectivity among those pores, and the faster saturation of wider pores because of their smaller surface area per unit volume. Furthermore, pore diameters are effectively reduced as bioparticles adsorb, which slows the flow in the smaller pores, thus further broadening the distribution of residence times.
The DBC can be calculated using averages over the PSD, written in terms of the pore diameter, dp. Using the PSD, we define two different averaging functions as
| (12) |
In Equation 12, g is averaged respectively either over all pores or only over pores that are accessible to an adsorbate of diameter da. The axial flow velocity averaged over all pores is
| (13) |
and the velocity in a given pore is related to the average velocity by
| (14) |
while the average velocity in pores that can fit the bioparticle is
| (15) |
Here, we assume that the solute macromolecules in a pore move at the average mobile phase velocity in that pore; although this neglects solute exclusion from the wall, it still allows the principal effect of the PSD to be captured. Since F ≤ 1 and , 〈u〉≥ū, so a size exclusion effect that causes larger bioparticles to elute before smaller ones is expected to occur to some extent even if diffusional limitations and exclusion of solute particles from the wall are negligible. For example, for Ad5 in CIM 〈u〉/ū ≈ 1.18 and for BSA in CIM, 〈u〉/ū ≈ 1.02, so Ad5 would be expected to elute ahead of BSA under non-interacting conditions. Indeed, we found experimentally that the first moment for elution of Ad5 under non-binding conditions was 22% ± 5% (one standard deviation) lower than that of BSA.
The mean residence time for a bioparticle, 〈tR〉, is
| (16) |
Since lateral diffusion is fast, the solute elution profile from an individual pore is approximated as being rectangular, and the actual experimental elution profile results from the PSD and pore connectivity. There are two limiting cases of pore arrangement and connectivity: 1) pores of different diameters are not connected at all (parallel-pore model) and 2) pores of different diameters are perfectly connected such that all bioparticles exiting the column have the same residence time (pores-in-series model). Pores in convective media are likely to be well connected, but not perfectly, so we can expect the behavior of a real monolith to lie somewhere between the two limits.
In the absence of diffusional limitations, the pores-in-series model predicts a perfectly rectangular step for a BTC, whereas the parallel-pore model is more informative and is examined in more detail here. We start with the simpler case of a non-adsorbing solute. The average time for pores to start contributing to breakthrough is the mean residence time (Equation 16). The residence time for a pore of a particular diameter dp that is greater than the diameter of the bioparticle of interest can be written as
| (17) |
The dimensionless breakthrough time for the non-adsorbing case (τna) is then
| (18) |
As expected, breakthrough is predicted to occur earlier for wider pores ( ) because flow is faster there.
Assuming that the solute particles are distributed by volumetric flow rate, the contribution of pores with a given diameter dp is the fraction of the bioparticles entering the column that exits through those pores. Integrating these contributions gives C/C0 in terms of dp:
| (19) |
where each value of dp corresponds to a certain time τna from Equation 18; combining Equations 18 and 19 would give the BTC in terms of time τna, but it is simpler to keep τna and C/C0 parameterized in terms of dp.
For the more complex case of an adsorbing solute, the time necessary to saturate a pore of a particular diameter, ts, is given by the ratio of pore capacity to mass flow into the pore:
| (20) |
where the proportionality constant is the same as for the principal dependence of the binding capacity:
| (21) |
(cf. Equation 8). Note that ts under adsorbing conditions is analogous to tR under non-adsorbing conditions: ts is the residence time for those bioparticles that exit the column under adsorbing conditions (only those bioparticles that do not bind). The characteristic time for breakthrough under adsorbing conditions, 〈ts〉, is
| (22) |
provided that C0 < qm. Substituting Equation 21 into 22 gives
| (23) |
Using Equations 14, 18, 20, and 23, the dimensionless breakthrough time for an adsorbing step (τa) is
| (24) |
Breakthrough occurs much faster for larger pores ( ) because of the coupling of the faster flow (larger supply of adsorbate) and the smaller surface area for binding per unit volume. Once saturated, pores contribute to breakthrough according to Equation 19, which holds for both the adsorbing and the non-adsorbing cases. The abscissa in the non-adsorbing case is given by Equation 18 and in the adsorbing case by Equation 24.
In real monoliths, pores of different widths are obviously connected to each other, and although quantifying the connectivity would be difficult, a real arrangement of pores will be bounded by the two limiting cases described above. The parallel-pore case is quantified by Equations 19 and 24, while the pores-in-series case is trivial: a step in C/C0 from 0 to 1 at τ = 1. Intermediate (real) situations can be modeled empirically by redefining τ in Equations 18 and 24 more generally as
| (25) |
and
| (26) |
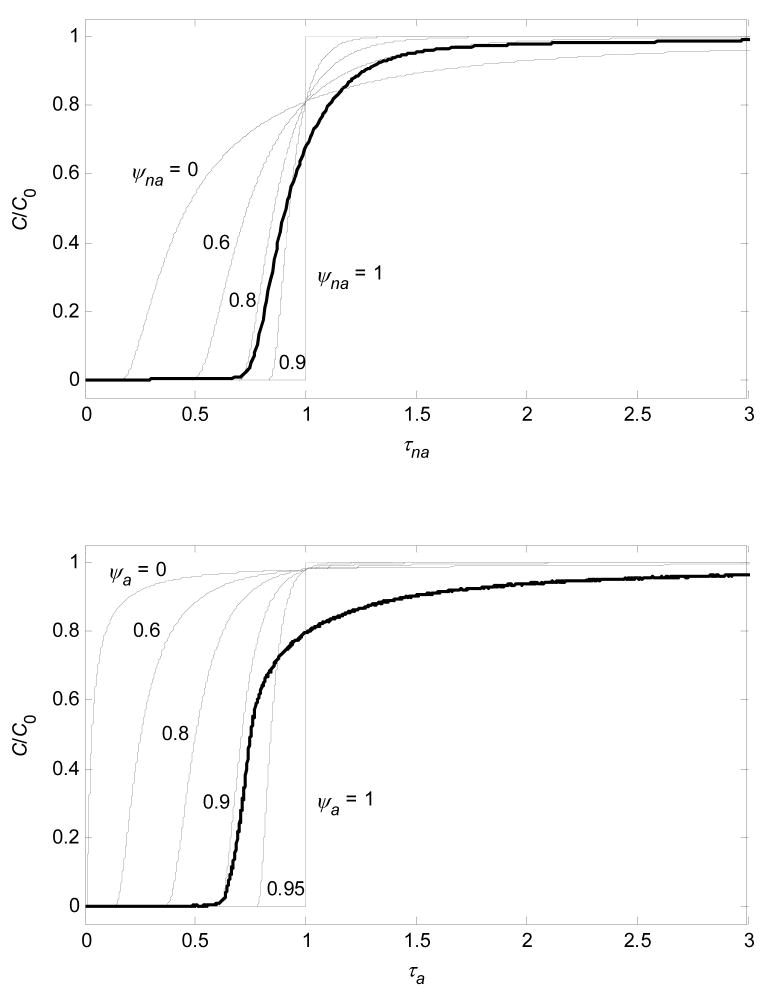
where ψ is an empirical parameter that reflects how well pores of different diameters are connected: ψ = 0 is the completely disconnected limit (parallel-pore model) and ψ = 1 is the pores-in-series limit. For real stationary phases, 0 < ψ< 1 because the pores are connected, but not perfectly. Equations 19, 25, and 26 relate the PSD to the distribution of residence times for those bioparticles that exit the column during loading, i.e., the BTC. Figure 11 compares the experimental data to the predictions for various values of ψ and suggests that the extent of experimentally observed dispersion can be plausibly related, at least to a significant extent, to the distribution of pore diameters and the pore connectivity, rather than to diffusional limitations. For practical purposes, the ψ value that corresponds to initial breakthrough is most appropriate to use because column loading is usually terminated in the C/C0 range 0.01–0.1 to avoid product loss.
Figure 11.
Predicted BTCs for BSA on CIM (- - - - -) under non-adsorbing and adsorbing conditions (upper and lower plots, respectively) for various values of ψ. In terms of initial breakthrough, which is of main importance, experimental data ( ) correspond approximately to ψ of 0.8 and 0.9 in non-adsorbing and adsorbing cases, respectively.
One practical utility of Equations 19, 25 and 26 for convective media is that non-adsorbing breakthrough or pulse data can be used to obtain a lower bound (worst case) for the adsorbing breakthrough:
| (27) |
because τ is more strongly dependent on dp in the adsorbing case. Non-adsorbing data require less material and are faster to obtain than the adsorbing BTCs, so Equation 27 could be used to estimate the worst-case scenario for the shape of experimental BTCs on monoliths. This application of Equation 27 requires knowledge of qm, which can be estimated from the PSD by Equation 8. For the specific example examined here, Figure 11 shows that ψna ≈ 0.8 and ψa ≈ 0.9, which is much closer to 1 than to 0, so pores of different diameters appear well connected in CIM if the model provides a reasonable representation of the physical system. A slow approach to C/C0 = 1 can, in general, also involve other effects, such as ones related to adsorption kinetics [18], that are not examined here because there was no significant dependence of experimental breakthrough profiles on flow rate for the stationary phases studied here.
3.3. Pressure Drop
Figure 12 shows that, over the range of flow rates studied, ΔP increased linearly with flow rate for all four stationary phases. To get an idea of the effect of the perfusive nature of the resin on ΔP, the bed was assumed to have pores with a bimodal diameter distribution: intrabead pores and interstitial pores. With εi in the range 0.35–0.42 [29,45], the porosity within resin beads (εw) can be estimated by subtracting εi from the ε for Ad5 in Figure 1 (0.66 − εi = 0.24–0.31) to account for pores large enough to contribute significantly to the permeability. The flow velocity through a pore is proportional to the square of the pore diameter. The effective interstitial pore diameter for packed beds is at least 15% of dr – the largest sphere that can pass between close-packed spheres – but may be closer to drεi. For the PL resin, with dr ≈ 11.5 μm [63], the corresponding contribution of the 0.4 μm intrabead pores to the permeability is less than 5%, which is consistent with previously published estimates for perfusive resins [47–49]. The Kozeny-Carman equation is very sensitive to εi (factor of 2.2 variation in K for εi of 0.35–0.42), so it cannot be used reliably to determine the effect of perfusive pores on ΔP without a very accurate εi.
Figure 12.
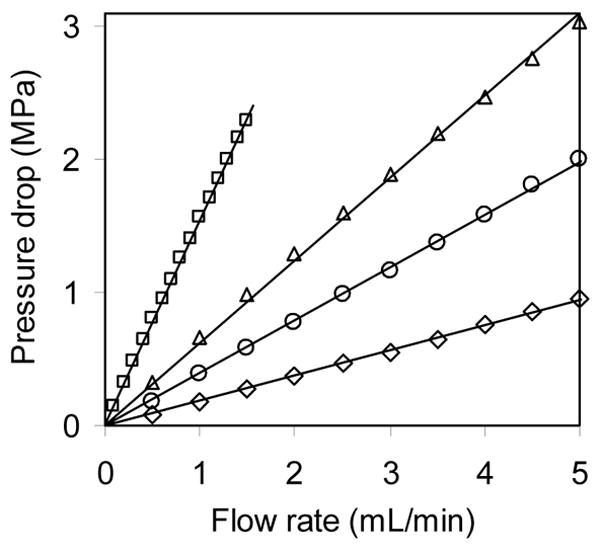
ΔP for flow of water through 3 CIM disks (◇), ProSwift (□), Uno Q (△), and PL-SAX (○) at room temperature. The corresponding permeabilities are 0.0063, 0.026, 0.022, and 0.093 μm2 and the corresponding equivalent bead diameters in the Kozeny-Carman equation are 3.1, 6.1, 5.7, and 11.8 μm, respectively. Extra-column pressure drop was subtracted from these data.
The Kozeny-Carman equation is applicable only to packed beds and not to monoliths. Previous studies have shown that accurate predictions of ΔP in monoliths are difficult and an empirical correction factor is required [64]. Since K is known to be proportional to the square of the pore diameter and to the corresponding porosity, it can be written using Equation 3 as
| (28) |
where Γ is a dimensionless proportionality constant that may vary for different stationary phases. Γ can be interpreted as the permeability normalized by both porosity and pore diameter. For CIM and ProSwift monoliths, Γ was calculated using the PSDs from Figure 4 and εmax values from Figure 1. This calculation was carried out only for the CIM and ProSwift monoliths because information on pore size was not available for Uno Q. For ProSwift, the manufacturer’s PSD gives Γ = 0.0042; for CIM, the manufacturer’s PSD gives Γ = 0.0045 and the PSD from SEM gives Γ = 0.0064. For reference, if the pores were straight and cylindrical, Poiseuille’s law states that Γ = 0.031 and for packed beds, it is estimated from the Kozeny-Carman equation that 0.015 < Γ < 0.031 (for intrabead pore diameter/bead diameter ratio between 0.15 and 0.35). These Γ values suggest that pore constrictions and/or tortuosity significantly reduce the permeability of the monoliths.
The porosity and permeability reported in the literature for CIM are 0.64 and 1.1 × 10⁻¹⁴ m2 respectively [64], whereas our data show a porosity of 0.56 and a permeability of 6.3 × 10⁻¹⁵ m2. Our method for finding porosity is different to that reported previously, but since the permeability is also lower, lot-to-lot variability is a possible explanation for the discrepancy. While the porosity and permeability measurements are usually made on a clean column, it is important to keep in mind that during actual preparative chromatography experiments, the porosity and permeability can be significantly lower. Also, during elution, the viscosity of the solution tends to increase, causing a concomitant increase in ΔP.
4. Conclusions
For preparative purification of small and medium-sized proteins, conventional resins are superior to both perfusive resins and monoliths because their binding capacities are higher by roughly a factor of five. Perfusive resins are expected to have high binding capacities for large proteins and small viruses. For medium-sized viruses and larger biologics, however, perfusive resins do not offer a significant advantage over conventional narrow-pore resins because, under loading conditions, the bound particles obstruct pores and prevent others from entering. For practical purposes, therefore, porosity depends not only on the probe size, but also on mobile phase conditions – it can be significantly lower for large biologics under binding conditions.
Based on EM images of CIM, high equilibrium binding capacity (50 g/L or more) is predicted on this monolith for viruses around 100 nm in diameter or larger. This prediction is supported by the close match between the experimental porosity for Ad5 and the predicted value. Also, the experimental binding capacity for BSA is comparable to the prediction from the PSD. For the binding capacity estimation (Equation 8), the net inward curvature of pore surfaces should not be neglected because the majority of the binding capacity is provided by pores that are not much wider than the bioparticle of interest.
Protein BTCs on the perfusive and monolithic stationary phases did not shift significantly with changing flow rate, but were extremely slow in their approach to full column saturation; this appears to be due to the distribution of pore diameters in the monolith, which translates to a distribution of residence times for bioparticles exiting the column. Using an average pore diameter is not adequate for modeling flow in these monoliths – the distribution of pore sizes needs to be taken into account. The BTC model that was developed to support that conclusion can also estimate the worst case for adsorbing BTCs using non-adsorbing pulse data. A PSD can also be used to estimate the order of magnitude of the permeability.
Acknowledgments
Financial support for this work was provided by the National Institutes of Health (NIH) grant R01 GM75047. We thank Ms. Shannon Modla at the Delaware Biotechnology Institute (DBI) for her invaluable help with electron microscopy. The Bioimaging facility at DBI is supported by NIH grants P20 RR16472 and P20 RR15588 from the INBRE and COBRE programs, respectively, of the National Center for Research Resources. We also thank Dionex and Bio-Rad Corporations for their generous gifts of monoliths.
Footnotes
Publisher's Disclaimer: This is a PDF file of an unedited manuscript that has been accepted for publication. As a service to our customers we are providing this early version of the manuscript. The manuscript will undergo copyediting, typesetting, and review of the resulting proof before it is published in its final citable form. Please note that during the production process errors may be discovered which could affect the content, and all legal disclaimers that apply to the journal pertain.
References
- 1.Arvidsson P, Plieva FM, Savina IN, Lozinsky VI, Fexby S, Bulow L, Galaev IY, Mattiasson B. J Chromatogr A. 2002;977:27. doi: 10.1016/s0021-9673(02)01114-7. [DOI] [PubMed] [Google Scholar]
- 2.Bresler SE, Katushkina NV, Kolikov VM, Potokin JL, Vinogradskaya GN. J Chromatogr A. 1977;130:275. doi: 10.1016/s0021-9673(00)89805-2. [DOI] [PubMed] [Google Scholar]
- 3.Davidoff AM, Ng CYC, Sleep S, Gray J, Azam S, Zhao Y, McIntosh JH, Karimipoor M, Nathwani AC. J of Virol Methods. 2004;121:209. doi: 10.1016/j.jviromet.2004.07.001. [DOI] [PubMed] [Google Scholar]
- 4.Pappas D, Wang K. Anal Chim Acta. 2007;601:26. doi: 10.1016/j.aca.2007.08.033. [DOI] [PubMed] [Google Scholar]
- 5.Sharma SK, Mahendroo PP. J Chromatogr. 1980;184:471. doi: 10.1016/s0021-9673(00)93875-5. [DOI] [PubMed] [Google Scholar]
- 6.Yamamoto S, Miyagawa E. J Chromatogr A. 1999;852:25. doi: 10.1016/s0021-9673(99)00594-4. [DOI] [PubMed] [Google Scholar]
- 7.Afeyan NB, Fulton SP, Gordon NF, Mazsaroff I, Varady L, Regnier FE. Nat Biotechnol. 1990;8:203. doi: 10.1016/0021-9673(90)85132-f. [DOI] [PubMed] [Google Scholar]
- 8.Frey DD, Schweinheim E, Horvath C. Biotechnol Prog. 1993;9:273. doi: 10.1021/bp00021a006. [DOI] [PubMed] [Google Scholar]
- 9.McCoy M, Kalghatgi K, Regnier FE, Afeyan N. J Chromatogr A. 1996;743:221. [Google Scholar]
- 10.Whitney D, McCoy M, Gordon N, Afeyan N. J Chromatogr A. 1998;807:165. doi: 10.1016/s0021-9673(98)00068-5. [DOI] [PubMed] [Google Scholar]
- 11.Gritti F, Guiochon G. J Chromatogr A. 2009;1216:4752. doi: 10.1016/j.chroma.2009.04.034. [DOI] [PubMed] [Google Scholar]
- 12.Iberer G, Hahn R, Jungbauer A. LCGC North Am. 1999;17:998. [Google Scholar]
- 13.Liao JL, Zhang R, Hjerten S. J Chromatogr. 1991;586:21. [Google Scholar]
- 14.Liu Y, Antonucci V, Shen Y, Vailaya A, Wu NJ. J Liq Chromatogr Relat Technol. 2005;28:341. [Google Scholar]
- 15.Švec F, Tennikova TB, Deyl Z. Monolithic materials: preparation, properties, and applications. Elsevier; Boston: 2003. [Google Scholar]
- 16.Urthaler J, Schlegl R, Podgornik A, Strancar A, Jungbauer A, Necina R. J Chromatogr A. 2005;1065:93. doi: 10.1016/j.chroma.2004.12.007. [DOI] [PubMed] [Google Scholar]
- 17.Zou HF, Huang XD, Ye ML, Luo QZ. J Chromatogr A. 2002;954:5. doi: 10.1016/s0021-9673(02)00072-9. [DOI] [PubMed] [Google Scholar]
- 18.Yang HW, Viera C, Fischer J, Etzel MR. Ind Eng Chem Res. 2002;41:1597. [Google Scholar]
- 19.Giovannini R, Freitag R, Tennikova TB. Anal Chem. 1998;70:3348. doi: 10.1021/ac980390w. [DOI] [PubMed] [Google Scholar]
- 20.Braas G, Searle PF, Slater NKH, Lyddiatt A. Biosep. 1996;6:211. [PubMed] [Google Scholar]
- 21.Roper DK, Lightfoot EN. J Chromatogr A. 1995;702:3. doi: 10.1016/0021-9673(93)83060-6. [DOI] [PubMed] [Google Scholar]
- 22.van Reis R, Zydney A. J Membrane Sci. 2007;297:16. [Google Scholar]
- 23.Boi C, Dimartino S, Sarti GC. J Chromatogr A. 2007;1162:24. doi: 10.1016/j.chroma.2007.02.008. [DOI] [PubMed] [Google Scholar]
- 24.Han BB, Specht R, Wickramasinghe SR, Carlson JO. J Chromatogr A. 2005;1092:114. doi: 10.1016/j.chroma.2005.06.089. [DOI] [PubMed] [Google Scholar]
- 25.van Brakel J. Powder Technol. 1975;11:205. [Google Scholar]
- 26.Yao Y, Czymmek KJ, Pazhianur R, Lenhoff AM. Langmuir. 2006;22:11148. doi: 10.1021/la0613225. [DOI] [PubMed] [Google Scholar]
- 27.Ishizaki K, Komarneni S, Nanko M. Porous materials: process technology and applications. Kluwer Academic Publishers; Boston: 1998. [Google Scholar]
- 28.Wong P-Z. Methods in the physics of porous media. Academic Press; London: 1999. [Google Scholar]
- 29.DePhillips P, Lenhoff AM. J Chromatogr A. 2000;883:39. doi: 10.1016/s0021-9673(00)00420-9. [DOI] [PubMed] [Google Scholar]
- 30.Vogel HJ, Roth K. Adv Water Res. 2001;24:233. [Google Scholar]
- 31.Jönsson JÅ. Chromatographic theory and basic principles. Dekker; New York: 1987. [Google Scholar]
- 32.Serra J. Image analysis and mathematical morphology. Academic Press; London; New York: 1982. [Google Scholar]
- 33.Adamczyk Z, Zembala M, Siwek B, Warszynski P. J Colloid Interf Sci. 1990;140:123. [Google Scholar]
- 34.Johnson CA, Yuan Y, Lenhoff AM. J Colloid Interf Sci. 2000;223:261. doi: 10.1006/jcis.1999.6680. [DOI] [PubMed] [Google Scholar]
- 35.Oberholzer MR, Stankovich JM, Carnie SL, Chan DYC, Lenhoff AM. J Colloid Interf Sci. 1997;194:138. doi: 10.1006/jcis.1997.5095. [DOI] [PubMed] [Google Scholar]
- 36.Guzman RZ, Carbonell RG, Kilpatrick PK. J Colloid Interf Sci. 1986;114:536. [Google Scholar]
- 37.Chang C, Lenhoff AM. J Chromatogr A. 1998;827:281. doi: 10.1016/s0021-9673(98)00796-1. [DOI] [PubMed] [Google Scholar]
- 38.Yao Y, Lenhoff AM. J Chromatogr A. 2006;1126:107. doi: 10.1016/j.chroma.2006.06.057. [DOI] [PubMed] [Google Scholar]
- 39.Etzel MR. In: Monolithic materials: preparation, properties, and applications. Švec F, Tennikova TB, Deyl Z, editors. 2003. p. 213. [Google Scholar]
- 40.Bratbak G, Dundas I. Appl Environ Microbiol. 1984;48:755. doi: 10.1128/aem.48.4.755-757.1984. [DOI] [PMC free article] [PubMed] [Google Scholar]
- 41.Häder DP, Richter P, Lebert M. Signal Transduction. 2006;6:422. [Google Scholar]
- 42.Burova E, Loffe E. Gene Ther. 2005;12:S5. doi: 10.1038/sj.gt.3302611. [DOI] [PubMed] [Google Scholar]
- 43.Elford WJ, Andrewes CH. Br J Exp Pathol. 1936;17:422. [PMC free article] [PubMed] [Google Scholar]
- 44.Fischer H, Polikarpov I, Craievich AF. Protein Sci. 2004;13:2825. doi: 10.1110/ps.04688204. [DOI] [PMC free article] [PubMed] [Google Scholar]
- 45.Matheson AJ. J Phys C Solid State. 1974;7:2569. [Google Scholar]
- 46.Trilisky EI, Lenhoff AM. J Chromatogr A. 2007;1142:2. doi: 10.1016/j.chroma.2006.12.094. [DOI] [PubMed] [Google Scholar]
- 47.Afeyan NB, Gordon NF, Mazsaroff I, Varady L, Fulton SP, Yang YB, Regnier FE. J Chromatogr. 1990;519:1. doi: 10.1016/0021-9673(90)85132-f. [DOI] [PubMed] [Google Scholar]
- 48.Carta G, Gregory ME, Kirwan DJ, Massaldi HA. Sep Technol. 1992;2:62. [Google Scholar]
- 49.Pfeiffer JF, Chen JC, Hsu JT. AIChE J. 1996;42:932. [Google Scholar]
- 50.Bear J. Dynamics of Fluids in Porous Media. Courier Dover Publications; 1988. [Google Scholar]
- 51.Courtois J, Szumski M, Georgsson F, Irgum K. Anal Chem. 2007:335. doi: 10.1021/ac0614902. [DOI] [PubMed] [Google Scholar]
- 52.Lubda D, Lindner W, Quaglia M, von Hohenesche CD, Unger KK. J Chromatogr A. 2005;1083:14. doi: 10.1016/j.chroma.2005.05.033. [DOI] [PubMed] [Google Scholar]
- 53.Urban J, Eeltink S, Jandera P, Schoenmakers PJ. J Chromatogr A. 2008;1182:161. doi: 10.1016/j.chroma.2008.01.006. [DOI] [PubMed] [Google Scholar]
- 54.Yao Y, Lenhoff AM. J Chromatogr A. 2004;1037:273. doi: 10.1016/j.chroma.2004.02.054. [DOI] [PubMed] [Google Scholar]
- 55.Dziennik SR, Belcher EB, Barker GA, Lenhoff AM. Biotechnol Bioeng. 2005;91:139. doi: 10.1002/bit.20503. [DOI] [PubMed] [Google Scholar]
- 56.Hubbuch J, Linden T, Knieps E, Thommes J, Kula MR. Biotechnol Bioeng. 2002;80:359. doi: 10.1002/bit.10500. [DOI] [PubMed] [Google Scholar]
- 57.Katoh S, Terashima M, Sada E, Utsumi H, Kamiya Y, Yamada K, Majima T. J Fermentation Bioeng. 1994;78:246. [Google Scholar]
- 58.Hahn R, Tscheliessnig A, Bauerhansl P, Jungbauer A. J Biochem Biophys Methods. 2007;70:87. doi: 10.1016/j.jbbm.2006.09.005. [DOI] [PubMed] [Google Scholar]
- 59.Plieva FM, Savina IN, Deraz S, Andersson J, Galaev IY, Mattiasson B. J Chromatogr B. 2004;807:129. doi: 10.1016/j.jchromb.2004.01.050. [DOI] [PubMed] [Google Scholar]
- 60.Wang MY, Xu J, Zhou X, Tan TW. Biochem Eng J. 2007;34:76. [Google Scholar]
- 61.Yang H, Etzel MR. Ind Eng Chem Res. 2003;42:890. [Google Scholar]
- 62.Mihelic I, Koloini T, Podgornik A, Strancar A. J High Resol Chromatogr. 2000;23:39. [Google Scholar]
- 63.Trilisky EI. PhD thesis. Dept Chem Eng, University of Delaware; 2009. Stationary and mobile phase selection for ion-exchange chromatography of viruses. [Google Scholar]
- 64.Mihelic I, Nemec DA, Podgornik A, Koloini T. J Chromatogr A. 2005;1065:59. doi: 10.1016/j.chroma.2004.10.054. [DOI] [PubMed] [Google Scholar]


