

Abstract
A recent study from our laboratory demonstrated that parietal cortex contains a map of visual space related to saccades and spatial attention and identified this area as the likely human homologue of the lateral intraparietal (LIP). A human homologue for the parietal reach region (PRR), thought to preferentially encode planned hand movements, has also been recently proposed. Both of these areas, originally identified in the macaque monkey, have been shown to encode space with eye-centered coordinates. Functional magnetic resonance imaging (fMRI) of humans was used to test the hypothesis that the putative human PRR contains a retinotopic map recruited by finger pointing but not saccades and to test more generally for differences in the visuospatial maps recruited by pointing and saccades. We identified multiple maps in both posterior parietal cortex and superior frontal cortex recruited for eye and hand movements, including maps not observed in previous mapping studies. Pointing and saccade maps were generally consistent within single subjects. We have developed new group analysis methods for phase-encoded data, which revealed subtle differences between pointing and saccades, including hemispheric asymmetries, but we did not find evidence of pointing-specific maps of visual space.
Introduction
Humans and other primates use their hands for many vital functions, including environmental exploration, resource gathering, and self-defense. While somatosensation is clearly important, vision is the dominant sense guiding goal-directed hand movements. Early visual areas in occipital cortex contain multiple, orderly maps of visual space that provide the information necessary for interactions with our surroundings. In order to reach or point to visual targets, information in these visual cortical areas, represented in retinocentric coordinates, must in some way be translated into motor plans consisting of well-timed muscle contractions using proprioceptive information about the location of the hand or arm (Crawford et al., 2004). How then, does the brain compute the coordinate transformations necessary for hand movements directed by visual stimuli?
One possibility is that there are maps of visual space dedicated to controlling hand movements that coordinate with other, more general maps controlling visual attention. Such a hand-specialized area could act as an interface between these other visual areas and hand-related motor areas and help perform the necessary coordinate transformations.
The parietal reach region (PRR) is thought to be involved in visually-directed hand movements, including reaching and pointing, while the lateral intraparietal area (LIP) is a member of a widespread network of cortical areas -- which includes the frontal eye fields (FEF) -- involved in both eye movements and the control of spatial attention (Corbetta et al., 1998; Colby and Goldberg, 1999; Nobre et al., 2000; Beauchamp et al., 2001). A fMRI study from our laboratory demonstrated the existence of a visuospatial map in the likely human homologue of the monkey lateral intraparietal area (LIP) (Sereno et al., 2001); more recent fMRI studies at higher field strength has revealed that at least two maps can be found in this region (Schluppeck et al., 2005; Silver et al., 2005). In monkeys, LIP and PRR both encode space with eye-centered coordinates, even though PRR is preferentially involved in hand movements (Batista et al., 1999). Thus it is plausible that PRR might also contain maps of visual space. Maps of space in hand-centered coordinates in other parietal areas, or even in motor or premotor cortex (Graziano et al., 1994; Shen and Alexander, 1997a, b), are also possible.
Two fMRI studies have identified an area in human medial parietal cortex active during finger pointing, but not eye movements, which may be homologous to the monkey PRR (Astafiev et al., 2003; Connolly et al., 2003). Another human fMRI study has suggested that PRR can instead be found in the medial bank of the intraparietal sulcus (Grefkes et al., 2004).
In this study, we have tested for the existence of spatial maps, in parietal cortex and elsewhere, that are recruited by finger pointing but not eye movements. In order to maintain identical visual stimulation across conditions, subjects’ pointing movements were not visible to themselves. Subjects were required to use visual stimuli to direct their motor planning, but continuous visual feedback of the hand movements was excluded.
Methods
Participants
A total of 32 adults participated in this study (15 women). The mean age was 23±5 years (ranging from 19 to 40). All subjects were right handed and had normal or corrected to normal vision. The experimental protocol was approved by the UCSD internal review board, and informed consent was obtained from each participant. There were two types of experimental designs used in this study, block design and phase-encoded. 22 subjects participated in the block design experiment and 13 participated in the phase-encoded experiment, with 11 subjects participating in both experiments. An additional 8 subjects participated in the occipital mapping experiments used to demonstrate our phase-encoded group analysis method.
Tracking Eye Movements
In separate tests outside the scanner, three subjects were tested with a video eye tracker (EyeLink system, SR Research Ltd., Mississauga, Ontario, Canada) while performing the delayed eye movement and pointing tasks described below. Subjects were able to maintain central fixation during the target presentation and delay periods of the eye movement task and during each trial period during the pointing task. Additionally, one subject was scanned with simultaneous optical eye tracking (Avotec Incorporated, Stuart, FL, USA) while performing the phase-encoded pointing task. The subject was able to adequately maintain fixation throughout each of two scans and the resulting parietal and superior frontal maps for this scan session were typical. Before all scanning sessions, all subjects practiced the pointing and saccade tasks to familiarize themselves with maintaining fixation and making responses at the appropriate trial period.
Functional Magnetic Resonance Imaging
A GE 3 Tesla scanner was used with an 8-channel head coil. An echo planar T2*-weighted gradient echo pulse sequence (8′32″ scan time, TR = 2000 ms for phase-encoded, 8′15″ scan time, TR = 2500 ms for block design, TE = 30 ms, flip angle = 90 degrees, bandwidth = 125 kHz, 64×64 matrix, 31–39 axial slices, 3.125×3.125×3.5 mm or 3.45×3.45×3.5 mm voxels) was used for functional scans. A T1-weighted FSPGR scan (TR = 10.5 ms, flip angle = 15 degrees, bandwidth = 20.83 kHz, 256×256 matrix, 143 axial slices, 1×1×1.3 mm voxels) was also acquired -- with the same slice offset as the EPI scans -- during each session to align the functional images to a previously obtained (1.5, 3, or 4 Tesla) high resolution (1×1×1 mm) T1-weighted MPRAGE scan. Subjects’ heads were immobilized with subject-specific dental impression bite-bars supported by a 4-ball-joint yoke. A custom image display program, run on a Shuttle PC running Red Hat Linux, was used to present target stimuli at ~8° eccentricity. Images were projected onto a screen over the head coil using a standard video projector with a 7.38–12.3″ focal length Xtra Bright Zoom lens (Buhl Optical, USA). Subjects viewed the screen indirectly via a front-silvered mirror above the eyes.
Deconvolution analysis
For block-design experiments, a 2 second text message before each 23 ± 3 second block indicated whether the task for the next block would require finger pointing, eye movements, or fixation. Volume-registered images were analyzed using AFNI’s (Analysis of Functional NeuroImages) 3dDeconvolve (Cox, 1996; Ward, 2000) after normalizing time series by mean intensity for each voxel. A quadratic polynomial was used to fit the baseline. Motion estimates from AFNI’s 3dvolreg were added to the baseline model to further reduce the contribution of motion to activation patterns. Correlation coefficients and F-statistics were generated for the area under the hemodynamic response function (HRF). No specific shape of the HRF was assumed and the amplitude of the HRF was allowed to freely vary at each of 6 time points for a total of 15 seconds.
Fourier analysis
Visual mapping data were analyzed using Fourier analysis, a method that has been used extensively to map early visual areas (Bandettini et al., 1993; DeYoe et al., 1994; Engel et al., 1994; Sereno et al., 1995; DeYoe et al., 1996; Engel et al., 1997). A Fourier transform of a time series generates a vector with real and imaginary components for each frequency that define the amplitude and phase of periodic signals at that frequency. For activity at the stimulus frequency, the phase of this vector corresponds to the polar angle of the stimulus location. To estimate the significance of correlation of BOLD signal with the stimulus frequency, the squared amplitude of the signal at the stimulus frequency was divided by the sum of squared amplitudes at all other “noise” frequencies (excluding low frequencies and harmonics of the stimulus frequency) (Sereno et al., 1995). This ratio of two chi-squared statistics follows the F-distribution (Larsen and Marx, 1986), and with degrees of freedom equal to the number of time points, this results in a statistical significance p-value. This analysis assumes that the signal at the non-stimulus frequencies is uncorrelated or independent. As the power spectrum of fMRI data typically includes a 1/frequency trend, this assumption is not, strictly speaking, accurate; however, motion correction significantly reduces the 1/frequency component (Zarahn et al., 1997). Furthermore, the power spectrum above the first three frequency components (which we excluded from our analysis) is relatively flat (Zarahn et al., 1997); thus the simplifying assumption of independence seems justified and should result in only slight inaccuracies in p-values calculated for single-subject data. For group analysis of phase-encoded data (see below), the raw Fourier components -- not the F-ratios -- were used, avoiding this problem. Before Fourier analysis, time series data were normalized by mean intensity for each voxel.
To increase SNR, multiple scans were averaged in the Fourier domain. 0.064 cycles of phase (~3 seconds) were subtracted from the data before averaging to offset the hemodynamic delay. The real and imaginary components were averaged across scans independently, computing a vector average for each frequency. If the phases for a particular frequency are random, the amplitude will tend to be reduced to zero. Thus, the ratio between stimulus and noise frequencies will be maximal for those voxels displaying stimulus frequency activity with consistent phase and large amplitude. In our experience, this vector average method reduces the noise in mapping data -- i.e. spurious signal in non-map areas -- much more effectively than other methods such as phase-cancellation or raw averaging. This method also provides a more convenient way to combine data from multiple scans, regardless of the stimulus revolution direction used. When possible, however, subjects were scanned with equal numbers of scans with counterclockwise or clockwise stimulus revolutions. Phases for clockwise data were reversed before averaging. Making averages balanced with both counterclockwise and clockwise stimulus directions removes potential signals with reproducible phases that are not driven by stimulus location.
Block design group analysis
For each subject in the group analysis, their cortical white matter surface was inflated to a sphere and warped into a best-fit sulcal alignment with the FreeSurfer spherical atlas (Fischl et al., 1999b). Before resampling coefficients onto the average spherical surface, 10 steps of surface-based smoothing was performed, equivalent to a 4 mm full-width, half-max (FWHM) Gaussian filter (Hagler et al., 2006). T-statistics and means were generated for each condition and the paired pointing vs. saccade contrast. Results were sampled back onto the surface of a single subject. For group average of block-design data, cluster size exclusion was used to correct for multiple comparisons, with t-statistics thresholded at p < 10−2 and cortical surface clusters smaller than 89 mm2 excluded, achieving a corrected p-value of 0.05 (Hagler et al., 2006).
Phase encoded group analysis
We have developed methods for group analysis of phase-encoded visuospatial mapping data, extending the methods described previously (Hagler and Sereno, 2006). Fourier analysis results in complex data with real and imaginary components. A vector average is calculated by independently averaging the real and imaginary components across subjects, preserving consensus phase information. To evaluate the reliability of these average maps and generate statistical thresholds, we calculated an F-statistic that compared the sum of the squared complex means to the complex variance:
| (1) |
In equation 1, xi is the real component of the Fourier results for the stimulus frequency (11 cycles per scan) for subject i, yi is the imaginary component, n is the number of subjects, x̄ and ȳ are the mean xi and yi across all subjects. This ratio of sums of squares is F-distributed with 2 and 2n-2 degrees of freedom. To test for differences in the pointing and saccade maps, the complex Fourier components at the stimulus frequency for saccades were subtracted from the pointing results and the complex F-statistic was calculated on this difference. Cluster size exclusion was used to correct for multiple comparisons, with F-statistics thresholded at p < 10−2 and cortical surface clusters smaller than 66 mm2 excluded, achieving a corrected p-value of 0.05.
Automated ROI definition
Regions of interest (ROIs) were defined automatically from t- or F-statistics using a sliding threshold cluster exclusion method (Hagler et al., 2006). Briefly, group statistics -- either from block-design or phase-encoded analysis -- were thresholded for multiple p-values (10−2, 10−3, 10−4, 10−5, 10−6, 10−7) and clusters of supra-threshold vertices were identified. Clusters smaller than a size threshold were excluded. The size thresholds were determined separately for each p-value using random field theory (RFT) estimation (Worsley et al., 1996; Andrade et al., 2001) and an estimate of the full-width-half-max (FWHM) smoothness of the data, estimated from normalized residuals of the group analyses (Kiebel et al., 1999; Worsley et al., 1999; Hagler et al., 2006). After identification of supra-threshold clusters for each p-value, overlap between clusters of the different p-thresholds was resolved by excluding the larger clusters (identified at lower thresholds). The remaining clusters were then “grown” to the boundaries of the p<10−2 threshold. This sliding threshold method has several advantages over manually selecting ROIs or the use of a single threshold. The method allows for the automatic and unbiased subdivision of large clusters while preserving lower significance clusters and maintaining reasonable spatial extents for ROI analysis.
For ROIs based on block-design data, pointingORsaccade ROIs were generated from a GLM test combining data from both pointing and saccade blocks whereas pointingVSsaccade ROIs were generated from activations significantly greater for pointing than for saccades.
PointingANDsaccade ROIs were defined by excluding those pointingORsaccade ROIs that were mostly overlapped by pointingVSsaccade ROIs (i.e. if more than half of the pointingORsaccade ROI’s surface area was shared with any of the pointingVSsaccade ROIs).
For ROIs based on phase-encoded data, the different groups of ROIs were generated similarly, except that pointingORsaccade ROIs were based on the complex F-statistic of the sum of pointing and saccade data for each subject and pointingVSsaccade ROIs were based on the complex F-statistic of the within subject differences between pointing and saccades. Thus, the pointingVSsaccade ROIs could identify areas with greater map activity for either pointing or saccades. Furthermore, because the Fourier results are complex values encoding both amplitude and phase, a significant difference could indicate either a difference in amplitude or a difference in phase.
ROI analyses of phase-encoded data
ROI analyses, like the vertex-by-vertex group analyses described above, were done on single subject data that were resampled to a common space via sulcal alignment on the average sphere.
ROIs defined from block-design data were used for an ROI analysis of the phase-encoded mapping data (Fig. 9). The real and imaginary components of the Fourier results for the stimulus frequency were converted to amplitude and phase. The amplitudes were then set positive or negative depending on whether the phase represented contralateral or ipsilateral space. The signed amplitude (contra-preference) was averaged within each ROI for each subject (Hagler and Sereno, 2006). The non-parametric, Wilcoxon signed-rank test was used to test for significant contralateral or ipsilateral preference and for differences between pointing and saccade contra-preference for each ROI, consistent across subjects. Because of the large number of ROIs tested, the threshold p-value for determining statistical significance was set to 0.013 to achieve a false discovery rate (FDR) of 0.05 (Genovese et al., 2002).
Figure 9.

ROI analysis of contralateral-preference. Left and right hemisphere cortical surfaces are shown with overlayed outlines of ROIs defined by block-design group statistics (see methods). On the left, ROIs were defined by areas activated by both pointing and saccades. On the right, ROIs were defined by areas with activity greater for pointing than saccades. ROIs with significant contra-preference (signed amplitude of phase-encoded mapping data; see methods) are annotated with a “+”, blue for pointing and red for saccades. ROIs with ipsilateral preference are annotated with a “−“. Two ROIs, one in left medial frontal cortex, and the other in lateral occipital cortex, are annotated with a blue “*”, indicating a significantly stronger contra-preference for pointing than for saccades.
The ROIs defined from phase-encoded data were used to carry out a phase histogram ROI analysis (Fig. 10). Phases were calculated from real and imaginary components and normalized to units of cycles; for right hemisphere ROIs, phases were offset by a half cycle and reversed so that for both hemispheres, phase = 0 corresponds to the middle of contralateral space, phase = −0.25 cycles corresponds to the lower vertical meridian, and phase = 0.25 cycles corresponds to the upper vertical meridian. For each subject, phases at the different vertices within an ROI were classified into 8 bins. A phase histogram was calculated by summing the surface area of each vertex -- normalized by the total surface area of the ROI -- within each phase bin. These phase histograms were averaged across subjects and plotted as phase histographs, with error bars indicating standard error of the mean.
Figure 10.
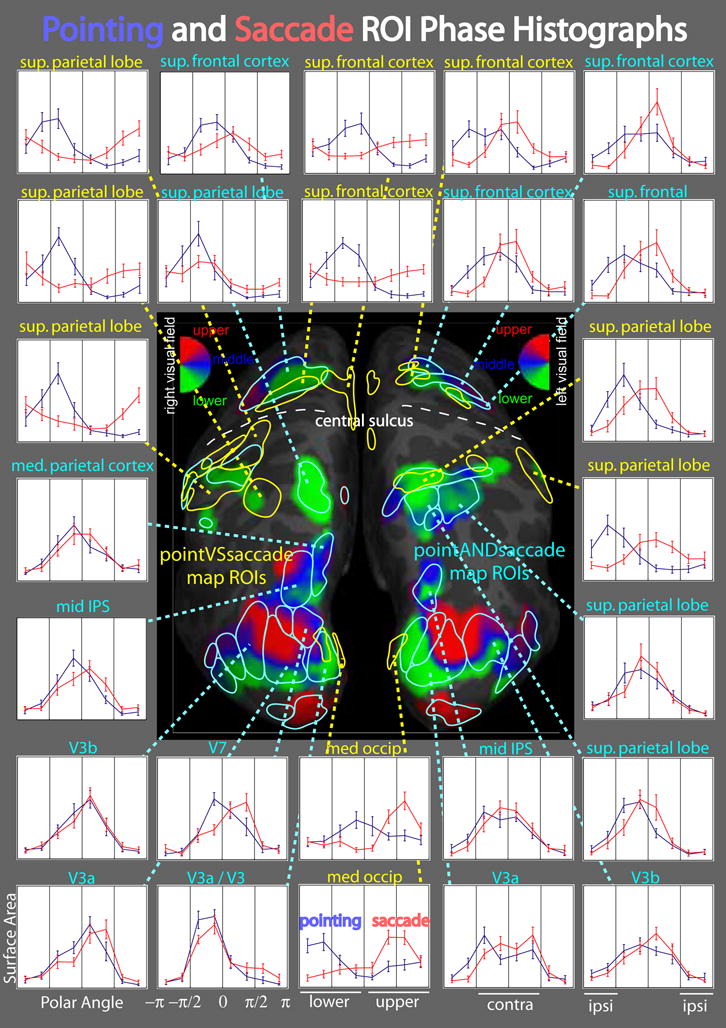
Phase histographs comparing pointing and saccade map activity. In the center, combined pointing and saccade group average maps (average of within-subject sums of pointing and saccade mapping data) are shown on left and right hemisphere cortical surfaces with overlayed ROIs defined by phase-encoded group statistics (see methods). PointingANDsaccade ROIs are outlined in cyan and pointingVSsaccade ROIs are outlined in yellow. In the surround, average phase histographs are shown for selected ROIs, with pointing plotted in blue and saccades plotted in red. Normalized surface area is plotted for each of 8 phase bins, with error bars representing the standard error of the cross-subject mean. The x-axis is divided into four quarters: lower ipsilateral, lower contralateral, upper contralateral, and upper ipsilateral. Phase = 0 corresponds to the middle of contralateral visual space. Normalized surface area is plotted along the y-axis, ranging from 0 to 0.5.
Results
Comparison of pointing and saccade related fMRI activations
Cortical areas activated during finger pointing and eye movements were localized using block-design fMRI experiments. 22 right-handed subjects were scanned while performing the following delayed visuomotor response tasks. Subjects maintained their gazes on a central fixation cross while a small peripheral target was presented (500 msec) at an eccentricity of ~8 degrees visual angle, with pseudo-random polar angles. After a brief delay period (500 – 1000 msec), the fixation cross changed color, cueing the subject to move their eyes or point their right index finger toward the remembered target location (Fig. 1). Pointing was done with the right hand resting on a cushion at the subject’s side, out of view. To avoid movement artifacts, pointing movements were small, without accompanying wrist flexion or arm movement.
Figure 1.
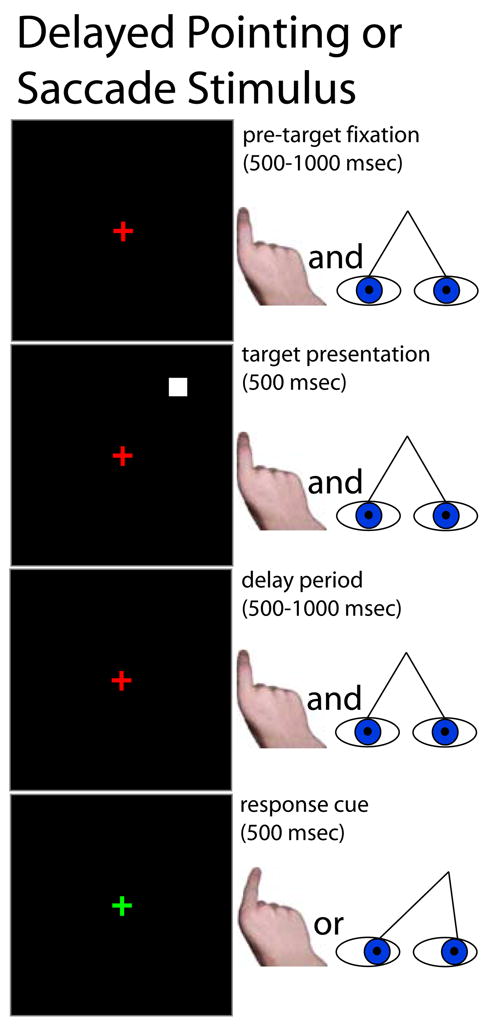
Stimulus schematic: delayed finger pointing or saccades to visual targets. While viewing a central fixation cross, subjects were presented with a peripheral target, followed by a variable delay. When the fixation cross changed colors, subjects moved their eyes to or pointed their right index finger in the direction of the remembered location of the target. The subjects’ hands were not visible to themselves.
Subjects were also instructed to avoid touching anything -- such as their leg or the hand cushion -- as they pointed their finger. Eye-movement or finger-pointing trials were separately grouped in blocks of 5–7 trials. These randomly ordered blocks were compared with alternating blocks of fixation-only trials in which no targets were presented. Before each block of trials, a text message was briefly presented to identify the nature of the succeeding trials.
Overall, activation patterns for pointing and saccades were quite similar, sharing prominent foci in posterior parietal cortex (PPC) and superior frontal cortex (SFC) (Fig. 2). Cortical surface-based regions-of-interest (ROIs) were automatically generated (see methods) based on common areas of activation between the pointing and saccade tasks (pointingANDsaccade ROIs) and are shown superimposed on the data pooled across condition (pointing OR saccade) in Figure 2 (56 left hemisphere ROIs, 59 right hemisphere ROIs). ROIs defined by areas with greater pointing activation (pointingVSsaccade ROIs) are shown superimposed on the GLM contrast between pointing and saccades in Figure 2 (10 left hemisphere ROIs, 1 right hemisphere ROI). Expectedly, pointing-specific areas of activation were found in left motor and somatosensory cortices, contralateral to the hand used to make pointing movements. Additional areas of activation, common to pointing and saccades, were found in premotor cortex (precentral sulcus) and the supplementary motor area (medial frontal cortex/cingulate). Prominent saccade-specific activity was found in occipital cortex, presumably due to visual stimulation caused by motion of the retinal image as the eyes moved. A relatively large area of medial parietal cortex, anterior to the parieto-occipital sulcus but posterior to the cingulate sulcus, has previously been identified as PRR (Connolly et al., 2003). We found activity in this area for both pointing and saccade conditions. The medial bank of the intraparietal sulcus, another potential human homologue to PRR (Grefkes et al., 2004), was similarly active for both pointing and saccades.
Figure 2.

Cortical areas recruited by eye movements and finger pointing. Randomized block design experiments were used to localize the areas involved in the visuomotor transformations necessary to make eye or hand movements to visual targets. Surface-based group analysis results, thresholded at p < 0.05 (n=22, corrected for multiple comparisons), are shown on inflated cortical surfaces. Activations to either pointing or saccades relative to fixation are shown on the left with superimposed “pointingANDsaccade” ROIs. The difference in activation between pointing and saccades is shown on the right with superimposed “pointingVSsaccade” ROIs outlining those areas with greater pointing activity. Pointing-specific activity is shown as positive, or redish-orange, and saccade-specific activity is shown as negative, or blue.
Phase-encoded mapping
In separate sessions, 13 subjects were scanned using phase-encoded polar angle mapping stimuli similar to those used in a previous mapping study (Sereno et al., 2001). In these experiments, the polar angle of the target location was gradually varied, such that every ~46.5 seconds (11 times per 512 second scan) the target location made one complete revolution about the central fixation cross. In this way, the polar angle of target location follows a sine function with respect to time. Areas with spatial preference should display periodic activity at the stimulus revolution frequency with a phase corresponding to the preferred polar angle. Fourier analysis of the data time series (see methods) identifies those areas containing maps of visual space. A map is defined as an area displaying strong periodic activity at the stimulus revolution frequency with systematic and substantial spatial variation in response phase corresponding to contralateral space. Each subject was scanned on two separate occasions with the same stimulus but instructions to perform either the delayed saccade or finger-pointing task. On each of these scan sessions, subjects were scanned 3 to 4 times (256 2-second repetitions per scan) and results from Fourier analyses of those scans were combined using a vector average (see methods).
Before describing in detail the results of the pointing and saccade mapping experiments, we first introduce a new method we have developed for vertex-wise, cortical surface-based group analysis of phase-encoded mapping data. A cross-subject vector average was used to obtain consensus maps and a complex F-statistic was calculated to identify areas with reliable cross-subject map activity (see methods). The F-statistic calculated with Equation 1 is similar to a typical t-statistic in that it is a ratio of the mean to the measurement variability; the difference here is that the mean and variance are calculated from complex Fourier results with real and imaginary components and that significant F values in this case indicate both large amplitude and consistent phase. That this statistic follows the F-distribution under the null hypothesis -- normally distributed real and imaginary components (random phase) -- was confirmed with Monte Carlo simulations (Fig. 3). For validation, we tested our method on maps in the early visual areas in occipital cortex measured with the typical flashing checkerboard wedge stimulus (DeYoe et al., 1994; Engel et al., 1994; Sereno et al., 1995; DeYoe et al., 1996; Engel et al., 1997). In Figure 4, we compare single subject maps (after registering to a common space via sulcal alignment) to the group average (without statistical threshold) and the complex F-statistic, and show the group average maps at two different threshold levels (each corrected for multiple comparisons to a final threshold of p<0.05). As would be expected, the maps in V1, V2, V3/VP, and V3A displayed the highest F-statistic values and survived this statistical test. Qualitatively, the group average maps preserve the information that is consistent across subjects.
Figure 3.

Empirical validation of complex F-statistic. Monte Carlo simulation was done to generate a probability density function for the complex F-statistic calculated with Equation 1. Vertical bars show the frequency of occurrence of different complex F-statistic values (10,000 iterations, n=13). Black circles and connecting line show the theoretical distribution for an F-statistic with 2 and 24 (i.e. 2n−2) degrees of freedom.
Figure 4.
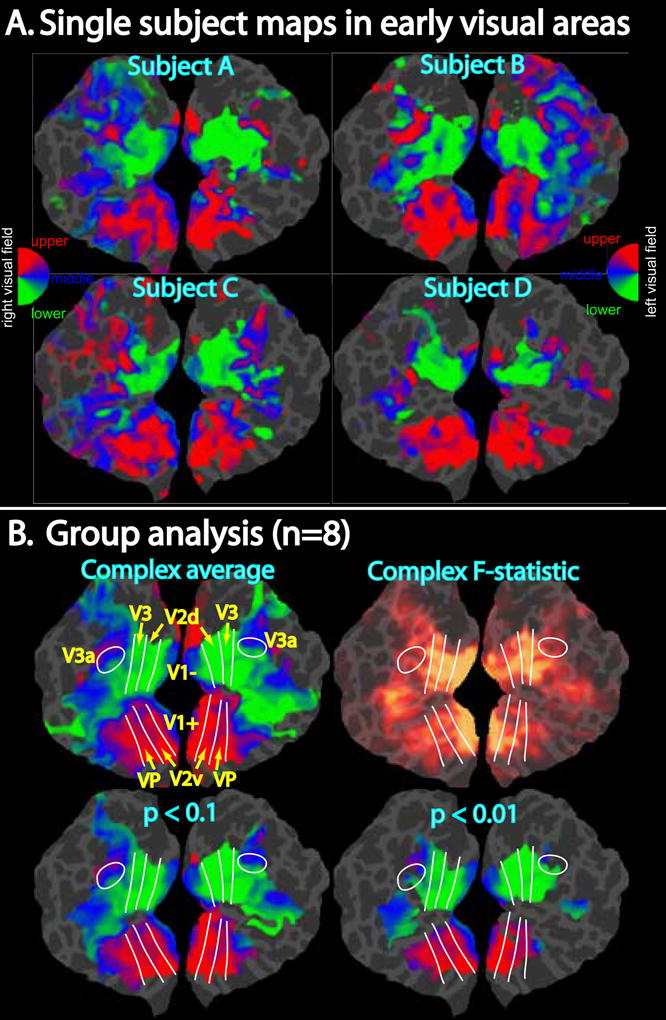
Demonstration of phase-encoded group analysis in early visual areas. A. Single subject phase-encoded mapping data in response to a rotating flashing checkerboard wedge is shown on flattened occipital patches (left and right hemispheres) after resampling to a common space via sulcal alignment. Data were thresholded to p<10−2, ipsilateral phases were truncated (amplitudes set to zero for vertices with ipsilateral phase), and finally the complex data were smoothed with an effective blurring kernel of 4 mm. B. Group analysis of mapping data. The upper left image shows the complex group average with ipsilateral phases truncated. Estimated borders between the early visual areas are shown as white lines. The upper right image shows the corresponding complex F-statistics calculated using Equation 1. F-statistics were scaled using a sigmoid function with a mid-point value of 4 and a slope of 0.1. The bottom row of images shows the complex average after applying two different statistical masks (p < 0.1 or p < 0.01) generated from the F-statistics. Cluster exclusion was used to correct for multiple comparisons (corrected p < 0.05; clusters > 228 mm2 for p < 0.1, clusters > 66 mm2 for p < 0.01).
Using the phase-encoded pointing and saccade stimuli, we observed clusters of maps located in occipital cortex, the intraparietal sulcus, and in superior frontal cortex (Figs. 5–7). Corresponding complex F-statistics are shown in Figure 8. In general, there is considerable variability between subjects in the precise layout and number of distinguishable maps; in parietal cortex, we have attempted to label particular maps that occur in most subjects (Figs. 5 and 6). In these images, an individual map can be identified by phase reversals. A phase reversal occurs when, such as between V3A and V7, the direction of phase change reverses (e.g. lower field to upper field vs. upper field to lower field). As has been described previously, a more or less continuous path of phase reversals is observed in the dorsal occipito-parietal region, progressing from V3A/V3B to V7 to IPS1 and IPS2 (Schluppeck et al., 2005; Silver et al., 2005). In several subjects we also observed additional, more anterior phase reversals that we label IPS3 (intraparietal sulcus 3) and mPC (medial parietal cortex). Furthermore, as with V3A and V3B, these parietal maps often came in twins or triplets. For example, Subject 1 in Figure 5 displays what appear to be two V7 and two IPS1 maps, separated by about 1 cm, with similar, but slightly different phase gradient directions. Several subjects have what appear to be two IPS2 maps with phase directions offset by approximately 90 degrees (e.g. pointing and saccade maps of Subject 5 in Figs. 5 and 6). These twin or triplet maps could indicate functional subdivisions, although more trivial explanations such as errors in cortical segmentation, registration between functional and structural images, or the presence of large veins may be more likely.
Figure 5.

Pointing and saccade maps of visual space in left parietal cortex. Single subject pointing and saccade maps for five exemplary subjects are compared to the group average maps (n = 13). Preferred polar angle (i.e. phase of periodic stimulus) is represented by different colors as indicated by the color wheel key. The inflated left hemisphere cortical surfaces are shown from a dorsal-posterior view, including the occipital pole to the post-central sulcus. Single subject maps were thresholded at p < 0.01 (uncorrected for multiple comparisons). Group average maps were thresholded at p < 0.05 (corrected for multiple comparisons with cluster exclusion). Ipsilateral phases were truncated.
Figure 7.

Pointing and saccade maps of visual space in superior frontal cortex. Single subject pointing and saccade maps for five exemplary subjects are compared to the group average maps (n = 13). Preferred polar angle (i.e. phase of periodic stimulus) is represented by different colors as indicated by the color wheel key. The inflated right and left hemisphere cortical surfaces are shown from a dorsal view of the superior frontal cortex, including the central sulcus and posterior part of the superior frontal sulcus. Single subject maps were thresholded at p < 0.01 (uncorrected for multiple comparisons). Group average maps were thresholded at p < 0.05 (corrected for multiple comparisons with cluster exclusion). Ipsilateral phases were truncated.
Figure 8.

Cross-subject complex F-statistics. A–D. Complex F-statistics, scaled with a sigmoid function with mid-point of 4 and slope of 0.1, are shown on inflated cortical surface. Data were thresholded at p < 0.01 and clusters > 66 mm2 (p < 0.05, corrected for multiple comparisons). A & B. Superior Frontal Cortex. C & D. Occipito-parietal cortex. A & C. Left hemisphere. B & D. Right hemisphere. For each of A–D, “Pointing OR Saccade” images are the cross-subject, complex F-stats from the within-subject sums of pointing and saccade phase-encoded data, and “Pointing VS Saccade” images are from the within-subject difference between pointing and saccade data.
Figure 6.

Pointing and saccade maps of visual space in right parietal cortex. Single subject pointing and saccade maps for five exemplary subjects are compared to the group average maps (n = 13). Preferred polar angle (i.e. phase of periodic stimulus) is represented by different colors as indicated by the color wheel key. The inflated right hemisphere cortical surfaces are shown from a dorsal-posterior view, including the occipital pole to the post-central sulcus. Single subject maps were thresholded at p < 0.01 (uncorrected for multiple comparisons). Group average maps were thresholded at p < 0.05 (corrected for multiple comparisons with cluster exclusion). Ipsilateral phases were truncated.
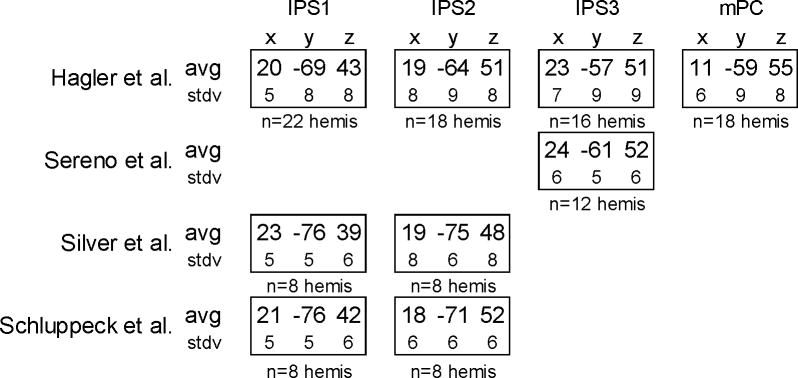
To compare the locations of the maps we observed with earlier studies (Sereno et al., 2001; Schluppeck et al., 2005; Silver et al., 2005), we calculated the average Talairach coordinates for IPS1, IPS2, IPS3, and mPC (Table 1). Because FreeSurfer uses the automated MNI Talairach transformation (Collins et al., 1994), we transformed these coordinates to standard Talairach space with Matthew Brett’s method (http://imaging.mrc-cbu.cam.ac.uk/imaging/MniTalairach). Our IPS1 and IPS2 coordinate estimates are similar to those cited Schluppeck et al. and Silver et al. (Table 1). Small differences, on the order of the standard deviations, may be explained by variation between the relatively small samples or the fact that the transformation between MNI and standard Talairach coordinates is an estimation and not necessarily accurate. The coordinates cited by Sereno et al. for the putative human LIP, on the other hand, are most similar to ISP3 (Table 1).
Table 1.
Average Talairach coordinates of estimated locations of PPC maps. In the first row, average Talairach coordinates are shown for PPC maps observed in the current study. Below each are shown the number of hemispheres in which these maps were observed (out of 26 hemispheres total). For comparison, the additional rows show the Talairach coordinates reported by Sereno et al., 2001, Silver et al., 2005, and Schluppeck et al., 2005. Talairach coordinates from Sereno et al. and the current study have been transformed from MNI-Talairach to standard Talairach space. Coordinates from Silver et al., Schluppeck et al., and the current study have been averaged across right and left hemispheres (using the absolute value of the x coordinate).
 |
We looked for systematic differences between pointing and saccade maps in our single subject data. For some subjects, the pointing and saccade maps are remarkably similar; for example, Subjects 1 and 5 in Figure 6. In other subjects, a clean map observed under one condition may be weak, obscured by noise, or completely absent under the other condition. For example, Subject 2’s left IPS1 is missing -- i.e. subthreshold -- for the pointing condition (Fig. 5). We did not find any clear evidence for a parietal map active for the pointing condition but not for saccades. Unsatisfied, however, with drawing conclusions solely from single subject data, we created a group average map using the method described above in an attempt to identify more subtle differences between pointing and saccade maps.
The most striking differences between the pointing and saccade maps were the large swaths of green coloration -- corresponding to the lower visual field -- extending into the post-central sulcus in the pointing maps. The possible origins of this signal will be discussed later, but whatever the source, it appears to have obscured the underlying average pointing maps in right parietal cortex that are observed in the average saccade maps as well as in several of the single subject pointing maps. This signal may also explain some of the more subtle differences observed in the posterior IPS maps.
As mentioned above, maps were also observed in SFC, around the junction of the superior frontal and precentral sulci, the general location of the FEF (Paus, 1996; Koyama et al., 2004). We observed multiple maps in both the single subject and group average maps, but we chose not to assign them individual names, instead simply estimating the phase directions (Fig. 7). There was again considerable inter-subject variability, but one map in particular was consistently observed in several subjects and in the pointing and saccade group averages. On the lateral bank of the SFS, extending into the superior part of the PCS, we observed a map pointing roughly parallel to the PCS with the lower field half anterior and the upper field half inferior (Fig. 7). Other, more superior and anterior maps were also observed in some subjects. As in parietal cortex, cross-condition comparisons within subjects were variable. Some subjects -- for example Subject 1 in Figure 7 -- showed strong similarities in the number and orientations of pointing and saccade maps. Some subjects exhibited more maps for one condition than the other; for example Subjects 3 and 4 in Figure 7. Despite the ambiguous single subject results, we did observe stark differences in the average pointing and saccade maps. First, as in parietal cortex, additional lower field representation was present in the average pointing maps. Second, the number of apparent maps was quite different between the conditions. In the left hemisphere, there seemed to be a single saccade map but perhaps two or three pointing maps. In the right hemisphere, the situation was reversed, with a single pointing map and what appeared to be several distinct saccade maps.
ROI analyses
Supplementing the analyses described above, we have performed a cross-subject ROI analysis to test for differences in the strength of pointing and saccade maps that may have been missed by our vertex-wise analysis. As described above, ROIs were automatically defined based on pointing and saccade block-design activations. The signed amplitudes of the phase-encoded activations, a measure of contralateral preference (see methods), within those ROIs were compared across subjects with the Wilcoxon signed-rank test. As shown in Figure 9, none of the parietal ROIs displayed significant differences between pointing and saccade phase-encoded activity, although a few displayed significant contra-preference for only one condition or the other. It should be noted that the more anterior and lateral parietal ROIs did not exhibit significant contra-preference for either condition. Furthermore, none of the pointingVSsaccade ROIs -- defined as those areas with block-design pointing activity greater for pointing than saccades -- displayed significant differences in contra-preference between pointing and saccades, although areas in the left postcentral sulcus (PoCS) did show significant ipsi-preference for saccades only. One of the SFC ROIs, located in medial SFC, did exhibit significantly greater contra-preference for pointing than saccades, although contra-preference for pointing itself was not significant and orderly maps of contralateral space were not observed there.
We also generated ROIs based on the phase-encoded data itself (see methods). The ROIs defined from pointingVSsaccade phase-encoded data are those areas that exhibited significantly different amplitudes and phases (as revealed by complex F-stats calculated from the vector differences between pointing and saccades). It should be noted that the region of parietal cortex comprising V7, IPS1, and IPS2 was not included in that set of ROIs (Fig. 10). Such ROIs were found, however, in more anterior parietal cortex, extending into the PoCS, and in the more posterior SFC, nearest to the central sulcus. We have created phase histographs for these ROIs -- and ROIs defined by the phase-encoded activity common to pointing and saccades -- depicting fractional surface area as a function of preferred polar angle (i.e. phase). It is instructive to first look at the phase histographs of the V3A/V3B ROIs. For both pointing and saccades, the distribution of phases were broadly centered over the center of contralateral space, falling off to low levels for ipsilateral phases. The mid-IPS ROIs, comprising the IPS1 and IPS2 maps, showed similar distributions with very little difference between pointing and saccades. Several other ROIs, particularly those in the PoCS and precentral gyrus (PCG), exhibited dramatic differences in phase distributions between pointing and saccades. For example, the right superior parietal lobe ROIs had phases centered over contralateral space for saccades but shifted toward lower field representations -- both contra- and ipsilateral -- for pointing. Medial occipital ROIs showed saccade activity shifted toward upper field representations. As indicated early, these differences were likely caused by motion of the retinal image as the eyes moved. One possible explanation for the shift toward upper field representations is that there could have been slightly more light contamination at one edge of the mirror than the other, resulting in slightly increased activation in visual cortex during eye movements to the upper visual field.
Discussion
We have observed a series of topographic maps of visual space in both posterior parietal cortex and superior frontal cortex using fMRI measurements on subjects performing delayed saccade and pointing tasks. A map in PPC was initially described by Sereno et al. (Sereno et al., 2001). Later work at higher fields revealed two maps in human PPC (Schluppeck et al., 2005; Silver et al., 2005). Our study has demonstrated the presence of at least four parietal maps. Because Sereno et al. used a 1.5T MRI scanner, the earlier observation of only one of these maps is perhaps due to lower SNR than the later studies with 3T scanners. Furthermore, the use of a single surface coil by Sereno et al. would have made those measurements sensitive to the precise placement of the coil relative to the brain, such that maps closer to the coil would have had higher SNR than others. Thus different maps may have been observed in different subjects. For example, while the Talairach coordinates for Sereno et al.’s putative human LIP most closely match IPS3 in the current study (Table 1), the earlier study’s Figure 2 shows a map from a single subject that more closely resembles IPS1 based on its posterior location relative to the intraparietal and post-central sulci and its proximity to V3A. Schluppeck et al. and Silver et al. performed their studies with a 3T scanner and a 4-channel occipital surface coil array. The posterior positioning of the coil array may explain why they did not observe IPS3 and mPC. It is also possible that the small sample size in those studies (4 subjects participated in both studies) was an insufficient sample of the population, given the significant inter-subject variability that we observed.
The maps we and others observe in these higher level cortical regions are patches of cortex that respond preferentially to different parts of the visual field, arranged topographically, but not all of these maps are necessarily discrete functional areas. For example, periodic fMRI activations at the stimulus frequency with spatially varying phase could arise from aliased physiological signals due to the heart beat and respiration. Averaging data from clockwise and counterclockwise stimulus presentation sequences as we have done minimizes the contribution from periodic signals with phases that are not dependent on the stimulus, and the group analyses we have developed identify phase-encoded activity that is consistent across subjects. Nevertheless, it is possible that neighboring functional areas could have different visual field preferences (Levy et al., 2001; Hasson et al., 2002), so any identification of functional areas based on topography is necessarily provisional. Future study will be required to better understand the functional organization of these cortical regions.
Spatial selectivity has been studied in human SFC, but to our knowledge, there is only one study using continuous polar angle mapping (Hagler and Sereno, 2006). Rosano et al. used fMRI to identify sub-regions of the FEF specialized for saccades or smooth pursuit (Rosano et al., 2002) and Medendorp et al. demonstrated preference for contralateral targets in FEF (Medendorp et al., 2004). In the recent study from our laboratory, an object-related working memory stimulus revealed polar angle maps in dorsolateral prefrontal cortex and lateral frontal cortex, as well as in PPC and SFC (Hagler and Sereno, 2006). In the current study, we did not observe maps in prefrontal cortex or lateral frontal cortex -- presumably because of the different demands of the current tasks -- but the maps in PPC and SFC were robust and extensive. Thus, our current study has provided what may be the most detailed view to date of the visual maps found in PPC and SFC.
The main goal of our study, however, was to test the existence of pointing-specific maps of visual space that might be involved in coordinate transformations necessary for visually-directed hand movements. Several cortical areas were potential locations for such maps, including PRR -- which has been located in medial PPC (Astafiev et al., 2003; Connolly et al., 2003) but also in the medial bank of the IPS (Grefkes et al., 2004) -- and hand-related motor or premotor cortex (Graziano et al., 1994; Shen and Alexander, 1997a, b). Conclusive evidence of a pointing-specific map, however, was lacking. This raises the possibility that the PPC and SFC maps are effector-independent. Some of the subtle differences observed in the pointing and saccade maps, however, suggest that a more nuanced view may be necessary. As we will discuss further, some of these differences may be explained by multiple, overlayed maps with different reference frames.
We observed what appeared to be additional lower field representations in the phase-encoded group average pointing data. This signal was found primarily in anterior IPS, PoCS, PCG, and medial SFC. These areas in general are involved in either multisensory or somatosensory processing or motor control, and so some of this signal may be related to sensorimotor feedback associated with pointing. Subjects were instructed to avoid touching anything with their finger while pointing, but it is possible that some tactile stimulation occurred anyway in some subjects. Somatosensory stimulation could originate from stretch receptors in the finger muscles or cutaneous receptor stimulation caused by changes in finger pose. Another, more interesting possibility is that such activity originates from pointing-related topographic maps in one or more non-retinocentric reference frames.
In the more anterior portion of right PPC and in right SFC, the large patches of lower field signal in the average pointing maps colocalized with a number of clustered saccade maps. In the phase-encoded data for several subjects, very similar pointing and saccade maps were observed; in some cases an additional, but weak lower field bias is observed in the pointing maps (Figs. 6 and 7). The ROI phase-histograms in these areas showed that the phase distributions are indeed shifted toward lower field representations (Fig. 10). This small but consistent effect in single subjects became the dominant signal in the average maps. An explanation for such a biasing signal might be the presence of neurons with head- or body-centered receptive fields coexisting with the retinocentric maps. In the current study, subjects’ hands were always near or below waist level, and thus all stimulus locations would be in the lower field relative to the head or torso. The maps in these areas may respond to stimuli at all visual field locations, but when the lower field hand position (relative to the body) coincides with a lower visual field stimulus, the neural activity and phase-encoded signal may be slightly larger than for other visual field stimuli.
One way to obtain pointing maps without this lower field bias might be to have subjects physically point to locations above and below their heads. A difficulty, though, in the context of fMRI experiments, is that large arm movements or movement of the hand near the head cause motion artifacts and dynamic B0 inhomogeneities that could obscure the signal from a phase-encoded stimulus. A more feasible approach to test the hypothesis of head- or body-centered modulation would be to compare the maps from the current study to pointing maps obtained when subjects’ arms are positioned above their heads, where an upper field bias would be expected.
Another reason why we may have failed to detect pointing or reaching-related maps is that subjects were instructed to make minimal pointing movements, clearly different from the reaching movements used in previous monkey studies of PRR (Snyder et al., 1997; Batista et al., 1999; Snyder et al., 2000a). Fully extending the arm to make physical contact with a target in peri-personal space requires more computations, recruits a larger number of muscles, involves several joints, lasts longer, and involves more somatosensory feedback. Medial PPC, a possible human homologue of PRR, has been shown to exhibit block-design or event-related activity that is greater for pointing than saccades when subjects were able to view their own hands as they extended their arm to point to targets (Astafiev et al., 2003; Connolly et al., 2003); but not, as in our study, when subjects’ hands were not visible (Simon et al., 2002; Medendorp et al., 2004). In the macaque monkey, PRR comprises MIP and V6A (Batista et al., 1999), areas that respond to moving stimuli in peri-personal space (Colby and Duhamel, 1991; Galletti et al., 1999), so the lack of visual feedback from visible hand movement is a plausible explanation for the lack of stronger pointing activity in medial PPC in the current study. There may, however, be other relevant differences between previous studies and ours, for example with the timing of stimulus delays. Monkey PRR neurons display greater activity during preparation for reaching compared to preparation for saccades, but peri- and post-saccade activity has been observed in monkey PRR (Snyder et al., 2000a). Thus if we had extended the delay period in our stimulus, pointing activity may have been stronger than saccade activity in medial PPC.
It is worth noting that our task is, however, quite similar to the use of a computer mouse, an extremely common activity involving low amplitude hand movements, a visuomotor coordinate transformation, and lack of attention to or even sight of the hand.
Group analysis of phase-encoded data
As mentioned earlier, there is considerable between-subject variability in phase-encoded maps. Part of this variability is due to differences in minor sulcal patterns and not necessarily differences in functional anatomy. By registering subjects via sulcal alignment (Fischl et al., 1999a; Fischl et al., 1999b), these differences are reduced. To enable quantitative, statistical, cross-subject comparisons, we have developed new, group analysis methods for surface-based, phase-encoded, mapping data that provide an increased signal-to-noise ratio and exclude those regions where maps are excessively variable. The cross-subject vector average distills the consensus map information, and the complex F-statistic provides a statistical threshold that identifies areas where measurement error and cross-subject variability is outweighed by consistency in map amplitude and phase. Areas that do not survive this threshold may nonetheless contain maps that can be observed in multiple subjects (e.g. IPS3 in left PPC; Fig. 5); so single-subject analyses remain important. We also used this method to test for differences between two phase-encoded stimulus conditions, similar to a paired two-sample t-test. An unpaired two-sample test to test for differences in maps between two different subject populations is also possible, although with a slightly different formulation based on ANOVA.
Comparing humans and monkeys
There is a wealth of accumulated knowledge about the non-human primate brain from invasive electrophysiological and anatomical studies to be compared with the results of the present study. The monkey data suggests that the intraparietal sulcus contains several distinct functional areas, including LIP, VIP, AIP, and MIP, which are involved in different aspects of attention, visuomotor control, and sensory integration (Colby and Goldberg, 1999; Snyder et al., 2000b). Recently, some of these areas have been further subdivided, with as many as 5 subdivisions reported for macaque LIP (Gattass et al., 2005). Thus, determining which maps observed in the human correspond to LIP, VIP, AIP, or MIP is not a trivial matter. Of the multiple representations of visual space we observed in PPC -- i.e. IPS1, IPS2, IPS3, mPC and their possible subdivisions -- some may be homologous to the multiple monkey LIP’s while others may correspond to VIP, AIP, or MIP (or their subdivisions). Further clarification of precise homology awaits future mapping experiments using stimuli designed to distinguish between these functionally distinct areas.
It should be noted that previous attempts to measure topographic organization of monkey parietal areas using single unit recordings have not typically shown maps of visual space with such clearly organized topography as can be found with fMRI. Blatt et al. found a clear progression of visual field preference in LIP of anesthetized monkeys but also found some duplications, perhaps indicative of a generally rough topography (Blatt et al., 1990), but also suggestive of the presence of multiple maps. Some of the difficulty in finding clear topographic maps may be a practical issue relating to limitations of single unit recordings. It is, however, certainly possible that higher level visual maps are relatively crude compared to the orderly maps in early visual areas and that the inherent spatial blurring of fMRI reveals the overall trends. Broad spatial tuning (Barash et al., 1991) and lack of contralateral preference (Platt and Glimcher, 1998) has been observed in LIP neurons in some single unit monkey studies. For a better comparison of parietal maps in monkeys and humans, it would be informative to perform saccade mapping experiments in monkeys using fMRI.
The maps and block-design activity we observed in SFC were located at the junction of the SFS and PCS, an area homologous to monkey FEF (Paus, 1996; Koyama et al., 2004). Several studies of the macaque monkey have found topographic representations of saccade amplitude and direction (Robinson and Fuchs, 1969; Suzuki and Azuma, 1983; Bruce et al., 1985; Tehovnik and Lee, 1993) in and around monkey FEF. Some of these studies have found multiple representations of polar angle (Suzuki and Azuma, 1983; Bruce et al., 1985); while this could indicate, as with the parietal areas, only a very rough topography, we favor the interpretation that these multiple representations, similar to the multiple SFC representations observed in the current study, are actually distinct maps of visual space.
Future studies
In both PPC and SFC, we observed multiple maps of visual space. Further st udy is required to clarify the roles of these seemingly redundant maps. We have found in general that varying phase-encoded mapping stimulus conditions is a useful strategy for investigating the functions of the various visual maps. Furthermore, future studies using arrays of smaller, higher signal-to-noise, surface coils will allow for better spatial resolution imaging and may provide new insights into the numerous, small, visuospatial maps distributed across the cortical surface.
Acknowledgments
Support contributed by : NSF BCS 0224321 and NIMH NRSA 5F32MH066578-02
The authors thank Anders Dale for helpful discussions on statistics.
Footnotes
Publisher's Disclaimer: This is a PDF file of an unedited manuscript that has been accepted for publication. As a service to our customers we are providing this early version of the manuscript. The manuscript will undergo copyediting, typesetting, and review of the resulting proof before it is published in its final citable form. Please note that during the production process errors may be discovered which could affect the content, and all legal disclaimers that apply to the journal pertain.
Literature Cited
- Andrade A, Kherif F, Mangin JF, Worsley KJ, Paradis AL, Simon O, Dehaene S, Le Bihan D, Poline JB. Detection of fMRI activation using cortical surface mapping. Hum Brain Mapp. 2001;12:79–93. doi: 10.1002/1097-0193(200102)12:2<79::AID-HBM1005>3.0.CO;2-I. [DOI] [PMC free article] [PubMed] [Google Scholar]
- Astafiev SV, Shulman GL, Stanley CM, Snyder AZ, Van Essen DC, Corbetta M. Functional organization of human intraparietal and frontal cortex for attending, looking, and pointing. J Neurosci. 2003;23:4689–4699. doi: 10.1523/JNEUROSCI.23-11-04689.2003. [DOI] [PMC free article] [PubMed] [Google Scholar]
- Bandettini PA, Jesmanowicz A, Wong EC, Hyde JS. Processing strategies for time-course data sets in functional MRI of the human brain. Magn Reson Med. 1993;30:161–173. doi: 10.1002/mrm.1910300204. [DOI] [PubMed] [Google Scholar]
- Barash S, Bracewell RM, Fogassi L, Gnadt JW, Andersen RA. Saccade-related activity in the lateral intraparietal area. II. Spatial properties. J Neurophysiol. 1991;66:1109–1124. doi: 10.1152/jn.1991.66.3.1109. [DOI] [PubMed] [Google Scholar]
- Batista AP, Buneo CA, Snyder LH, Andersen RA. Reach plans in eye-centered coordinates. Science. 1999;285:257–260. doi: 10.1126/science.285.5425.257. [DOI] [PubMed] [Google Scholar]
- Beauchamp MS, Petit L, Ellmore TM, Ingeholm J, Haxby JV. A parametric fMRI study of overt and covert shifts of visuospatial attention. Neuroimage. 2001;14:310–321. doi: 10.1006/nimg.2001.0788. [DOI] [PubMed] [Google Scholar]
- Blatt GJ, Andersen RA, Stoner GR. Visual receptive field organization and cortico-cortical connections of the lateral intraparietal area (area LIP) in the macaque. J Comp Neurol. 1990;299:421–445. doi: 10.1002/cne.902990404. [DOI] [PubMed] [Google Scholar]
- Bruce CJ, Goldberg ME, Bushnell MC, Stanton GB. Primate frontal eye fields. II. Physiological and anatomical correlates of electrically evoked eye movements. J Neurophysiol. 1985;54:714–734. doi: 10.1152/jn.1985.54.3.714. [DOI] [PubMed] [Google Scholar]
- Colby CL, Duhamel JR. Heterogeneity of extrastriate visual areas and multiple parietal areas in the macaque monkey. Neuropsychologia. 1991;29:517–537. doi: 10.1016/0028-3932(91)90008-v. [DOI] [PubMed] [Google Scholar]
- Colby CL, Goldberg ME. Space and attention in parietal cortex. Annu Rev Neurosci. 1999;22:319–349. doi: 10.1146/annurev.neuro.22.1.319. [DOI] [PubMed] [Google Scholar]
- Collins DL, Neelin P, Peters TM, Evans AC. Automatic 3D intersubject registration of MR volumetric data in standardized Talairach space. J Comput Assist Tomogr. 1994;18:192–205. [PubMed] [Google Scholar]
- Connolly JD, Andersen RA, Goodale MA. FMRI evidence for a ‘parietal reach region’ in the human brain. Exp Brain Res. 2003;153:140–145. doi: 10.1007/s00221-003-1587-1. [DOI] [PubMed] [Google Scholar]
- Corbetta M, Akbudak E, Conturo TE, Snyder AZ, Ollinger JM, Drury HA, Linenweber MR, Petersen SE, Raichle ME, Van Essen DC, Shulman GL. A common network of functional areas for attention and eye movements. Neuron. 1998;21:761–773. doi: 10.1016/s0896-6273(00)80593-0. [DOI] [PubMed] [Google Scholar]
- Cox RW. AFNI: software for analysis and visualization of functional magnetic resonance neuroimages. Comput Biomed Res. 1996;29:162–173. doi: 10.1006/cbmr.1996.0014. [DOI] [PubMed] [Google Scholar]
- Crawford JD, Medendorp WP, Marotta JJ. Spatial transformations for eye-hand coordination. J Neurophysiol. 2004;92:10–19. doi: 10.1152/jn.00117.2004. [DOI] [PubMed] [Google Scholar]
- DeYoe EA, Bandettini P, Neitz J, Miller D, Winans P. Functional magnetic resonance imaging (FMRI) of the human brain. J Neurosci Methods. 1994;54:171–187. doi: 10.1016/0165-0270(94)90191-0. [DOI] [PubMed] [Google Scholar]
- DeYoe EA, Carman GJ, Bandettini P, Glickman S, Wieser J, Cox R, Miller D, Neitz J. Mapping striate and extrastriate visual areas in human cerebral cortex. Proc Natl Acad Sci U S A. 1996;93:2382–2386. doi: 10.1073/pnas.93.6.2382. [DOI] [PMC free article] [PubMed] [Google Scholar]
- Engel SA, Glover GH, Wandell BA. Retinotopic organization in human visual cortex and the spatial precision of functional MRI. Cereb Cortex. 1997;7:181–192. doi: 10.1093/cercor/7.2.181. [DOI] [PubMed] [Google Scholar]
- Engel SA, Rumelhart DE, Wandell BA, Lee AT, Glover GH, Chichilnisky EJ, Shadlen MN. fMRI of human visual cortex. Nature. 1994;369:525. doi: 10.1038/369525a0. [DOI] [PubMed] [Google Scholar]
- Fischl B, Sereno MI, Dale AM. Cortical surface-based analysis. II: Inflation, flattening, and a surface-based coordinate system. Neuroimage. 1999a;9:195–207. doi: 10.1006/nimg.1998.0396. [DOI] [PubMed] [Google Scholar]
- Fischl B, Sereno MI, Tootell RB, Dale AM. High-resolution intersubject averaging and a coordinate system for the cortical surface. Hum Brain Mapp. 1999b;8:272–284. doi: 10.1002/(SICI)1097-0193(1999)8:4<272::AID-HBM10>3.0.CO;2-4. [DOI] [PMC free article] [PubMed] [Google Scholar]
- Galletti C, Fattori P, Kutz DF, Gamberini M. Brain location and visual topography of cortical area V6A in the macaque monkey. Eur J Neurosci. 1999;11:575–582. doi: 10.1046/j.1460-9568.1999.00467.x. [DOI] [PubMed] [Google Scholar]
- Gattass R, Nascimento-Silva S, Soares JG, Lima B, Jansen AK, Diogo AC, Farias MF, Botelho MM, Mariani OS, Azzi J, Fiorani M. Cortical visual areas in monkeys: location, topography, connections, columns, plasticity and cortical dynamics. Philos Trans R Soc Lond B Biol Sci. 2005;360:709–731. doi: 10.1098/rstb.2005.1629. [DOI] [PMC free article] [PubMed] [Google Scholar]
- Genovese CR, Lazar NA, Nichols T. Thresholding of statistical maps in functional neuroimaging using the false discovery rate. Neuroimage. 2002;15:870–878. doi: 10.1006/nimg.2001.1037. [DOI] [PubMed] [Google Scholar]
- Graziano MS, Yap GS, Gross CG. Coding of visual space by premotor neurons. Science. 1994;266:1054–1057. doi: 10.1126/science.7973661. [DOI] [PubMed] [Google Scholar]
- Grefkes C, Ritzl A, Zilles K, Fink GR. Human medial intraparietal cortex subserves visuomotor coordinate transformation. Neuroimage. 2004;23:1494–1506. doi: 10.1016/j.neuroimage.2004.08.031. [DOI] [PubMed] [Google Scholar]
- Hagler DJ, Jr, Sereno MI. Spatial maps in frontal and prefrontal cortex. Neuroimage. 2006;29:567–577. doi: 10.1016/j.neuroimage.2005.08.058. [DOI] [PubMed] [Google Scholar]
- Hagler DJ, Jr, Saygin AP, Sereno MI. Smoothing and cluster thresholding for cortical surface-based group analysis of fMRI data. Neuroimage. 2006;33:1093–1103. doi: 10.1016/j.neuroimage.2006.07.036. [DOI] [PMC free article] [PubMed] [Google Scholar]
- Hasson U, Levy I, Behrmann M, Hendler T, Malach R. Eccentricity bias as an organizing principle for human high-order object areas. Neuron. 2002;34:479–490. doi: 10.1016/s0896-6273(02)00662-1. [DOI] [PubMed] [Google Scholar]
- Kiebel SJ, Poline JB, Friston KJ, Holmes AP, Worsley KJ. Robust smoothness estimation in statistical parametric maps using standardized residuals from the general linear model. Neuroimage. 1999;10:756–766. doi: 10.1006/nimg.1999.0508. [DOI] [PubMed] [Google Scholar]
- Koyama M, Hasegawa I, Osada T, Adachi Y, Nakahara K, Miyashita Y. Functional magnetic resonance imaging of macaque monkeys performing visually guided saccade tasks: comparison of cortical eye fields with humans. Neuron. 2004;41:795–807. doi: 10.1016/s0896-6273(04)00047-9. [DOI] [PubMed] [Google Scholar]
- Larsen RJ, Marx ML. Englewood Cliffs. 2. New Jersey: Prentice-Hall; 1986. An Introduction to Mathematical Statistics and Its Applications. [Google Scholar]
- Levy I, Hasson U, Avidan G, Hendler T, Malach R. Center-periphery organization of human object areas. Nat Neurosci. 2001;4:533–539. doi: 10.1038/87490. [DOI] [PubMed] [Google Scholar]
- Medendorp WP, Goltz HC, Crawford JD, Vilis T. Integration of target and effector information in human posterior parietal cortex for the planning of action. J Neurophysiol. 2004 doi: 10.1152/jn.00725.2004. [DOI] [PubMed] [Google Scholar]
- Nobre AC, Gitelman DR, Dias EC, Mesulam MM. Covert visual spatial orienting and saccades: overlapping neural systems. Neuroimage. 2000;11:210–216. doi: 10.1006/nimg.2000.0539. [DOI] [PubMed] [Google Scholar]
- Paus T. Location and function of the human frontal eye-field: a selective review. Neuropsychologia. 1996;34:475–483. doi: 10.1016/0028-3932(95)00134-4. [DOI] [PubMed] [Google Scholar]
- Platt ML, Glimcher PW. Response fields of intraparietal neurons quantified with multiple saccadic targets. Exp Brain Res. 1998;121:65–75. doi: 10.1007/s002210050438. [DOI] [PubMed] [Google Scholar]
- Robinson DA, Fuchs AF. Eye movements evoked by stimulation of frontal eye fields. J Neurophysiol. 1969;32:637–648. doi: 10.1152/jn.1969.32.5.637. [DOI] [PubMed] [Google Scholar]
- Rosano C, Krisky CM, Welling JS, Eddy WF, Luna B, Thulborn KR, Sweeney JA. Pursuit and saccadic eye movement subregions in human frontal eye field: a high-resolution fMRI investigation. Cereb Cortex. 2002;12:107–115. doi: 10.1093/cercor/12.2.107. [DOI] [PubMed] [Google Scholar]
- Schluppeck D, Glimcher P, Heeger DJ. Topographic organization for delayed saccades in human posterior parietal cortex. J Neurophysiol. 2005;94:1372–1384. doi: 10.1152/jn.01290.2004. [DOI] [PMC free article] [PubMed] [Google Scholar]
- Sereno MI, Pitzalis S, Martinez A. Mapping of contralateral space in retinotopic coordinates by a parietal cortical area in humans. Science. 2001;294:1350–1354. doi: 10.1126/science.1063695. [DOI] [PubMed] [Google Scholar]
- Sereno MI, Dale AM, Reppas JB, Kwong KK, Belliveau JW, Brady TJ, Rosen BR, Tootell RB. Borders of multiple visual areas in humans revealed by functional magnetic resonance imaging. Science. 1995;268:889–893. doi: 10.1126/science.7754376. [DOI] [PubMed] [Google Scholar]
- Shen L, Alexander GE. Preferential representation of instructed target location versus limb trajectory in dorsal premotor area. J Neurophysiol. 1997a;77:1195–1212. doi: 10.1152/jn.1997.77.3.1195. [DOI] [PubMed] [Google Scholar]
- Shen L, Alexander GE. Neural correlates of a spatial sensory-to-motor transformation in primary motor cortex. J Neurophysiol. 1997b;77:1171–1194. doi: 10.1152/jn.1997.77.3.1171. [DOI] [PubMed] [Google Scholar]
- Silver MA, Ress D, Heeger DJ. Topographic maps of visual spatial attention in human parietal cortex. J Neurophysiol. 2005;94:1358–1371. doi: 10.1152/jn.01316.2004. [DOI] [PMC free article] [PubMed] [Google Scholar]
- Simon O, Mangin JF, Cohen L, Le Bihan D, Dehaene S. Topographical layout of hand, eye, calculation, and language-related areas in the human parietal lobe. Neuron. 2002;33:475–487. doi: 10.1016/s0896-6273(02)00575-5. [DOI] [PubMed] [Google Scholar]
- Snyder LH, Batista AP, Andersen RA. Coding of intention in the posterior parietal cortex. Nature. 1997;386:167–170. doi: 10.1038/386167a0. [DOI] [PubMed] [Google Scholar]
- Snyder LH, Batista AP, Andersen RA. Saccade-related activity in the parietal reach region. J Neurophysiol. 2000a;83:1099–1102. doi: 10.1152/jn.2000.83.2.1099. [DOI] [PubMed] [Google Scholar]
- Snyder LH, Batista AP, Andersen RA. Intention-related activity in the posterior parietal cortex: a review. Vision Res. 2000b;40:1433–1441. doi: 10.1016/s0042-6989(00)00052-3. [DOI] [PubMed] [Google Scholar]
- Suzuki H, Azuma M. Topographic studies on visual neurons in the dorsolateral prefrontal cortex of the monkey. Exp Brain Res. 1983;53:47–58. doi: 10.1007/BF00239397. [DOI] [PubMed] [Google Scholar]
- Tehovnik EJ, Lee K. The dorsomedial frontal cortex of the rhesus monkey: topographic representation of saccades evoked by electrical stimulation. Exp Brain Res. 1993;96:430–442. doi: 10.1007/BF00234111. [DOI] [PubMed] [Google Scholar]
- Ward BD. AFNI 3dDeconvolve Documentation. Medical College of Wisconsin; 2000. Deconvolution Analysis of FMRI time series data. [Google Scholar]
- Worsley KJ, Andermann M, Koulis T, MacDonald D, Evans AC. Detecting changes in nonisotropic images. Hum Brain Mapp. 1999;8:98–101. doi: 10.1002/(SICI)1097-0193(1999)8:2/3<98::AID-HBM5>3.0.CO;2-F. [DOI] [PMC free article] [PubMed] [Google Scholar]
- Worsley KJ, Marrett S, Neelin P, Vandal AC, Friston KJ, Evans AC. A unified statistical approach for determining significant signals in images of cerebral activation. Hum Brain Mapp. 1996;4:58–73. doi: 10.1002/(SICI)1097-0193(1996)4:1<58::AID-HBM4>3.0.CO;2-O. [DOI] [PubMed] [Google Scholar]
- Zarahn E, Aguirre GK, D’Esposito M. Empirical analyses of BOLD fMRI statistics. I. Spatially unsmoothed data collected under null-hypothesis conditions. Neuroimage. 1997;5:179–197. doi: 10.1006/nimg.1997.0263. [DOI] [PubMed] [Google Scholar]