Abstract
Objective
To evaluate the outcome of intrauterine growth restriction (IUGR) infants with abnormal pulsatility index of the umbilical artery according to the neonatal birth weight/gestational age standards and the intrauterine growth charts.
Methods
We analyzed 53 pregnancies with severe IUGR classified as Group 2 (22 IUGR: abnormal pulsatility index and normal fetal heart rate) and Group 3 (31 IUGR: abnormal pulsatility index and fetal heart rate). Neonatal birth weight/gestational age distribution, body size measurements, maternal characteristics and obstetric outcome, and neonatal major and minor morbidity and mortality were compared with those obtained in 79 singleton pregnancies with normal fetal growth and pulsatility index, matched for gestational age [appropriate for gestational age (AGA) group]. Differences were analyzed with the χ2 test and the Student’s t test. Differences between means corrected for gestational age in the different groups were assessed by analysis of covariance test. A P value <0.05 was considered significant.
Results
At delivery, utilizing the neonatal standards, 25/53 (47%) IUGR showed a birthweight above the 10th percentile (IUGRAGA) whereas in 28, birthweight was below the 10th percentile (IUGRSGA). All body size measurements were significantly higher in AGA than in IUGRAGA and IUGRSGA. Forty-nine out of 79 (62%) AGA and 49/53 (92%) IUGR were admitted in the neonatal intensive care unit (p<0.001). One out of 79 (1%) AGA and 6/53 (11%) IUGR newborns died within 28 days (p<0.02). Major and minor morbidity was not different.
Conclusion
This study shows that neonatal outcome is similar in IUGR of the same clinical severity, whether or not they could be defined AGA or SGA according to the neonatal standards. Neonatal curves are misleading in detecting low birthweight infants and should be utilized only when obstetrical data are unavailable.
Introduction
Infants born with intrauterine growth restriction (IUGR) are considered at increased risk of perinatal morbidity and mortality (1, 2, 3). Despite the importance of making the diagnosis of IUGR correctly, the recognition of low birthweight often remains based upon population based norms which utilize neonatal birthweight data without taking into account the characteristics of intrauterine growth, of physiological determinants of individual growth and of potentially inaccurate dating. As a matter of fact, most studies evaluating the perinatal outcome in preterm babies compare appropriate versus small for gestational age infants or report outcomes based upon birthweight based on gestational-age based categories with no information about fetal growth. Most studies utilize the analysis of large databases in which the assessment of gestational age and/or growth are made retrospectively (1, 2, 3). However, it has already been pointed out that population based standards which utilize neonatal birthweights are limited by the fact that inclusion of premature growth restricted infants incorrectly lowers the norms resulting in a high rate of misclassification of newborns with some IUGR infants inappropriately considered to have normal fetal growth. (4). In the past, we have shown that there are significant differences in oxygenation and acid base balance (5, 6) as well in glucose (7) and amino acid metabolism (8, 9) for IUGR fetuses compared to appropriately grown fetuses, and that the magnitude of these changes tracks with the clinical severity of IUGR. More recently we have shown that severity of IUGR determines differences in perinatal outcome (10) as have others (11). In previous studies, we included only antenatally diagnosed IUGR who were also small for gestational age at birth. The present study was suggested by the observation of discrepancies between the diagnosis of growth restriction made in utero and the neonatal classification of birthweight based upon population based standards. Thus, the aim of this study was to evaluate the obstetrical and neonatal outcome of infants with a clear-cut diagnosis of IUGR both by reduced fetal size and by the presence of abnormal fetal velocimetry of the umbilical artery.
Methods
The study was performed in the Department of Obstetrics and Gynecology of the University of Milano, Department of Medicine, Surgery, Dentistry San Paolo, Italy. The study was exempt from Institutional Review Board approval since obstetric and neonatal outcomes were collected as part of the clinical management. The privacy of all patients was warranted.
We collected maternal and neonatal outcomes in 53 consecutive singleton pregnancies complicated by intrauterine growth restriction (IUGR) and abnormal pulsatility index who delivered between 280 and 336 weeks of pregnancy and were followed prospectively until discharge from the High Risk Pregnancy Unit of the Department of Obstetric and Gynecology of the San Paolo Hospital between 1996 and 2002. Gestational age at delivery was calculated by the last menstrual period and confirmed by an ultrasound examination performed within 20 weeks. We utilized a classification of clinical severity previously proposed (5) which was based upon pulsatility index (PI) of the umbilical artery and on the fetal heart rate (FHR) recording. Only severe IUGR cases were included, i.e. cases with PI of the umbilical artery measured by Doppler velocimetry ≥2 SD of reference normal values. 22 IUGR pregnancies were classified as Group 2 with abnormal PI and normal FHR and 31 as Group 3 with abnormal PI and FHR.
The diagnosis of IUGR was determined by ultrasonic measurement of the abdominal circumference (AC) according to standards previously published for this population (12): the criteria were an abdominal circumference <10th percentile or a reduction of 40 percentiles in two consecutive measurements (13). Only livebirths without malformations or abnormal karyotypes were included.
Umbilical arterial PI was measured within 24 hours from delivery according to the simplified Gosling formula (systolic velocity minus diastolic velocity divided by mean velocity); the mean velocity was calculated by dividing the area of the maximal velocity by the length of the cycle. The reference values were those obtained in our laboratory from a cross-sectional study of 440 normal fetuses (14).
The fetal heart rate was recorded within 24 hours from birth. The tracings were examined independently by two investigators who did not know the results of Doppler velocimetry. A tracing was considered abnormal if at least one of the following patterns was present: less than two accelerations of the heart rate to an amplitude of ≥10 beats per minute lasting ≥15 seconds during a period of at least 30 minutes; variability of ≤5 beats per minute during a period of at least 60 minutes; and U-shaped (late) decelerations in the heart rate after Braxton Hicks contractions (5).
We analyzed maternal data including age, height, weight, body mass index (BMI) parity, preexisting medical or obstetrical problems and complications of pregnancy (such as gestational hypertension/preeclampsia, gestational diabetes mellitus, placenta previa/placental abruption, previous stillbirth or IUGR).
Neonatal outcome was analyzed immediately after birth in terms of Apgar score at 1′ and 5′, and the requirement for mechanical ventilation and admission to the NICU. At the time of discharge, data were collected on neonatal morbidity and mortality. Major morbidity included: respiratory distress syndrome (RDS), intra ventricular hemorrhage (IVH), retinopathy of prematurity (ROP), sepsis, necrotizing enterocolitis (NEC) and disseminated intravascular coagulopathy (DIC). Minor morbidity included: hypoglycemia, jaundice, anemia. The presence of pulmonary dysplasia, retinopathy stage ≥3 and neurologic sequelae at the time of discharge were recorded. Neonatal mortality was defined as the death rate within the first 28 days of life.
In addition, neonatal ponderal index (NPI) and body mass index (BMI) were calculated as follows: NPI=100*[birth weight (gr)/length (cm)3]; BMI=birthweight (kg)/length (m)2. The brain body weight ratio (BBR) was defined as 100 × the ratio of the infant’s estimated brain weight to its birth weight. Brain weight was estimated from the formula: brain weight (g) = 0.037 × head circumference (cm)2.57, which is derived from the National Institute of Neurological and Communicative Disorders and Stroke’s Collaborative Perinatal Project (15). Thus, BBR was calculated as = 100 × [0.037 × head circumference (cm)2.57]/birth weight (g).
The data collected in IUGR pregnancies were compared with those collected in 79 singleton pregnancies, similarly selected with normal intrauterine fetal growth and PI matched for gestational age (range 28 – 33.6), whose birthweight was appropriate for gestational age (AGA group).
Results are reported as mean ± standard deviation (SD). The χ2 test and, when appropriate, the Student’s t test, have been used to evaluate differences in maternal and fetal/neonatal characteristics. ANCOVA test was performed to assess differences between means corrected for gestational age in the different groups [AGA, IUGR as a whole, IUGRAGA and IUGRSGA]. P values <0.05 were considered significant. Data was analysed using stata9 (Stata Corp., College Station, Texas, USA).
Results
Table 1 shows that at the time of delivery, when utilizing the Italian birthweight/gestational age neonatal standards (16), 25/53 (47%) IUGR showed a birthweight above the 10th percentile and were classified appropriate for gestational age (IUGRAGA) whereas in the remaining 28, birthweight was <10° percentile (IUGRSGA). In other words, 9/22 newborn of Group 2 and 16/31 of Group 3 exhibited a birthweight >10th percentile [IUGRAGA] whereas 13/22 in Group 2 and 15/31 in Group 3 had a birthweight below the 10th percentile [IUGRSGA]. The mean percent reduction in birthweight from the 50th percentile was 47.6 ± 9.6% in IUGRSGA and 23.6 ± 6.4% in IUGRAGA (p<0.001).
Table 1.
Study population of IUGR fetuses with abdominal circumference <2SD and pulsatility index of the umbilical artery ≥2 SD
| Group 2 = FHR normal | Group 3 = FHR abnormal | Total | |
|---|---|---|---|
| Birthweight <10° percentile: IUGRSGA | 13 | 15 | 28 |
| Birthweight >10° percentile: IUGRAGA | 9 | 16 | 25 |
| Total | 22 | 31 | 53 |
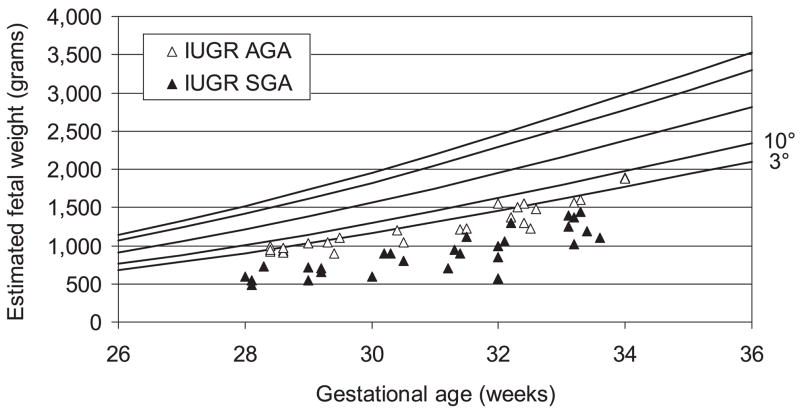
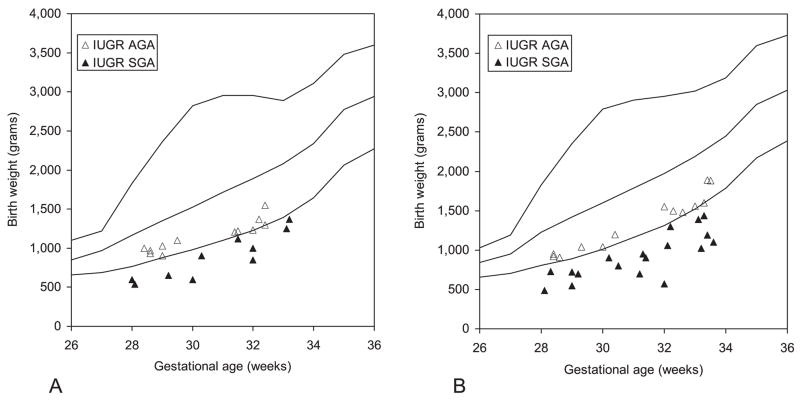
Figure 1 presents the distribution of birthweight in IUGR fetuses plotted on the reference standards for intrauterine growth (12). It is important to note that all of these infants had a birthweight <10th percentile and 70% (37/53) were <3rd percentile. The selection criteria required that all of these infants also had abnormal umbilical artery velocimetry findings. The same data are plotted in Figure 2 which incorporates the reference male and female neonatal birthweight/gestational age standards for the Italian population (16).
Figure 1.
Ultrasound estimated fetal weight of intrauterine growth-restricted (IUGR) pregnancies plotted on the fetal curve of intrauterine growth. AGA, Appropriate for gestational age; SGA, small for gestational age.
Figure 2.
Birthweight of intrauterine growth-restricted (IUGR) pregnancies plotted on the neonatal curve of intrauterine growth for females (A) and males (B). AGA, Appropriate for gestational age; SGA, small for gestational age.
The AC was the principal fetal measurement upon which the diagnosis of IUGR was made. The diagnosis in utero received additional confirmation by the fact that all infants in the study also had abnormal umbilical artery velocimetry findings.
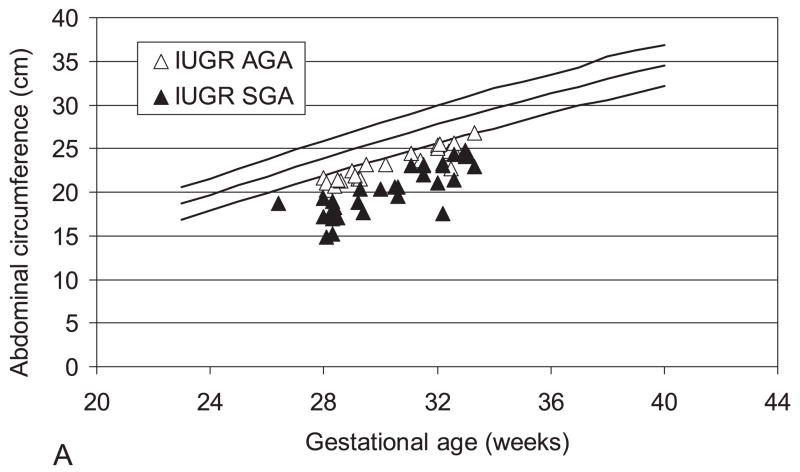
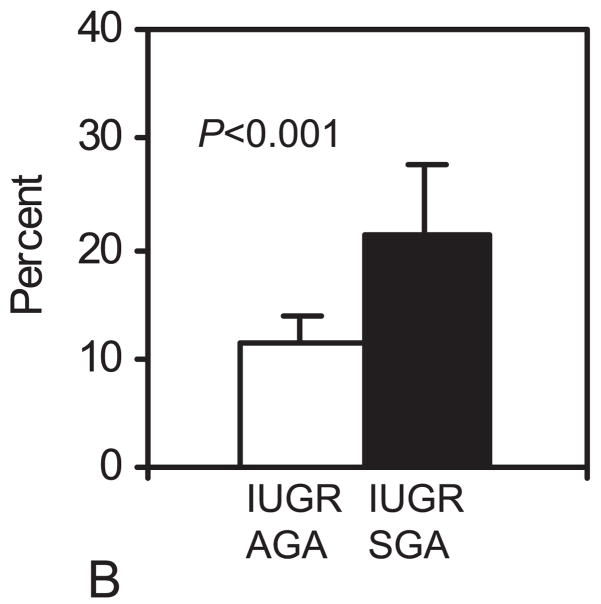
Figure 3 presents the abdominal circumference data measured by ultrasound within 7 days from delivery. All IUGR infants were below the 10th percentile. The mean ± SD percent reduction of the AC compared to the 10th percentile of the reference values (12) was significantly higher in the IUGRSGA (21.1 ± 5.8%) when compared to the IUGRAGA (11.3 ± 2.8%; p<0.001).
Figure 3.
A. Fetal abdominal circumference measured with ultrasound within 7 days from delivery. B: The bar graph shows the mean ± SD percent reduction of the AC compared to the 50° percentile. AGA, Appropriate for gestational age; IUGR, intrauterine growth restricted; SGA, small for gestational age.
Table 2 presents maternal age, height, pre-pregnancy weight, body mass index (BMI) and weight increase in pregnancy of AGA and IUGR mothers. No differences were present in any of these variables. It is worth noting that all IUGRAGA mothers were primigravid (p<0.001 both vs AGA and IUGRSGA).
Table 2.
Maternal age, height, pre pregnancy weight, BMI, weight increase in pregnancy and number of AGA and IUGR mothers at their first pregnancy (mean ± SD)
| Age (years) | Height (cm) | Pre pregnancy weight (kg) | BMI | Weight increase (kg) | Caucasian (%) | Gravida 1 (%) | |
|---|---|---|---|---|---|---|---|
| AGA N=79 | 30.6 ± 5.2 | 162.3 ± 6.1 | 60 ± 13.5 | 23 ± 5.8 | 9.2 ± 4.8 | 66* (13) | 34 (43) |
| IUGR | 31.4 ± 5 | 161.8 ± 6.9 | 58.1 ± 7.9 | 22.2 ± 3.2 | 9.8 ± 4.5 | 52 (98.1) | 18 (34) |
| IUGRAGA N=25 | 31.4 ± 4.4 | 163 ±7.3 | 58.4 ± 8.2 | 22 ± 3.3 | 10.7 ±3.8 | 25 (100) | 25§ (100) |
| IUGRSGA N=28 | 31.3 ± 5.5 | 159.7 ± 5.7 | 57.7 ± 7.7 | 22.7 ± 3.1 | 8.9 ± 5.2 | 27 (96.4) | 18 (64.3) |
p<0.03 vs IUGRAGA;
p<0.001 vs AGA and IUGRSGA
The number of women who started their pregnancy as low risk (absence of familial, personal or obstetric pathologies) was 47/79 in the AGA group, 14/25 in the IUGRAGA group, and 16/28 in the IUGRSGA group (p=0.8). During pregnancy, 50/79 control AGA mothers had no pathology other than premature labor or preterm premature rupture of the membranes (PPROM) compared to 10/53 IUGR mothers (5 IUGRAGA and 5 IUGRSGA; p<0.001).
On the contrary, the incidence of hypertensive disorders was significantly higher in IUGR (35/53) than in AGA (13/79; p<0.001) mothers: a difference which persisted when the individual IUGR groups were considered (19/25 IUGRAGA; 16/28 IUGRSGA). Among multiparas, a previous stillbirth or IUGR was present in 6/19 IUGR vs 3/28 AGA pregnancies (p=0.1).
Table 3 presents the gestational age, birthweight, placental weight, fetal/placental weight ratio, neonatal length, head circumference, ponderal index, body mass index and brain body weight ratio in AGA and IUGR for the IUGR group as a whole and subdivided into the birthweight-related groups. Gestational age was significantly higher in controls (p<0.003): when corrected for gestational age BBR and F/P ratio were significantly lower in AGA vs IUGR whereas all other parameters were significantly higher in AGA compared to IUGR. Similarly, all body size measurements were also greater for AGA compared to the IUGR groups separately. These measurements included birthweight, placental weight, neonatal length, head circumference and neonatal PI and BMI which were significantly higher in AGA than in IUGRAGA and IUGRSGA whereas again BBR and F/P were significantly lower in AGA.
Table 3.
Gestational age, birthweight, placental weight, F/P ratio, neonatal length, head circumference, neonatal ponderal index (PI), body mass index (BMI) and brain body weight ratio (BBR) in AGA and IUGR (values are mean ± SD)
| Gestational age (weeks) |
Birthweight (grams) |
Placental weight (grams) |
F/P (n=43) | Length (cm) |
Head circumference (cm) |
Neonatal PI |
Neonatal BMI |
BBR | |
|---|---|---|---|---|---|---|---|---|---|
| AGA N=79 | 32 ± 1.7 | 1876 ± 461 | 440 ± 93 | 4.6 ± 1.4 | 42.1 ± 3.9 | 29.9 ± 2.9 | 2.6 ± 0.9 | 10.7 ± 2.4 | 12.8 ± 3.5 |
| IUGR | 31 ± 1.8 | 1070 ± 338 | 213 ± 73 | 5.3 ± 2 | 37.3 ± 4.8 | 27.3 ± 3 | 2.1 ± 0.4 | 7.7 ± 1.5 | 18.4 ± 8.6 |
| IUGRAGA N=25 | 31 ± 1.9 | 1253 ± 302 | 243 ± 70 | 5.6 ± 2.1 | 38.9 ±2.7 | 27.7 ± 2 | 2.2 ± 0.3 | 8.4 ± 1.2 | 15.1 ± 2.1 |
| IUGRSGA N=28 | 31 ± 1.9 | 907 ± 284 | 183 ±65 | 5.1 ± 1.8 | 35.8 ± 5.7 | 26.9 ± 3.7 | 2 ± 0.5 | 7.1 ± 1.5 | 21.4 ± 11 |
| AGA vs IUGR | P<0.003 | −3.72 P<0.0001 | −9.55 P<0.001 |
3.55 P<0.001 |
−4.97 P<0.0001 |
−3.66 P<0.0001 |
−3.66 P<0.0001 |
−8.37 P<0.0001 |
4.46 P<0.0001 |
| AGA vs IUGRAGA | P<0.01 | −7.73 P<0.0001 |
−7.31 P<0.0001 |
3.17 P<0.002 |
−2.24 P<0.03 |
−2.23 P<0.03 |
−2.43 P<0.02 |
−4.89 P<0.0001 |
1.31 P=0.2 |
| AGA vs IUGRSGA | P<0.003 | −15.07 P<0.0001 |
−8.8 P<0.0001 |
2.64 P<0.01 |
−5.91 P<0.0001 |
−3.62 P<0.0001 |
−3.41 P<0.001 |
−9.02 P<0.0001 |
6.18 P<0.0001 |
| IUGRAGA vs IUGRSGA | P=0.8 | 32.3 P<0.0001 |
3.03 P<0.09 |
0.10 P=0.8 |
8.81 P<0.004 |
1.19 P=0.3 |
0.56 P=0.5 |
10.8 P<0.001 |
15.8 P<0.0001 |
P values are corrected for gestational age (ANCOVA)
Among IUGR, birthweight, placental weight, neonatal length and neonatal BMI were significantly higher in IUGRAGA than in IUGRSGA whereas BBR was significantly increased in IUGRSGA, whilst we found no differences in placental weight, F/P, head circumference and neonatal PI.
Forty-seven out of 79 AGA mothers delivered by cesarean section compared to 53/53 IUGR (p<0.001). In most IUGR pregnancies (85%) cesarean section was performed for fetal indication.
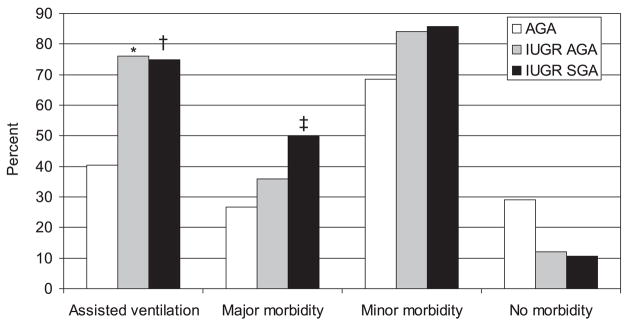
Twenty-nine out of 79 AGA newborns had a 5 minutes Apgar score ≤7 when compared to 35/53 IUGR (p<0.001): no differences were present between IUGR groups (16/25 IUGRAGA and 19/28 IUGRSGA; p=0.8). The number of newborns requiring assisted ventilation was significantly higher in the IUGR group when compared to the AGA (75.5% vs 40.5%; p<0.001) with no differences between IUGRs (Figure 4). The number of fetuses receiving antenatal corticosteroids was significantly higher in IUGR (51/53 vs 23/79; p<0.001) as was the number of neonates receiving surfactant after delivery (49/53 vs 50/79; p<0.001).
Figure 4.
Percentage of newborns who required assisted ventilation at birth and who developed major, minor or no morbidity in the neonatal period. * p<0.01 AGA vs IUGRAGA; † p<0.003 and ‡ p<0.02 AGA vs IUGRSGA. AGA, Appropriate for gestational age; IUGR, intrauterine growth restricted; SGA, small for gestational age.
Forty-nine out of 79 AGA and 49/53 IUGR were admitted to the NICU (p<0.001). 1/79 AGA and 6/53 IUGR newborns (1 IUGRAGA and 5 IUGRSGA) died within 28 days from delivery (p<0.02). Neonatal major and minor morbidity is presented in Figure 4. More than one third of the control AGA and 23/53 IUGR newborns had major complications whereas 68.4% AGA had minor complications when compared to 85% IUGR newborns: none of these differences was significant when corrected for gestational age. Similarly, no differences were present in the individual IUGR groups. Only 6/53 IUGR had no postnatal complications when compared to 23/79 AGA. Pulmonary dysplasia, ROP ≥stage 3 and neurologic sequelae at the time of discharge were present in 5/79 AGA and 7/53 IUGR (ns).
Discussion
This paper presents the obstetrical and neonatal outcome in IUGR pregnancies diagnosed utilizing intrauterine fetal growth curves and velocimetry without regard to the neonatal growth curves. The study clearly demonstrates that neonatal morbidity and mortality are similar in IUGR of the same clinical severity, whether or not they could be defined appropriate or small for gestational age according to the neonatal growth standards.
The issue of whether fetal or neonatal growth curves should be used when assessing weight at birth has been addressed by other authors (17, 18). Zaw et al (19) have shown that fetal growth standards are better in identifying infants at increased risk of respiratory morbidity and intraventricular hemorrhage among preterm SGA infants, compared to neonatal standards. Similarly, Clausson et al (20) have shown that the use of customised birthweight standards increases identification of fetuses at risk of stillbirth, neonatal death and Apgar score <4 at 5 minutes when compared with population-based birthweight standards.
However, we have reviewed the literature using PubMed restricted to English language from 1970 to May 2008, using the key words “intrauterine growth charts, neonatal growth charts, abnormal doppler, fetal growth restriction, and fetal biometry” and were unable to find any other studies which had the dual characteristics of (1) a prospective study of IUGR and (2) met the stringent requirements of diagnosis of IUGR was made in utero based upon both fetal growth and the presence of abnormal velocimetry and related these cases to neonatal outcome. Furthermore, to avoid growth restriction based solely upon biometry which could have included “normal small” babies, we have included in our study only fetuses with abnormal pulsatility index of the umbilical artery, i.e. the more severe, as we have shown previously (5, 10, 21). These dual criteria should have avoided the interference of potential confounding factors such as maternal height, weight, ethnicity, parity and newborn’s gender (4). In our study, as in Zaw’s (19), there was a large birthweight difference between fetal and neonatal growth standards. This finding is strengthened by the fact that we have used standards developed for our population both for intrauterine growth (12) and for neonatal growth (16).
It is well recognized that the assessment of fetal growth is a fundamental component of good antenatal as well as postnatal care due to its consequences for perinatal outcome (1) and adult health (22). It is now acknowledged that there are ethnic differences that should be taken into account when analyzing perinatal outcomes (4). Also the issue of whether customized versus population based growth curves should be used (17) has been debated. The customized growth standards are useful in taking into account all known constitutional factors affecting growth in individual fetuses. But both of these effects are minor when one utilizes both fetal biometry and fetal velocimetry data.
This study highlighted several facts: first – there were no relevant pre-pregnancy differences for mothers in the control AGA group compared with those in the IUGR groups; more than half in each group started pregnancy considered at low risk. On the other hand, most IUGR mothers developed hypertension in pregnancy with no differences between IUGRAGA and IUGRSGA mothers.
The second observation is that we did not find significant differences in neonatal outcome between AGA and IUGR infants, most likely due to two factors: a) that IUGR fetuses were followed prospectively and delivered to minimize morbidity and mortality (23) and b) that AGA infants were gestational age matched and thus were preterm infants with significant morbidity and mortality. The differences in morbidity and mortality are mainly due to IUGRSGA. All IUGR fetuses of Group 2 and three AGA fetuses exhibited abnormal umbilical pulsatility index measurements of the umbilical artery. In addition, as shown in Table 3, they had birthweights, placental weights, neonatal length, head circumference, ponderal index, body mass index which were significantly lower and fetal/placental weight ratios and brain-body weight ratio which were significantly higher than AGA fetuses whose intrauterine growth was normal. Also, they required NICU admission more frequently than fetuses with normal intrauterine growth.
The issue of whether perinatal outcome is different in preterm AGA when compared to SGA has been debated for many years. However, as reported above, only recently the question of the growth standards to be used in comparing different populations and the criteria for diagnosis of intrauterine growth restriction prenatally has begun to be addressed. The results of the present prospective study are in agreement with the results of larger retrospective studies (3, 19) in showing not only that IUGR increases perinatal morbidity and mortality, but also that perinatal outcome is correlated to the degree of clinical severity (10). It also reinforces the conclusion that neonatal birthweight/gestational age percentile curves are misleading in detecting low birthweight infants and should be utilized only when obstetrical data are unavailable. The results of the present study also point out the need of a truly perinatal approach (i.e. joint obstetrical and neonatal approach) in the clinical management of these patients if optimal medical care is to be provided.
Acknowledgments
Supported by NIH Grant 5 RO1 HD034837 08, Fetal Velocimetry & Amino Acid Transport in Pregnancy and Grant number MO1 RR00069, General Clinical Research Centers Program, National Centers for Research Resources, NIH and by the Association for Study of Malformations (ASM).
Footnotes
Financial Disclosure: The authors have no potential conflicts of interest to disclose.
Presented in part at the Annual Meeting of the Pediatric Academic Societies, San Francisco, CA, May 1 – 4, 2004.
References
- 1.McIntire DD, Bloom SL, Casey BM, Leveno KJ. Birth weight in relation to morbidity and mortality among newborn infants. N Engl J Med. 1999;340:1234–8. doi: 10.1056/NEJM199904223401603. [DOI] [PubMed] [Google Scholar]
- 2.Piper JM, Xenakis EM, McFarland M, Elliott BD, Berkus MD, Langer O. Do growth-retarded premature infants have different rates of perinatal morbidity and mortality than appropriately grown premature infants? Obstet Gynecol. 1996;87:169–74. doi: 10.1016/0029-7844(95)00400-9. [DOI] [PubMed] [Google Scholar]
- 3.Garite TJ, Clark R, Thorp JA. Intrauterine growth restriction increases morbidity and mortality among premature neonates. Am J Obstet Gynecol. 2004;191:481–7. doi: 10.1016/j.ajog.2004.01.036. [DOI] [PubMed] [Google Scholar]
- 4.Bukowski R. Fetal growth potential and pregnancy outcome. Semin Perinatol. 2004;28:51–58. doi: 10.1053/j.semperi.2003.12.003. [DOI] [PubMed] [Google Scholar]
- 5.Pardi G, Marconi AM, Cetin I, Lanfranchi A, Bozzetti P, Ferrazzi E, et al. Diagnostic value of blood sampling in fetuses with growth retardation. New Engl J Med. 1993;328:692–696. doi: 10.1056/NEJM199303113281004. [DOI] [PubMed] [Google Scholar]
- 6.Marconi AM, Paolini CL, Zerbe G, Battaglia FC. Lactacidemia in intrauterine growth restricted (IUGR) pregnancies: relationship to clinical severity, oxygenation and placental weight. Pediatr Res. 2006;59:570–574. doi: 10.1203/01.pdr.0000205477.70391.3e. [DOI] [PubMed] [Google Scholar]
- 7.Marconi AM, Paolini CL, Buscaglia M, Zerbe G, Battaglia FC, Pardi G. The impact of gestational age and of fetal growth upon the maternal-fetal glucose concentration difference. Obstet Gynecol. 1996;87:937–942. doi: 10.1016/0029-7844(96)00048-8. [DOI] [PubMed] [Google Scholar]
- 8.Marconi AM, Paolini CL, Stramare L, Cetin I, Fennessey PV, Pardi G, et al. Steady state maternal fetal leucine enrichments in normal and intrauterine growth restricted pregnancies. Pediatr Res. 1999;46:114–119. doi: 10.1203/00006450-199907000-00019. [DOI] [PubMed] [Google Scholar]
- 9.Paolini CL, Marconi AM, Ronzoni S, Di Noio M, Fennessey PV, Pardi G, et al. Placental transport of leucine, phenylalanine, glycine and proline in intrauterine growth-restricted pregnancies. J Clin Endocrinol Metab. 2001;86:5427–5432. doi: 10.1210/jcem.86.11.8036. [DOI] [PubMed] [Google Scholar]
- 10.Marconi AM, Ronzoni S, Vailati S, Bozzetti P, Pardi G, Battaglia FC. Neonatal morbidity and mortality in intrauterine growth restricted (IUGR) pregnancies according to clinical severity. Pediatr Res. 2004;55:476A. doi: 10.1177/1933719108327591. [DOI] [PubMed] [Google Scholar]
- 11.Baschat AA, Cosmi E, Bilardo CM, Wolf H, Berg C, Rigano S, et al. Predictors of Neonatal Outcome in Early-Onset Placental Dysfunction. Obstet Gynecol. 2007;109:253–61. doi: 10.1097/01.AOG.0000253215.79121.75. [DOI] [PubMed] [Google Scholar]
- 12.Todros T, Ferrazzi E, Groli C, Nicolini U, Parodi L, Pavoni M, et al. Fitting growth curves to head and abdomen measurements of the fetus: a multicentric study. J Clin Ultrasound. 1987;15:95–105. doi: 10.1002/jcu.1870150203. [DOI] [PubMed] [Google Scholar]
- 13.ACOG practice bulletin: Intrauterine growth restriction. N 12, January 2000
- 14.Ferrazzi E, Gementi P, Bellotti M, Rodolfi M, Della Peruta S, Barbera A, et al. Doppler velocimetry: critical analysis of umbilical, cerebral and aortic reference values. Eur J Obstet Gynecol Reprod Biol. 1991;38:189–96. doi: 10.1016/0028-2243(91)90290-2. [DOI] [PubMed] [Google Scholar]
- 15.McLennan JE, Gilles FH, Neff RK. A model of growth of the human fetal brain. In: Gilles FH, Leviton A, Dooling EC, editors. The developing human brain: growth and epidemiologic neuropathy. Boston, MA: Wright P G; 1983. pp. 43–58. [Google Scholar]
- 16.Parazzini F, Cortinovis I, Bortolus R, Fedele L. Standard di peso alla nascita in Italia. Ann Ost Gin Med Perin. 1991;CXII:203–246. [PubMed] [Google Scholar]
- 17.Gardosi J. Ethnic differences in fetal growth. Ultrasound Obstet Gynecol. 1995;6:73–74. doi: 10.1046/j.1469-0705.1995.06020073.x. [DOI] [PubMed] [Google Scholar]
- 18.Cooke RW. Conventional birth weight standards obscure fetal growth restriction in preterm infants. Arch Dis Child Fetal Neonatal Ed. 2007;92:F189–192. doi: 10.1136/adc.2005.089698. [DOI] [PMC free article] [PubMed] [Google Scholar]
- 19.Zaw W, Gagnon R, da Silva O. The Risks of Adverse Neonatal Outcome Among Preterm Small for Gestational Age Infants According to Neonatal Versus Fetal Growth Standards. Pediatrics. 2003;111:1273–1277. doi: 10.1542/peds.111.6.1273. [DOI] [PubMed] [Google Scholar]
- 20.Clausson B, Gardosi J, Francis A, Cnattingius S. Perinatal outcome in SGA births defined by customised versus population based birthweight standards. Br J Obstet Gynaecol. 2001;108:830–834. doi: 10.1111/j.1471-0528.2001.00205.x. [DOI] [PubMed] [Google Scholar]
- 21.Ferrazzi E, Bozzo M, Rigano S, Bellotti M, Morabito A, Pardi G, et al. Temporal sequence of abnormal doppler changes in the peripheral and central circulatory systems of the severely growth-restricted fetus. Ultrasound Obstet Gynecol. 2002;19:140–146. doi: 10.1046/j.0960-7692.2002.00627.x. [DOI] [PubMed] [Google Scholar]
- 22.Barker DJ. Adult consequences of fetal growth restriction. Clin Obstet Gynecol. 2006;49:270–83. doi: 10.1097/00003081-200606000-00009. [DOI] [PubMed] [Google Scholar]
- 23.The GRIT study group. Infant wellbeing at 2 years of age in the Growth Restriction Intervention Trial (GRIT): multicentred randomised controlled trial. Lancet. 2004;364:513–20. doi: 10.1016/S0140-6736(04)16809-8. [DOI] [PubMed] [Google Scholar]


