

Abstract
Increasing evidence supports a role for CD8+ T cells in multiple sclerosis. In an attempt to isolate the contribution of CD8+ T cells in a murine model of MS, we immunized mice with a dominant CD8 epitope MOG37-46, a truncated version of MOG35-55. The data presented here show mild disease induced with MOG37-46, characterized by lower clinical scores, a decrease in CNS infiltration and a decrease in microglial activation. CD8+ T cells reactive to MOG37-46 are pro-inflammatory and traffic to the CNS; however, the presence of CD4+ T cells elicit more severe disease and sustained inflammation of the CNS.
Keywords: T cell, central nervous system, experimental autoimmune encephalomyelitis, myelin oligodendrocyte protein
1. Introduction
Multiple sclerosis (MS) is a chronic debilitating disease characterized by inflammation of the CNS with subsequent demyelination and axon damage. The origins of disease are largely unknown; however, findings obtained from mouse models and the successes of immuno-targeted therapies in human patients provide evidence for an immune component of disease. All arms of the immune system, including CD4+ and CD8+ T cells, B cells, and myeloid cells have been implicated in contributing to demyelinating symptoms (De Jager and Hafler; Hemmer et al.). Recently, attention has shifted towards the previously underappreciated contribution of CD8+ T cells to the pathogenesis of the disease. This was prompted by studies in human patients revealing HLA class I gene association with MS, infiltration of oligoclonally expanded CD8+ T cells in CNS lesions, and increased frequency and cytotoxicity of these cells in MS patients (Babbe et al.; Skulina et al.; Zang et al.). CD8+ T cells can directly recognize antigens on the surface of cells of the central nervous system, since neurons and oligodendrocytes can express MHC class I on their surface, and the levels of MHC molecules are upregulated during inflammation (Galea et al., 2007; Giuliani et al.; Jurewicz et al.; Kawai and Zweiman; Redwine et al.).
Interestingly, a regulatory population of cytotoxic CD8+ T cells has also been identified in MS patients. These CD8+ T cells were shown to target CD4+ T cells obtained from the periphery of glatiramer acetate treated MS patient and are associated with a reduced relapse rate and progression of disability (Karandikar et al., 2002; Tennakoon et al.). Due to these conflicting findings, it is unknown to what degree CD8+ T cells contribute to disease and whether they possess a predominantly effector or regulatory role.
Given the recent focus on the role of CD8+ T cells in multiple sclerosis, there is a need for animal models that can be utilized to study the function of CD8+ T cells in autoimmune demyelination and to develop novel therapies that would target CD8+ T cell function. Initial studies conducted in the murine model of MS, experimental autoimmune encephalomyelitis (EAE), were largely centered on the role of CD4+ T cells in disease. EAE is an inducible model of CD4+ T cell driven demyelination and axon damage. Myelin antigen reactive CD4+ T cells dominate the CNS infiltrate and can initiate disease upon adoptive transfer into naïve animals (Ben-Nun et al.; Mokhtarian et al.; Yura et al.). However, CD8+ T cells and macrophages are also recruited into the CNS in this model. Reports from our laboratory and others have identified two CD8+ epitopes, MOG37-46 and MOG44-54, within the immunizing MOG35-55 peptide that is used for disease induction in H-2b mouse model (Fig. 1)(Ford and Evavold, 2005; Sun et al., 2003). Immunization with either epitope or transfer of activated CD8+ T cells specific for each epitope can induce disease symptoms (Ford and Evavold, 2005; Sun et al., 2003). In the same model, several groups reported the presence of regulatory CD8+CD28- and CD8+CD122+ cells (Lee et al.; Najafian et al.). Therefore, it is possible that there are two types of CD8+ T cells present during autoimmune responses: regulatory and pathogenic.
Fig. 1. Mapping of CD4+ and CD8+ epitopes within the dominant MOG35-55 epitope in the C57BL/6 model of EAE.

The core CD4+ epitope MOG40-48 was initially identified by Mendel et. al.(Mendel et al., 1996). The two core CD8+ epitopes were described by Sun et. al. and our laboratory (Sun et al., 2003: Ford, 2005 #54).
This study has focused on further delineating the role of MOG-reactive CD8+ T cells in the B6 model of EAE. We have expanded our characterization of MOG37-46 reactive CD8+ T cells, and identified it as a dominant CD8+ epitope in the MOG35-55 response. We have employed both the adoptive transfer induction of disease, as well as immunization with MOG37-46, the truncated MOG35-55 epitope containing just the CD8+ epitope, to induce CD8+ driven disease. Our findings support a pro-inflammatory rather than regulatory role for MOG-reactive CD8+ T cells; however, these MOG37-46 reactive T cells have low avidity for their peptide:MHC complex and respond to antigen only at high concentrations. Therefore, the CD8+ T cell response to MOG does appear as a component of the effector response attacking the CNS in MOG induced EAE, but may need additional support to propagate ongoing inflammation and more severe disease.
2. Methods
2.1. Mice
Female C57BL/6 mice and CD8−/− mice were purchased from Jackson Laboratories (Bar Harbor, ME). Mice were housed in the Emory University Department of Animal Resources facility and used at 5–8 weeks of age.
2.2. Peptides and rMOG protein
Peptides were synthesized using 9-fluorenylmethoxycarbonyl chemistry on a Prelude Symphony/Multiplex Peptide Synthesizer and were analyzed by HPLC (Rainin Instruments) and mass spectrometry. Peptide sequences are as follows: MOG35-55, MEVGWYRSPFSRVVHLYRNGK; MOG37-46, VGWYRSPFSR; MOG44-54, FSRVVHLYRNG, and GP33-43, KAAYNFATCGI. The plasmid containing His-tagged mouse rMOG residues 1–116 was a kind gift of Dr. Stephen Anderton (Fillatreau et al., 2002), and was expressed in Origami DE3 cells and purified according to manufacturer's instructions (Novagen, Madison, WI).
2.3. Cells and reagents
MOG-specific and GP33-43 specific T cell lines were generated by priming B6 mice with 200 µg peptide or rMOG protein emulsified in CFA containing 0.5 mg/ml Mycobacterium tuberculosis (H37 RA; Difco, Detroit, MI). Popliteal and inguinal lymph nodes were harvested on day 10 after priming, and 5×10⁶ lymph node cells per well in a 24 well plate were incubated with 1 µM MOG35-55, 10 µM MOG37-46, 10 µM MOG44-54 or 10 nM GP33-43, and supplemented with 10 ng/ml IL-2 for 7 days, unless indicated otherwise. Live cells were then restimulated under the same conditions for another week before using cells in stimulation experiments. Culture media consisted of RPMI medium 1640 supplemented with 10% FBS (Mediatech, Herndon, VA), 2 mM L-glutamine, 10 mM Hepes buffer, 100 µg/ml gentamicin (Mediatech), and 2×10⁻⁵ M 2-mercaptoethanol (Sigma, St. Louis, MO). For isolation of CNS infiltrating mononuclear cells, mice were either anesthetized with Avertin (Sigma) and perfused with approximately 30 ml of PBS through the left ventricle or bled via heart puncture immediately after sacrifice. After perfusion, brain and spinal cord tissue was surgically removed. CNS tissue was dissociated to obtain a single cell suspension, resuspended in 10 ml of 30% Percoll, and underlaid with 70% Percoll (Sigma). The cells were centrifuged at 2500 rpm for 20 min at room temperature. Cells at the interface were collected and washed once with PBS.
2.4. EAE induction
EAE was induced by immunization of female B6 mice with 100 µg MOG35-55 or MOG37-46 peptides emulsified in 100µL CFA containing 2.5 mg/ml Mycobacterium tuberculosis on days 0 and 7 subcutaneously in the hind flank (Mendel et al.). Mice also received 250 ng of pertussis toxin i.p. on days 0 and 2. Disease severity was monitored according to the following scale: 0, no disease; 1, flaccid tail; 2, hind limb weakness; 3, hind limb paralysis; 4, forelimb weakness; 5, moribund.
For adoptive transfer induction of EAE, B6 mice were immunized with MOG35-55 in footpads and draining lymph nodes were harvested as described above. Lymph node cells were cultured in vitro with 1 µM MOG35-55 and IL-2 for 1 week. Live CD4+ and CD8+ T cells were positively selected using magnetic anti-CD4+ or anti-CD8+ microbeads (Miltenyi Biotec, Germany) per manufacturer's instructions and activated for another 2 days with irradiated splenocytes and 1 µM MOG35-55 for CD4+ T cell activation or 10 µM MOG37-46 for CD8+ T cell activation. The purity of enriched populations was assessed by flow cytometry; the contaminating CD4+ T cell population was below 1%. CD4+ or CD8+ T cells (5×10⁶ of each) were adoptively transferred intravenously into wild type recipients on day 0. Mice also received 250 ng pertussis toxin i.p. on days 0 and 2.
2.5. Intracellular cytokine staining
Cultured splenocytes from primed mice (5×10⁵ per well) were incubated with 100 µM peptide, CFSE labeled splenocytes as an APC source (CFSE staining allowed for easy differentiation between cultured T cells and APC splenocytes), and 10 µg/ml Brefeldin A. After 5 hours, cells were processed using an intracellular staining kit (Caltag, San Diego, CA) and stained with antibodies to surface CD8 or CD4 and intracellular IFNγ, TNFα, and IL-2 (BD Bioscience, San Jose CA). Flow cytometry was performed on a BD FACSCalibur and data were processed using FlowJo software (Tree Star, San Carlos, CA). Data are gated on CD8+ or CD4+ T cells. APC population was gated out of the analysis based on CFSE staining.
2.6. IFNγ ELISA
Lymph node derived cell lines from primed mice (1×10⁵/well in 96 well plate) were incubated with EL4 cell line as an H-2Db expressing APC source (5×10⁵) with the indicated concentrations of peptide. IFNγ was measured by ELISA using anti-IFNγ antibody pair from BD Bioscience. Captured cytokines were detected using alkaline phosphatase-conjugated avidin (Sigma) and p-nitrophenylphosphate substrate (Bio-Rad, Hercules, CA). Colorometric change was measured at 405nm on a Microplate Autoreader (Biotek Instruments).
2.7. Statistical analyses
Statistical analyses were conducted using GraphPad Prism (Software for Science).
3. Results
3.1. MOG35-55 CD8+ T cell response is dominated by MOG37-46 specific CD8+ T cells
Immunization with MOG35-55 results in the generation of MOG-reactive CD4+ and CD8+ T cells. Our laboratory has identified MOG37-46 as a CD8 core epitope within MOG35-55 (Ford and Evavold, 2005; Ford and Evavold, 2006); yet, another CD8 epitope, MOG44-54, was reported by Sun et.al. (Sun et al.). The respective peptide sequences are shown in Figure 1. To ascertain the relative contribution of MOG37-46 and MOG44-54 specificity to the MOG35-55 reactive CD8+ population, we immunized mice with the full epitope MOG35-55 and measured peptide-specific responses in CD8+ cell lines derived from the lymph nodes of primed mice. Reactivity to both CD8+ epitopes was present within the population; however, we observed an increase in the percentage of T cells producing IFNγ with MOG37-46 (22.6%) as compared to MOG44-54 (5.6%) (Fig. 2A). In an average of four separate experiments, this difference was significant (p<0.01) (Fig 2B) and indicates increased numbers of MOG37-46 reactive T cells as compared to MOG44-54 reactive T cells.
Fig. 2. MOG35-55 CD8+ response is dominated by MOG37-46 specific CD8+ T cells.

A and B) Cells obtained from lymph nodes of mice primed with MOG35-55 were expanded in vitro for two weeks with 1µM MOG35-55 peptide. Cells were then restimulated with 100µM MOG37-46 or MOG44-54 peptide for 5 hours in the presence of BFA and labeled with antibodies to CD8 and intracellular IFNγ. Analysis shown is gated on CD8+ T cells. A representative plot, gated on CD8+CFSE- cells (A) and an average of four separate experiments (B) are shown. One-way ANOVA statistical analysis and Bonferroni's Multiple Comparison Test were performed, *p<0.05. C) Cells from MOG35-55 or rMOG primed animals were restimulated after two-week in vitro expansion with 100µM peptide for 5 hours in presence of BFA and labeled with antibodies to CD8 and intracellular IFNγ. Analysis shown is gated on CD8+CSFE- cells. A representative plot of three identical experiments is shown. D) Cells from lymph nodes of MOG35-55 primed mice were expanded in vitro for 5 days with 1µM MOG35-55 peptide. After 5 days, CD8+ T cell response to peptides was measured by intracellular IFNγ. Analysis shown is gated on CD8+CSFE- cells. A representative plot of two identical experiments is shown.
As MOG35-55 is a 21 amino acid long peptide, it may be more readily presented or alternatively processed by an APC than the full MOG protein. In order to verify that the CD8 epitope hierarchy is maintained during a response to the endogenous protein, we assessed reactivity to the two CD8+ epitopes from the cell lines derived after immunization with recombinant MOG protein. CD8+ T cells reactive to MOG37-46 and MOG44-54 were generated after immunization with either MOG protein or MOG35-55 peptide, as indicated by IFNγ production, suggesting that both MOG37-46 and MOG44-54 peptides can be processed and presented from the intact MOG protein in vivo (Fig. 2C). In addition, the dominant hierarchy of MOG37-46 over MOG44-54 was maintained between the two epitopes after priming with MOG protein (26.5 percent versus 3.8 percent INFγ+CD8+ T cells, respectively Fig. 2C).
We typically, assess the function of the CD8+ T cells after 2 weeks of passage in vitro to optimize the number of CD8+ T cells and minimize the extent the cultures contain CD4+ T cells. To date, MOG peptide antigen reactivity is below detection level ex vivo (data not shown), but this was not unexpected as most ex vivo analysis of T cell reactivity use a strong stimuli such as PMA and ionomycin to detect cytokine production. To verify that the epitope hierarchy is not skewed after two-week expansion in vitro, we assessed T cell responses after 5-days in culture with MOG35-55. After this short term expansion, CD8+ T cells reactive to MOG35-55, MOG37-46, and MOG44-54, were identified (10.2 percent, 5.4 percent, and 2.4 percent respectively). Again, the percentage of MOG37-46 reactive cells was greater than the MOG44-54 population, suggesting an epitope hierarchy for CD8+ T cells within the full length MOG35-55 peptide (Fig. 2D).
3.2. MOG37-46 CD8+ T cells are low-avidity, polyclonal, and pro-inflammatory
The avidity of a CD8+ T cell population has been shown to correlate well with the sensitivity of the T cells to antigen as analyzed by stimulation or effector function (Alexander-Miller et al., 1996). Here, functional avidity of the CD8+ T cells was assessed by looking at INFγ production after stimulation with peptide. CD8+ T cells primed in vivo with peptide and CFA emulsion were expanded in vitro with optimal doses of antigen, and restimulated with various doses of peptide antigen in the presence of APCs. To provide a point of comparison to pathogen reactive CD8+ T cells, mice were also generated with specificity to the well-characterized GP33 epitope from the LCMV (Gairin et al., 1995; Jones et al., 2008; Schnell et al., 2009). The pathogen specific CD8+ T cells (GP33-43) respond to their peptide antigen at nanomolar concentrations, within the range of peptide antigen typically found for CD8+ T cells (Gallimore et al., 1998). In contrast, the MOG-reactive CD8+ T cells fail to respond to antigen below micromolar doses (Fig. 3A). Therefore, the MOG37-46 CD8+ T cells are approximately of 1000-fold lower avidity as compared to viral antigen reactive CD8+ T cells (100 µM compare to 100 nM for peak response). Reactivity to MOG44-54 requires even more antigen for a response, as compared to MOG37-46; therefore, these CD8+ T cells are of even lower avidity. Since MOG37-46 was identified as the dominant epitope based on these data, we predominantly focused our remaining characterization of MOG-reactive CD8+ T cells on the MOG37-46 specific T cell population.
Fig. 3. MOG37-46 CD8+ T cells are low-avidity, pro-inflammatory, and polyclonal.

Lymph node derived CD8+ T cells from animals primed with GP33-43, MOG37-46 or MOG44-54 were expanded in vitro with 10nM GP33-43, 10µM MOG37-46, or 10µM MOG44-54 for two weeks. A) IFNγ production in response to specific peptides was measured by ELISA. An average of three independent experiments is shown. Error bars represent standard deviation. B) After in vitro expansion with MOG37-46, lymph node derived CD8+ T cells were restimulated with 100µM of 37–46 for 5 hours in the presence of BFA and labeled with CD8+ and intracellular IFNγ, TNFα and IL-2. Analysis shown is gated on CD8+ cells. C) MOG37-46 in vitro expanded CD8+ T cells were labeled with anti-Vβ panel of antibodies; analysis is gated on CD8+ cells (C). Representatives of 3 independent experiments are shown (B and C).
Simultaneous production of the cytokines IFNγ, TNFα, and IL-2 is a hallmark of CD8+ T cells fitness (Wherry et al., 2003). As analyzed by flow cytometry using intracellular cytokine staining, 72% of CD8+ T cells produce IFNγ and TNFα, and 21% also secrete IL-2 in response to MOG37-46 peptide (Fig. 3B). These CD8+ MOG-reactive T cells express a profile typical of competent CD8+ effector cells. In addition, the T cell response was analyzed for IL-17 production (an important cytokine for autoimmune disease) and IL-10 production (produced by anti-inflammatory T cell populations). These cytokines were undetected in response to MOG37-46 either by ELISA or ICC (data not shown) (Ford and Evavold). It has been reported that CD8+ T cell response targeted to myelin is oligoclonal in their TCR repertoire (Babbe et al.; Skulina et al.; Zang et al.). Based on their Vβ profile, the MOG37-46 specific CD8+ T cells exhibit a polyclonal phenotype (Fig 3 C). Therefore, MOG37-46 reactive CD8+ T cells are polyclonal, low affinity, and effector CD8+ T cells.
3.3. Immunization with CD8 epitope leads to a mild form of EAE with reduced severity of symptoms
We have previously reported that immunization with truncated CD8 epitope MOG37-46 will result in paralytic symptoms (Ford and Evavold). We have since expanded our data set, and report here significantly milder disease (p<0.02) in mice immunized with CD8 epitope alone, as opposed to mice immunized with MOG35-55, which also contains a CD4 epitope (Fig. 4). Both groups exhibited a chronic form of EAE with disease symptoms stabilizing around day 16. The reduction in length of the immunizing epitope can also influence the immunogenicity of the peptide due to decrease of its in vivo stability. We therefore generated extended hybrid epitopes that contained non-myelin CD4 peptides, either OVA323 or LLO190 (Krawczyk et al., 2007; Robertson et al., 2000), fused to MOG37-46. Immunization with these extended peptides resulted in similar mild disease course comparable to MOG37-46 (data not shown), indicating that in vivo stability may not play a role.
Fig. 4. Immunization with truncated CD8+ epitope leads to EAE with reduced severity of symptoms.
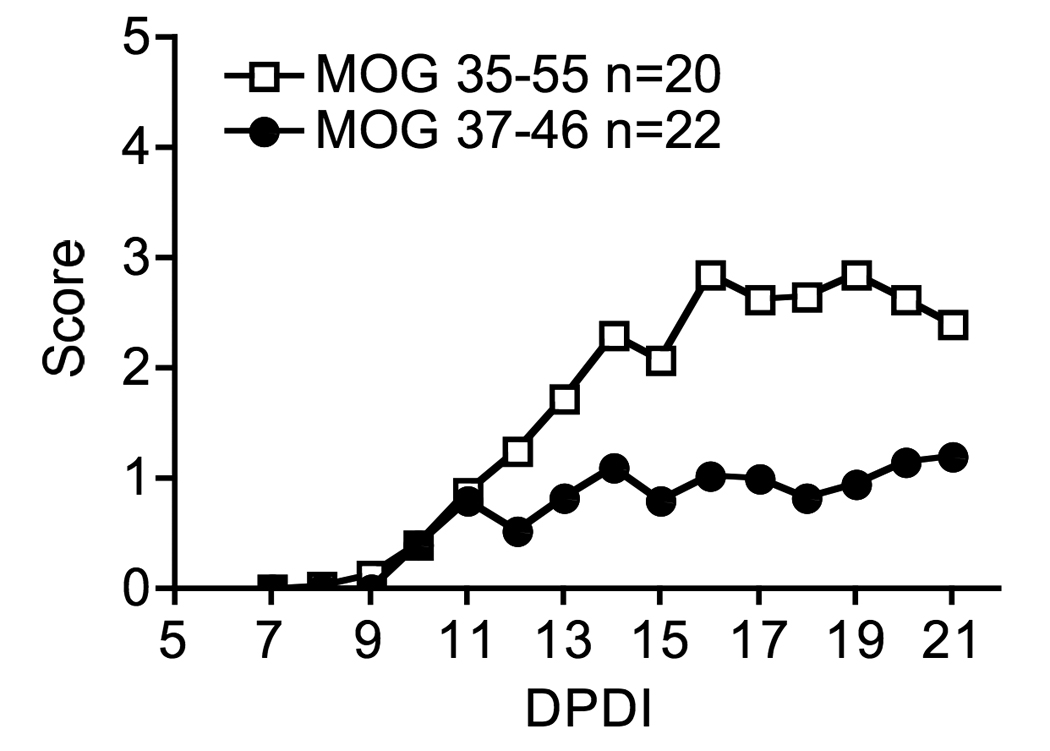
Female mice were immunized with MOG35-55 or MOG37-46 peptide emulsified in CFA and followed for disease symptoms out to day 21 post disease induction. Non-parametric student t-test was used for statistical comparison of the two groups, *p<0.02.
MOG 37-46 lacks two amino acids of the minimal MOG40-48 CD4+ T cell epitope (Mendel et al., 1996) and should not activate CD4+ T cells. We have analyzed the CD4+ and CD8+ T cell response from the splenocytes of mice induced for EAE using MOG35-55 or MOG37-46 peptides. We found selective CD8+ T cell activation in mice immunized with MOG37-46 and no activation of CD4+ T cells to either MOG35-55 or MOG37-46 above background. Further, there was minimal reactivity of MOG35-55 primed CD4+ T cells to MOG37-46 (Fig. 5). Therefore, the truncated CD8 epitope does not elicit a robust CD4 MOG-specific T cell response upon immunization. This lack of a CD4+ T cell response may result in the mild form of EAE seen upon MOG37-46 immunization (Figure 4).
Fig. 5. Selective activation of CD8+ T cells after immunization with MOG37-46.

Splenocytes from mice immunized with MOG35-55 or MOG37-46 were expanded in vitro with corresponding peptides and then restimulated with MOG35-55 and MOG37-46 peptides for 5 hours. Analysis shown is gated on either CD4+ cells or CD8+ cells. A representative experiment of three is shown.
To further characterize the ongoing immune response in the CNS, we have analyzed infiltration of the CNS, based on cell surface markers, at different times following disease induction with MOG35-55 or MOG37-46 (Fig. 6). MOG35-55 immunization results in CD4+ T cell dominated infiltrate in the brain that peaks at day 21 post disease induction and correlates with the peak of symptoms (Fig. 6D). The CD8+ T cell infiltrate in the CNS of mice immunized with MOG35-55 follows similar kinetics, but is significantly lower in number and is comprised of activated cells based on expression of CD44 and FasL (data not shown, Fig. 6C). Contrary to previous findings (Weiss et al.), a peak of CD8+ infiltration also coincided with peak of disease symptoms. These data further support the contribution of CNS infiltrating CD8+ T cells as part of the effector arm of the immune response in promoting disease symptoms rather than in having a regulatory function.
Fig. 6. Immunization with MOG35-55 results in increased lymphocyte and myeloid activation and infiltration as compared to MOG37-46.

Lymphocyte and myeloid populations from the brains of EAE mice were analyzed based on cell surface markers during the peak of disease symptoms. A and B) Macrophages and microglial populations were distinguished based on CD45 and CD11b cell surface expression in mice immunized with MOG35-55 (solid line), MOG37-46 (dotted line) and naïve mice (solid grey). MHC class I and class II expression analysis is gated on macrophages (CD45hiCD11b+) or microglia (CD45lowCD11b+). Representative plots from two independent experiments with 3 mice per group are shown. C) FasL expression on CD4+ and CD8+ cells was analyzed in mice immunized with MOG35-55 (solid line) and naive mice (solid grey line). FasL expression analysis is gated on CD4+ or CD8+ cells in the brains or spleens of EAE mice. A representative plot of three independent experiments is shown. D and E) CNS infiltration by CD4+ T cells, CD8+ T cells, and macrophages (CD45hiCD11b+) was followed in mice immunized with MOG35-55 or MOG37-46 using flow cytometric analysis. An average of three mice per time point is depicted in graphs. Error bars represent standard deviation.
Consistent with the mild extent of paralysis induced with MOG37-46, very small numbers of CD8+ or CD4+ T cells were found in the CNS at any time point examined (Fig. 6D). The few CD4+ T cells in the CNS (<1000) following MOG37-46 disease induction did not have an increase in Foxp3 expression compared to naïve mice, and thus the lower disease scores could not be attributed to an increase in regulatory CD4+ T cell function (data not shown). A transient increase in macrophage infiltration was detected at day 15 in mice immunized with the truncated CD8 epitope MOG37-46 (Fig. 6E). Interestingly, the activation of these infiltrating macrophages, along with the resident microglia, was reduced in MOG37-46 immunized animals as compared to animals immunized with MOG35-55, as shown by their class I and class II expression (Fig. 6B). These results indicate that priming with the truncated CD8 epitope results in selective activation of MOG-specific CD8+ T cells in the periphery, and in the absence of a robust CD4+ T cell response, a small accumulation of cells in the CNS.
3.4. CD8−/− mice exhibit reduced disease severity
We immunized CD8−/− and wild type mice with MOG35-55 to observe disease development in the absence of CD8+ T cells. All CD8−/− mice developed paralytic symptoms; however, these symptoms were significantly lower compared to wild type controls (Fig. 7A). This suggests that CD8+ T cells are not essential for disease induction, but they do contribute to the pathogenesis of the disease. To further address the function of MOG-reactive CD8+ T cells, we adoptively transferred CD8+ T cells expanded with MOG37-46 peptide into the CD8−/− animals at the time of disease induction. The CD8−/− mice that received MOG-reactive CD8+ T cells exhibited increased symptoms, although these differences did not reach statistical significance (Fig. 7B). In addition, the transfer of CD8+ T cells reactive to MOG to animals with CD4+ mediated EAE did not result in a decrease in symptoms. Thus, the CD8+ T cells do not regulate and limit the extent of EAE.
Fig. 7. CD8−/− mice exhibit reduced disease severity.

A) Five mice per group were immunized with MOG35-55 and followed for disease symptoms out to day 40 post disease induction. A representative of 3 independent experiments is shown. Non-parametric student t-test was used for statistical analysis p<0.0025. B) In vitro expanded 5×10⁶ MOG37-46 specific CD8+ T cells were adoptively transferred into CD8−/− recipients at day 0 in addition to immunization with MOG35-55.
3.5. Adoptive transfer of activated MOG37-46 CD8+ T cells induces mild EAE symptoms
In order to track MOG-specific T cells during EAE, we adoptively transferred activated MOG-specific CD4+ and CD8+ T cells expressing the Thy1.1 congenic marker into Thy1.2 recipients. We tracked the exogenous MOG-reactive CD8+ T cells using the Thy1.1 marker in the recipient mice and observed accumulation of MOG37-46 specific CD8+ T cells in the spleen and CNS after adoptive transfer of CD8+ T cells alone or together with CD4+ T cells (Fig. 8A). Therefore, the MOG37-46 specific T cells can recognize their target antigen in the CNS. Further, the transfer of activated MOG37-46 CD8+ T cells or MOG35-55 CD4+ T cells results in disease induction (Fig. 8B). However, consistent with our peptide immunization experiments, CD8+ T cells induced milder disease than CD4+ T cells (Fig. 8B). Onset of disease was similar in animals that received either CD4+ T cells or CD8+ T cells (an average of day 10.7 versus day 11.2, respectively); however, disease in animals that received CD8+ T cells, with an average peak score of 1.95, was lower than that in animals that received either CD4+ T cells alone or both CD4+ and CD8+ T cells, with an average peak score of 2.75 and 2.60 respectively (Table 1). Importantly, co-transfer of CD4+ and CD8+ T cells did not result in higher disease severity than CD4+ T cells alone, nor did the added CD8+ T cells reduce disease severity. In mice that received both CD4+ and CD8+ T cells, only 44% of CD8+ T cells are of donor origin. It is likely that the endogenous Thy1.2+ CD8+ T cells from the recipient mice are recruited to the response by the adoptively transferred CD4+ T cells and additional CD8+ T cells do not significantly impact the inflammatory CNS infiltrate.
Fig. 8. MOG37-46 CD8+ T cell traffic to the CNS and induce moderate disease symptoms.
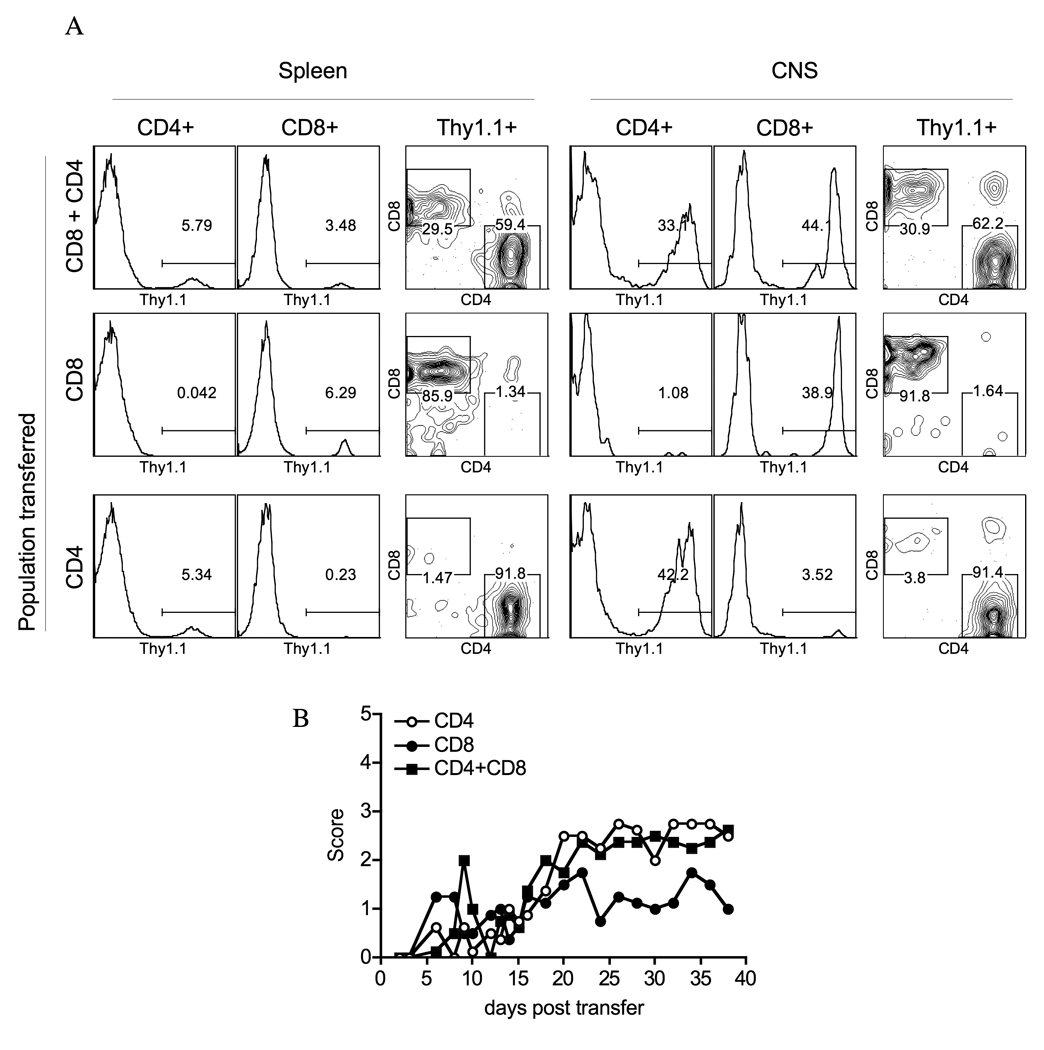
Lymph node primed and in vitro expanded and activated 5×10⁶ MOG37-46 specific CD8+ T cells and 5×10⁶ MOG35-55 specific CD4+ T cells from Thy1.1 congenic mice were adoptively transferred into wild type Thy1.2 recipients; mice were also given a single i.p. injection of pertussis toxin on the same day. A) CNS infiltration was analyzed by flow cytometry after labeling cells for Thy1.1, CD4 and CD8 cell surface markers. Data from a representative of 3 independent experiments are shown. Each group included 3–4 mice. B) Mice were followed for disease symptoms after adoptive transfer.
Table 1.
Disease symptoms after adoptive transfer of CD4+ MOG35-55 and CD8+ MOG37-46 reactive cells.
| Transferred population |
Day disease onset ± SD |
Ave. high score ± SD |
Ave. score ± SD |
|---|---|---|---|
| CD4 | 10.7 ± 5.12 | 2.75 ± 0.35 | 2.08 ± 0.54 |
| CD8 | 11.2 ± 5.29 | 1.95 ± 0.50 | 1.18 ± 0.55 |
| CD4+CD8 | 8.3 ± 2.21 | 2.60 ± 0.39 | 1.84 ± 0.45 |
Activated 5×10⁶ MOG37-46 specific CD8+ T cells and 5×10⁶ MOG35-55 specific CD4+ T cells from Thy1.1 congenic mice were adoptively transferred into wild type Thy1.2 recipients. Mice were also injected with pertussis toxin on day 0. Data is an average of 10 mice per group.
4. Discussion
The MOG35-55 induced EAE mouse model is dominated by Th17 and Th1 CD4+ T cell response; however, MOG-reactive CD8+ T cells are also generated in these mice. In this manuscript we have characterized the contribution of MOG-reactive CD8+ T cells to the pathogenesis of EAE. CD8+ T cells specific to two different epitopes within MOG35-55, MOG37-46 and MOG44-54, are generated in primed mice and activated MOG-reactive CD8+ T cells traffic to the CNS. Overall, our findings support a moderately pathogenic role for MOG37-46 CD8+ T cells and show a significant disease enhancement and sustained inflammation in the presence of CD4+ T cells. Alone, CD8+ T cells induce mild EAE and addition of exogenous MOG-specific CD8+ T cells results in minor increase of disease symptoms (Fig. 7). Interestingly, support for a role of CD4+ T cells for maximal disease severity was also seen in a few of our MOG37-46 EAE mice. Of note, we noticed a spike of disease symptoms as late as 40–60 days post immunization with MOG37-46, in some mice, and this correlated with significant increase of CD4+ T cell infiltration into the CNS (data not shown). The data is consistent with Friese et. al. and suggests that myelin antigen specific CD8+ T cells can be sufficient for disease induction and might be important for the initial damage; however, recruitment of CD4+ T cells significantly augments CNS inflammation leading to wide spread CNS damage.
Although, inflammation in the absence of CD4+ T cells is dramatically reduced, immunization with the CD8 epitope results in macrophage recruitment into the CNS and is sufficient for disease induction (Fig. 6B and E). Activated microglia and macrophages can certainly contribute to CNS inflammation and further recruitment of T cells. During inflammation of the CNS, myeloid cells release cytokines and chemokines that aid in blood brain barrier disruption and contribute to axon damage (Ford et al., 1996; Hendriks et al.; Heppner et al., 2005; Sedgwick et al., 1991). In the MOG37-46 immunized mice, the reduced activation of myeloid cells in the CNS is consistent with low level of T cell infiltration into the brain and reduction in disease scores.
In light of recent findings that glatiramer acetate therapy generates a subset of CD8+ T cells that can kill myelin antigen specific CD4+ T cells in the periphery, it is reasonable to assume that even pro-inflammatory CD8+ T cells can exhibit regulatory functions (Karandikar et al., 2002; Tennakoon et al., 2006). Our finding that MOG37-46 reactive T cells produced pro-inflammatory cytokines does not necessarily prove their pathogenic role in EAE. However, in our adoptive transfer experiments we never observed inhibition of symptoms, even when MOG-reactive CD8+ T cells were found at 1:2 ratio to CD4+ T cells in the CNS (Fig. 8). Moreover, there is an increase in disease severity associated with addition of MOG-reactive CD8+ T cells into the CD8−/− mice (Fig. 7B). Together, these data suggest that the CD8+ T cells in our model are not regulatory in nature, but can contribute to disease.
Several groups have addressed the role of CD8+ T cells in EAE by immunizing mice deficient in CD8+ T cells and have reported conflicting findings (Abdul-Majid et al.; Jiang et al., 1992; Koh et al.; Najafian et al.). The discrepancy between these reports may be due to the dual role that CD8+ T cells can play in autoimmune responses. In our hands, immunization of CD8−/− mice with MOG35-55 consistently results in reduced disease severity (Fig. 7). This finding is contradictory to the study by Najafian in the same EAE model, where the authors identify the regulatory CD8+CD28- population (Najafian et al.). We have attempted to duplicate the exact immunization protocol reported by Najafian, yet in our lab environment we find CD8+ T cells are a component of the effector autoimmune response. External environmental factors including the source of immunogen as well as the cleanliness of the animal facilities could contribute to the observed differences. Collectively, and similar to the analysis of CD4+ MOG-reactive T cells, studies done in the MOG EAE system suggest the presence of both regulatory and pro-inflammatory CD8+ T cell populations. We are still in the process of trying to identify means for generating both types of functional CD8+ T cells.
MOG-reactive CD8+ T cells have low functional avidity, and respond to their cognate antigen peptide at relatively high concentrations compared to CD8+ T cells generated to foreign peptide (Fig. 2), (Gallimore, 1998 #1845). This is characteristic of pathogenic self-reactive cells that have escaped negative selection in the thymus (Zehn and Bevan, 2006) and suggests that negative selection has a role in shaping the MOG-reactive repertoire of lymphocytes. Studies on the effect of central tolerance in the generation of MOG-reactive T cells reported conflicting findings (Delarasse et al.; Fazilleau et al.; Linares et al.). We have found that both the MOG37-46 and MOG44-54 form unstable peptide:MHC complexes based on RMA-s assay (Ford and Evavold). It is also known that low-stability peptide:MHC complex can allow self reactive T cells to escape from central tolerance (Liu et al.). Therefore it is possible that the MOG-specific CD8+ T cells have escaped negative selection in the thymus as a result of the stability of the autoantigen:MHC complex. The low avidity of the CD8+ T cell response may also contribute to an increase need for CD4+ T cell help to achieve maximal response.
Most pro-inflammatory CD8+ T cells, including MOG37-46 reactive CD8+ T cells, produce high amounts of IFNγ and TNFα, but no IL-17 (Fig. 3, data not shown). Given the recent findings on the role of IL-17 in EAE induction (Cua et al.; Komiyama et al.; Steinman), it is not surprising that in the absence of MOG-reactive CD4+ T cells, which are the main source of IL-17, disease severity is diminished. IL-17 is an inflammatory mediator that can induce myeloid cell activation and secretion of chemotactic factors, leading to accumulation of leukocytes at the site of cytokine release. Regardless of Il-17 production, after the recruitment into the CNS, CD8+ T cells can contribute to disease by IFNγ and TNFα production or FasL and perforin mediated cell death. Additionally, it was shown that CD8+ T cells could directly kill neurons and oligodendrocytes in vitro in an antigen specific manner (Giuliani et al.; Jurewicz et al.; Kawai and Zweiman). Therefore, CD8+ T cell population is a likely candidate for disease initiation in MS patients. Here, we conclude that MOG-reactive CD8+ T cells constitute a pro-inflammatory arm of lymphocyte response and act in combination with and help from MOG-reactive CD4+ T cells to induce CNS damage.
Acknowledgements
We are grateful to Lindsay Edwards for critical reading of the manuscript. The research presented in this manuscript was supported by National Institute of Health grant RO1-AI056017 and National Multiple Sclerosis Society grant RG4047.
Abbreviations
- APC
antigen-presenting cell
- B6
C57BL/6
- CFA
complete Freund’s adjuvant
- CNS
central nervous system
- EAE
experimental autoimmune encephalomyelitis
- ICC
intracellular cytokine staining
- LCMV
Lymphocytic Choriomeningitis Virus
- LLO
Listeria lysin O
- MHC
major histocompatibility complex
- MOG
myelin oligodendrocyte glycoprotein
- MS
multiple sclerosis
- OVA
ovalbumin
Footnotes
Publisher's Disclaimer: This is a PDF file of an unedited manuscript that has been accepted for publication. As a service to our customers we are providing this early version of the manuscript. The manuscript will undergo copyediting, typesetting, and review of the resulting proof before it is published in its final citable form. Please note that during the production process errors may be discovered which could affect the content, and all legal disclaimers that apply to the journal pertain.
Contributor Information
Maria Bettini, Email: maria.bettini@stjude.org.
Brian D. Evavold, Email: evavold@microbio.emory.edu.
References
- Abdul-Majid KB, Wefer J, Stadelmann C, Stefferl A, Lassmann H, Olsson T, Harris RA. Comparing the pathogenesis of experimental autoimmune encephalomyelitis in CD4−/− and CD8−/− DBA/1 mice defines qualitative roles of different T cell subsets. J Neuroimmunol. 2003;141:10–19. doi: 10.1016/s0165-5728(03)00210-8. [DOI] [PubMed] [Google Scholar]
- Alexander-Miller MA, Leggatt GR, Sarin A, Berzofsky JA. Role of antigen, CD8, and cytotoxic T lymphocyte (CTL) avidity in high dose antigen induction of apoptosis of effector CTL. J Exp Med. 1996;184:485–492. doi: 10.1084/jem.184.2.485. [DOI] [PMC free article] [PubMed] [Google Scholar]
- Babbe H, Roers A, Waisman A, Lassmann H, Goebels N, Hohlfeld R, Friese M, Schroder R, Deckert M, Schmidt S, Ravid R, Rajewsky K. Clonal expansions of CD8(+) T cells dominate the T cell infiltrate in active multiple sclerosis lesions as shown by micromanipulation and single cell polymerase chain reaction. J Exp Med. 2000;192:393–404. doi: 10.1084/jem.192.3.393. [DOI] [PMC free article] [PubMed] [Google Scholar]
- Ben-Nun A, Mendel I, Bakimer R, Fridkis-Hareli M, Teitelbaum D, Arnon R, Sela M, Kerlero de Rosbo N. The autoimmune reactivity to myelin oligodendrocyte glycoprotein (MOG) in multiple sclerosis is potentially pathogenic: effect of copolymer 1 on MOG-induced disease. J Neurol. 1996;243:S14–S22. doi: 10.1007/BF00873697. [DOI] [PubMed] [Google Scholar]
- Cua DJ, Sherlock J, Chen Y, Murphy CA, Joyce B, Seymour B, Lucian L, To W, Kwan S, Churakova T, Zurawski S, Wiekowski M, Lira SA, Gorman D, Kastelein RA, Sedgwick JD. Interleukin-23 rather than interleukin-12 is the critical cytokine for autoimmune inflammation of the brain. Nature. 2003;421:744–748. doi: 10.1038/nature01355. [DOI] [PubMed] [Google Scholar]
- De Jager PL, Hafler DA. New therapeutic approaches for multiple sclerosis. Annu Rev Med. 2007;58:417–432. doi: 10.1146/annurev.med.58.071105.111552. [DOI] [PubMed] [Google Scholar]
- Delarasse C, Daubas P, Mars LT, Vizler C, Litzenburger T, Iglesias A, Bauer J, Della Gaspera B, Schubart A, Decker L, Dimitri D, Roussel G, Dierich A, Amor S, Dautigny A, Liblau R, Pham-Dinh D. Myelin/oligodendrocyte glycoprotein-deficient (MOG-deficient) mice reveal lack of immune tolerance to MOG in wild-type mice. J Clin Invest. 2003;112:544–553. doi: 10.1172/JCI15861. [DOI] [PMC free article] [PubMed] [Google Scholar]
- Fazilleau N, Delarasse C, Sweenie CH, Anderton SM, Fillatreau S, Lemonnier FA, Pham-Dinh D, Kanellopoulos JM. Persistence of autoreactive myelin oligodendrocyte glycoprotein (MOG)-specific T cell repertoires in MOG-expressing mice. Eur J Immunol. 2006;36:533–543. doi: 10.1002/eji.200535021. [DOI] [PubMed] [Google Scholar]
- Fillatreau S, Sweenie CH, McGeachy MJ, Gray D, Anderton SM. B cells regulate autoimmunity by provision of IL-10. Nat Immunol. 2002;3:944–950. doi: 10.1038/ni833. [DOI] [PubMed] [Google Scholar]
- Ford AL, Foulcher E, Lemckert FA, Sedgwick JD. Microglia induce CD4 T lymphocyte final effector function and death. J Exp Med. 1996;184:1737–1745. doi: 10.1084/jem.184.5.1737. [DOI] [PMC free article] [PubMed] [Google Scholar]
- Ford ML, Evavold BD. Specificity, magnitude, and kinetics of MOG-specific CD8+ T cell responses during experimental autoimmune encephalomyelitis. Eur J Immunol. 2005;35:76–85. doi: 10.1002/eji.200425660. [DOI] [PubMed] [Google Scholar]
- Ford ML, Evavold BD. Modulation of MOG 37-50-specific CD8+ T cell activation and expansion by CD43. Cell Immunol. 2006;240:53–61. doi: 10.1016/j.cellimm.2006.06.007. [DOI] [PubMed] [Google Scholar]
- Gairin JE, Mazarguil H, Hudrisier D, Oldstone MB. Optimal lymphocytic choriomeningitis virus sequences restricted by H-2Db major histocompatibility complex class I molecules and presented to cytotoxic T lymphocytes. J Virol. 1995;69:2297–2305. doi: 10.1128/jvi.69.4.2297-2305.1995. [DOI] [PMC free article] [PubMed] [Google Scholar]
- Galea I, Bernardes-Silva M, Forse PA, van Rooijen N, Liblau RS, Perry VH. An antigen-specific pathway for CD8 T cells across the blood-brain barrier. J Exp Med. 2007;204:2023–2030. doi: 10.1084/jem.20070064. [DOI] [PMC free article] [PubMed] [Google Scholar]
- Gallimore A, Hombach J, Dumrese T, Rammensee HG, Zinkernagel RM, Hengartner H. A protective cytotoxic T cell response to a subdominant epitope is influenced by the stability of the MHC class I/peptide complex and the overall spectrum of viral peptides generated within infected cells. Eur J Immunol. 1998;28:3301–3311. doi: 10.1002/(SICI)1521-4141(199810)28:10<3301::AID-IMMU3301>3.0.CO;2-Q. [DOI] [PubMed] [Google Scholar]
- Giuliani F, Goodyer CG, Antel JP, Yong VW. Vulnerability of human neurons to T cell-mediated cytotoxicity. J Immunol. 2003;171:368–379. doi: 10.4049/jimmunol.171.1.368. [DOI] [PubMed] [Google Scholar]
- Hemmer B, Stuve O, Kieseier B, Schellekens H, Hartung HP. Immune response to immunotherapy: the role of neutralising antibodies to interferon beta in the treatment of multiple sclerosis. Lancet Neurol. 2005;4:403–412. doi: 10.1016/S1474-4422(05)70117-4. [DOI] [PubMed] [Google Scholar]
- Hendriks JJ, Teunissen CE, de Vries HE, Dijkstra CD. Macrophages and neurodegeneration. Brain Res Brain Res Rev. 2005;48:185–195. doi: 10.1016/j.brainresrev.2004.12.008. [DOI] [PubMed] [Google Scholar]
- Heppner FL, Greter M, Marino D, Falsig J, Raivich G, Hovelmeyer N, Waisman A, Rulicke T, Prinz M, Priller J, Becher B, Aguzzi A. Experimental autoimmune encephalomyelitis repressed by microglial paralysis. Nat Med. 2005;11:146–152. doi: 10.1038/nm1177. [DOI] [PubMed] [Google Scholar]
- Jiang H, Zhang SI, Pernis B. Role of CD8+ T cells in murine experimental allergic encephalomyelitis. Science. 1992;256:1213–1215. doi: 10.1126/science.256.5060.1213. [DOI] [PubMed] [Google Scholar]
- Jones DS, Reichardt P, Ford ML, Edwards LJ, Evavold BD. TCR antagonism by peptide requires high TCR expression. J Immunol. 2008;181:1760–1766. doi: 10.4049/jimmunol.181.3.1760. [DOI] [PubMed] [Google Scholar]
- Jurewicz A, Biddison WE, Antel JP. MHC class I-restricted lysis of human oligodendrocytes by myelin basic protein peptide-specific CD8 T lymphocytes. J Immunol. 1998;160:3056–3059. [PubMed] [Google Scholar]
- Karandikar NJ, Crawford MP, Yan X, Ratts RB, Brenchley JM, Ambrozak DR, Lovett-Racke AE, Frohman EM, Stastny P, Douek DC, Koup RA, Racke MK. Glatiramer acetate (Copaxone) therapy induces CD8(+) T cell responses in patients with multiple sclerosis. J Clin Invest. 2002;109:641–649. doi: 10.1172/JCI14380. [DOI] [PMC free article] [PubMed] [Google Scholar]
- Kawai K, Zweiman B. Cytotoxic effect of myelin basic protein-reactive T cells on cultured oligodendrocytes. J Neuroimmunol. 1988;19:159–165. doi: 10.1016/0165-5728(88)90045-8. [DOI] [PMC free article] [PubMed] [Google Scholar]
- Koh DR, Fung-Leung WP, Ho A, Gray D, Acha-Orbea H, Mak TW. Less mortality but more relapses in experimental allergic encephalomyelitis in CD8−/−mice. Science. 1992;256:1210–1213. doi: 10.1126/science.256.5060.1210. [DOI] [PubMed] [Google Scholar]
- Komiyama Y, Nakae S, Matsuki T, Nambu A, Ishigame H, Kakuta S, Sudo K, Iwakura Y. IL-17 plays an important role in the development of experimental autoimmune encephalomyelitis. J Immunol. 2006;177:566–573. doi: 10.4049/jimmunol.177.1.566. [DOI] [PubMed] [Google Scholar]
- Krawczyk CM, Shen H, Pearce EJ. Memory CD4 T cells enhance primary CD8 T-cell responses. Infect Immun. 2007;75:3556–3560. doi: 10.1128/IAI.00086-07. [DOI] [PMC free article] [PubMed] [Google Scholar]
- Lee YH, Ishida Y, Rifa'i M, Shi Z, Isobe K, Suzuki H. Essential role of CD8+CD122+ regulatory T cells in the recovery from experimental autoimmune encephalomyelitis. J Immunol. 2008;180:825–832. doi: 10.4049/jimmunol.180.2.825. [DOI] [PubMed] [Google Scholar]
- Linares D, Mana P, Goodyear M, Chow AM, Clavarino C, Huntington ND, Barnett L, Koentgen F, Tomioka R, Bernard CC, Freire-Garabal M, Reid HH. The magnitude and encephalogenic potential of autoimmune response to MOG is enhanced in MOG deficient mice. Journal of Autoimmunity. 2003;21:339–351. doi: 10.1016/j.jaut.2003.09.001. [DOI] [PubMed] [Google Scholar]
- Liu GY, Fairchild PJ, Smith RM, Prowle JR, Kioussis D, Wraith DC. Low avidity recognition of self-antigen by T cells permits escape from central tolerance. Immunity. 1995;3:407–415. doi: 10.1016/1074-7613(95)90170-1. [DOI] [PubMed] [Google Scholar]
- Mendel I, Kerlero de Rosbo N, Ben-Nun A. A myelin oligodendrocyte glycoprotein peptide induces typical chronic experimental autoimmune encephalomyelitis in H-2b mice: fine specificity and T cell receptor V beta expression of encephalitogenic T cells. Eur J Immunol. 1995;25:1951–1959. doi: 10.1002/eji.1830250723. [DOI] [PubMed] [Google Scholar]
- Mendel I, Kerlero de Rosbo N, Ben-Nun A. Delineation of the minimal encephalitogenic epitope within the immunodominant region of myelin oligodendrocyte glycoprotein: diverse V beta gene usage by T cells recognizing the core epitope encephalitogenic for T cell receptor V beta b and T cell receptor V beta a H-2b mice. European Journal of Immunology. 1996;26:2470–2479. doi: 10.1002/eji.1830261030. [DOI] [PubMed] [Google Scholar]
- Mokhtarian F, McFarlin DE, Raine CS. Adoptive transfer of myelin basic protein-sensitized T cells produces chronic relapsing demyelinating disease in mice. Nature. 1984;309:356–358. doi: 10.1038/309356a0. [DOI] [PubMed] [Google Scholar]
- Najafian N, Chitnis T, Salama AD, Zhu B, Benou C, Yuan X, Clarkson MR, Sayegh MH, Khoury SJ. Regulatory functions of CD8+CD28- T cells in an autoimmune disease model. J Clin Invest. 2003;112:1037–1048. doi: 10.1172/JCI17935. [DOI] [PMC free article] [PubMed] [Google Scholar]
- Redwine JM, Buchmeier MJ, Evans CF. In vivo expression of major histocompatibility complex molecules on oligodendrocytes and neurons during viral infection. Am J Pathol. 2001;159:1219–1224. doi: 10.1016/S0002-9440(10)62507-2. [DOI] [PMC free article] [PubMed] [Google Scholar]
- Robertson JM, Jensen PE, Evavold BD. DO11.10 and OT-II T cells recognize a C-terminal ovalbumin 323–339 epitope. J Immunol. 2000;164:4706–4712. doi: 10.4049/jimmunol.164.9.4706. [DOI] [PubMed] [Google Scholar]
- Schnell FJ, Alberts-Grill N, Evavold BD. CD8+ T cell responses to a viral escape mutant epitope: active suppression via altered SHP-1 activity. J Immunol. 2009;182:1829–1835. doi: 10.4049/jimmunol.0801798. [DOI] [PubMed] [Google Scholar]
- Sedgwick JD, Schwender S, Imrich H, Dorries R, Butcher GW, ter Meulen V. Isolation and direct characterization of resident microglial cells from the normal and inflamed central nervous system. Proc Natl Acad Sci U S A. 1991;88:7438–7442. doi: 10.1073/pnas.88.16.7438. [DOI] [PMC free article] [PubMed] [Google Scholar]
- Skulina C, Schmidt S, Dornmair K, Babbe H, Roers A, Rajewsky K, Wekerle H, Hohlfeld R, Goebels N. Multiple sclerosis: brain-infiltrating CD8+ T cells persist as clonal expansions in the cerebrospinal fluid and blood. Proc Natl Acad Sci U S A. 2004;101:2428–2433. doi: 10.1073/pnas.0308689100. [DOI] [PMC free article] [PubMed] [Google Scholar]
- Steinman L. A brief history of T(H)17, the first major revision in the T(H)1/T(H)2 hypothesis of T cell-mediated tissue damage. Nat Med. 2007;13:139–145. doi: 10.1038/nm1551. [DOI] [PubMed] [Google Scholar]
- Sun D, Zhang Y, Wei B, Peiper SC, Shao H, Kaplan HJ. Encephalitogenic activity of truncated myelin oligodendrocyte glycoprotein (MOG) peptides and their recognition by CD8+ MOG-specific T cells on oligomeric MHC class I molecules. Int Immunol. 2003;15:261–268. doi: 10.1093/intimm/dxg023. [DOI] [PubMed] [Google Scholar]
- Tennakoon DK, Mehta RS, Ortega SB, Bhoj V, Racke MK, Karandikar NJ. Therapeutic induction of regulatory, cytotoxic CD8+ T cells in multiple sclerosis. J Immunol. 2006;176:7119–7129. doi: 10.4049/jimmunol.176.11.7119. [DOI] [PubMed] [Google Scholar]
- Weiss HA, Millward JM, Owens T. CD8+ T cells in inflammatory demyelinating disease. J Neuroimmunol. 2007;191:79–85. doi: 10.1016/j.jneuroim.2007.09.011. [DOI] [PubMed] [Google Scholar]
- Wherry EJ, Blattman JN, Murali-Krishna K, van der Most R, Ahmed R. Viral persistence alters CD8 T-cell immunodominance and tissue distribution and results in distinct stages of functional impairment. J Virol. 2003;77:4911–4927. doi: 10.1128/JVI.77.8.4911-4927.2003. [DOI] [PMC free article] [PubMed] [Google Scholar]
- Yura M, Takahashi I, Serada M, Koshio T, Nakagami K, Yuki Y, Kiyono H. Role of MOG-stimulated Th1 type "light up" (GFP+) CD4+ T cells for the development of experimental autoimmune encephalomyelitis (EAE) Journal of Autoimmunity. 2001;17:17–25. doi: 10.1006/jaut.2001.0520. [DOI] [PubMed] [Google Scholar]
- Zang YC, Li S, Rivera VM, Hong J, Robinson RR, Breitbach WT, Killian J, Zhang JZ. Increased CD8+ cytotoxic T cell responses to myelin basic protein in multiple sclerosis. J Immunol. 2004;172:5120–5127. doi: 10.4049/jimmunol.172.8.5120. [DOI] [PubMed] [Google Scholar]
- Zehn D, Bevan MJ. T cells with low avidity for a tissue-restricted antigen routinely evade central and peripheral tolerance and cause autoimmunity. Immunity. 2006;25:261–270. doi: 10.1016/j.immuni.2006.06.009. [DOI] [PMC free article] [PubMed] [Google Scholar]