

Abstract
Activation of T lymphocytes by antigen-presenting cells (APC) results in the formation of an immunological synapse. Following contact with the target cell, key signaling and adhesion molecules polarize within minutes to hours to the T cell-APC interface. Multispectral imaging flow cytometry, a new technology which combines flow cytometry with imaging, was used to visualize and quantify the recruitment of the CD3ε and Lck signaling molecules during the evolution of an immune synapse. Using this technology, thousands of T cell-macrophage conjugates could be analyzed for each experimental time point. Following Ca++ triggered T cell activation, the dynamics of Lck and CD3ε recruitment to the synapse, analyzed by two independent methods, was comparable. However, CD3ε exhibited longer residence times (> 8 min) at the synapse than Lck.
Keywords: imaging flow cytometry, immunological synapse, flow cytometry, fluorescence microscopy
1. Introduction
The immunological synapse (IS) is a specialized junction between a T cell and an antigen-presenting cell (APC) that forms within seconds of engagement between the T cell receptor (TCR) and cognate peptide-MHC complexes on the APC. This cell-surface recognition event initiates an organized intracellular signaling cascade that results in T cell activation and proliferation (Kane et al., 2000). The generation of this supramolecular organization, recruitment and assembly of adhesion molecules, scaffolding proteins and receptors on both sides of the IS in concentrically organized spatial structures has been previously defined by confocal fluorescence microscopy (Monks et al., 1998; Grakoui et al., 1999; Potter et al., 2001; Stinchcombe et al., 2001; Somersalo et al., 2004; Anikeeva et al., 2005; Stinchcombe et al., 2006; Sims et al., 2007; Beal et al., 2008; Seed and Xavier, 2008; Yeh et al., 2008; Dustin, 2009). The IS organizes in a bull's eye pattern with an outer ring containing actin (the distal supramolecular activation cluster, dSMAC), a proximal adhesive ring containing LFA-1 (pSMAC) and a central signaling cluster (cSMAC), which contains the TCR and its associated adaptor and transduction molecules. In cytotoxic cells, the cSMAC is divided into a signaling domain and a secretory domain for release of cytotoxic granule components and cytokines (Stinchcombe et al., 2001; Stinchcombe et al., 2006). Alterations in the status of any of the stimulatory, costimulatory or inhibitory, or adhesive molecules on the T cell or of their ligands on the antigen presenting cell or target cell at the other side of the immune interface can alter the kinetics and organization of the IS with profound downstream consequences on T cell activation and effector function.
Limitations to current imaging techniques using confocal microscopy include sample photo-bleaching, difficulty in objectively finding rare events, and limited statistics with sampling pools ranging from 30 to 50 conjugates. Imaging of the synapse formed by the T cell has been optimized by examining horizontally oriented synapses between immune cells and artificial substrates that mimic target cells, such as antibody-coated glass slides (Bunnell et al., 2002) or supported planar lipid bilayers with anchored ligand proteins (Groves and Dustin, 2003; Mossman et al., 2005). Such simplified systems coupled with total internal reflection fluorescence (TIRF) microscopy have made important contributions to elucidating early signaling events, such as the evolution of TCR microclusters at the peripheral site of cell contact (Yokosuka et al., 2005) and the precise time course for the recruitment and rearrangement of membrane-associated molecules at the evolving IS (Grakoui et al., 1999). However, such artificial substrates may not recapitulate all of the complexities in interacting cells and could overlook diffusion limited movement of some molecules. Moreover, confocal microscopy only allows imaging of small numbers of events, whose selection may be influenced by observer bias. To address these problems, we developed a complementary method to use high-speed multispectral imaging flow cytometry to study the IS using the recruitment of the key signaling molecule Lck as a model. Imaging flow cytometry has previously been used to track the nuclear translocation of NF-κB in antibody activated T cells (Medeiros et al., 2007) and more recently it has been used to image SKAP 55 protein at the interface of T cell/antibody coated beads (Burbach et al., 2008). We developed two independent methodologies to map the translocation of two key T cell signaling molecules, Lck and CD3, to the interface of an immune synapse formed between a T cell/macrophage conjugate. This technique enables automated collection and quantitative image analysis of thousands of conjugates per sample, thereby providing a statistically robust analysis of the IS.
2. Materials and methods
2.1. Cell Culture
CD8+ T cells were isolated by Ficoll separation from peripheral blood from healthy human donors. Cytotoxic T cell (CTL) were generated by stimulation with phytohemagglutinin (PHA, 4 μg/ml) and 1000 units/ml of human recombinant IL-2 (SpecialtyScripts Pharmacy LLC, Fall River, MA, USA) in RPMI medium containing 10% fetal bovine serum (FBS), 2 mM L-glutamine, 2 mM HEPES, 100 μg/ml streptomycin and 100 U/ml penicillin (Sigma-Aldrich Corp., St. Louis, MO, USA). Autologous macrophages were cultured on Primaria plates (BD Falcon, San Jose, CA, USA) for use as target cells.
2.2. Preparation of T cell/Macrophage Conjugates
Autologous macrophages, washed once in RPMI to remove serum, twice with calcium free HBSS buffer, and re-suspended at a final concentration of 1-5×10⁶ cells/ml, were converted to target cells by incubation with 5 μg/ml of anti-CD3 (UCHT1; eBiosciences, San Diego, CA, USA) for 5 min on ice before mixing at a 5:1 CTL:macrophage cell ratio with similarly washed PHA-activated CTL blasts isolated on day 5-16 of culture. This protocol is a modification of a previously described method (Stinchcombe et al., 2006), which was optimized as to the antibody concentration and effector:target cell ratio for maximal chromium release in a redirected cytotoxicity assay (Saverino et al., 1999; Gati et al., 2001; Wulfing et al., 2003; Crocenzi et al., 2005). For most experiments, 5-10×106 antibody-coated macrophage targets were incubated with five times as many CTL in 0.4 ml for 10-15 min at 37°C in calcium free medium to allow for conjugate formation without T cell activation. For the kinetics experiments, ∼1×10⁶ macrophage targets/sample/time point were used. Calcium chloride was added to a final concentration of 6 mM at time 0. At indicated times following activation, cells were fixed by incubation in 4 volumes of 2% paraformaldehyde at 4°C for 20 min followed by neutralization with equal volumes of 100 mM ammonium chloride for 20 min at RT. Fixed cells were centrifuged (500 g for 10 min) and resuspended in staining buffer (10% human AB serum, 0.1% Triton X-100 in PBS) for 10 min on ice. Cells were stained with Lck rabbit antibody (Cell Signaling, Danvers, MA, USA) for 30 min on ice, washed twice (10% BSA, 2% FCS in PBS) and then stained with Alexa 546-conjugated antisera to rabbit IgG and with PE Alexa 610-conjugated anti-CD3ε (BD Biosciences, San Jose, CA, USA). Fluorescently labeled samples were washed twice in wash buffer and resuspended in 100 μl volumes of 1% paraformaldehyde in PBS. The conjugates were labeled with the nuclear dye DRAQ5 (Biostatus Limited, Shepshed, Leicestershire, UK) before analysis on the AMNIS ImageStream imaging flow cytometer (AMNIS Inc., Seattle, WA, USA).
2.3. Quantitation of Lck and CD3 at the Immunological Synapse
Approximately 20-100,000 event image files were acquired for each condition. Events that corresponded to conjugates of a single T cell with one macrophage were selected as described in the results and constituted ∼10% of all events. Background conjugate formation between T cells and macrophages that were not preincubated with antibody was rare. Single color controls were collected and used to calculate a spectral crosstalk compensation matrix to compensate the imagery. The algorithms in the IDEAS image analysis software (Amnis Inc., Seattle, WA, USA) create two types of functions: mask and feature. Mask refers to the set of pixels that comprise the region of interest and feature refers to calculated values using pixel intensities of the image and can be constrained to a mask. The feature Area calculates the square microns of a given mask. Aspect ratio is the ratio of the minor axis and major axis of a best-fit ellipse that encapsulate the given mask. Intensity is the sum of pixel intensities (camera-background-subtracted) in an image. These features are used in this study to identify two-cell conjugates that contain only one T cell as described in the Results section.
To measure accumulation of Lck at the IS, two methods of masking strategies, Valley and Interface, were used to identify the IS region. The Valley mask identifies the central region of low intensity within an image. When applied to the DNA image of a conjugate, the valley region approximates the location of the IS. It does this by locating the pixel of dimmest intensity along a line that joins the center of the two nuclei. From this point, a rectangular mask is formed that defines the location of the synapse. The width of the Valley mask at 90 degrees to the longest length of the conjugate is determined by the width of the DNA image and the thickness is derived empirically from representative single T cell conjugates and adjusted to cover an average synapse observed in the experiment. Because synapse width rarely if ever exceeds the width of the nucleus, using the DNA image as a reference point for the width of the synapse is a convenient method to automate the masking method for large numbers of events, even when cell size may vary within a population. The Interface mask, on the other hand, locates the points of contact between two cells and conforms to the shape of the synapse specifically within one cell of the conjugate. It achieves this using two input masks, the ‘Cell of Interest’ (COI) mask which specifically identifies the cell within which the synapse is expected (in this case defined by CD3), and the ‘Conjugate’ mask, which identifies the entire conjugate (in this case brightfield). Using these two inputs, the outermost pixels of the CD3 synapse are determined. The thickness of the mask is adjustable and grows specifically into the CD3 image. Accumulation of Lck at the immune synapse was then quantified with the features ‘Lck Intensity at IS’ which quantifies the intensity of Lck within the Interface or Valley masks, and ‘Lck median pixel ratio’, which is the median pixel of Lck within the Interface mask divided by the median pixel value of Lck within the entire CD3 cell. The median pixel ratio normalizes for cell-to-cell variation in overall Lck intensity. A sub-population of events with high Lck Intensity and/or ratio values are gated in Figure 4, and the percentage of events that fall in the gate are reported. To define a synaptic event, an arbitrary gate that captured the synapse over many conjugates was chosen and then fixed for the time course of each experiment. As Lck accumulates at the IS, both the intensity and median pixel ratio increases.
Figure 4. Dynamic translocation of Lck to the IS. Scatter plots display Lck intensity at the IS as a function of Ca++ trigger.
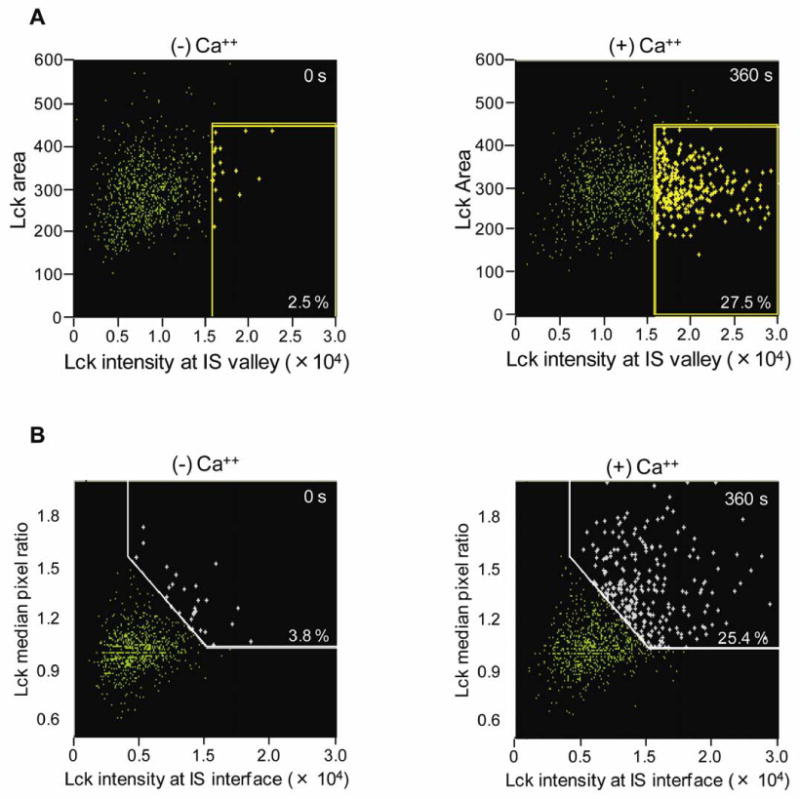
At initial times and in the absence of Ca++, there are fewer T cell/APC conjugates and only < 4% of those contain Lck at the IS (left plots). However, 6 min post Ca++ trigger, both the total numbers of T cell/APC conjugates and the % with Lck translocated to the IS significantly increase, whether the IS is defined within the population of conjugates by the (A) Valley or (B) Interface functions.
3. Results
3.1. Selection of single T cells participating in a two-cell conjugate
The earliest biochemical event during T cell activation is phosphorylation of the immunoreceptor tyrosine-based activation motif (ITAM) sequences in TCR-associated CD3 components by the Src family tyrosine kinase Lck (Iwashima et al., 1994; Holdorf et al., 2002). Both Lck and CD3 are rapidly recruited to the IS upon TCR ligation. Here we use both Lck and CD3ε as molecular markers of synapses established between single T cell/APC conjugates. Activated primary human T cells were brought into contact with anti-CD3-coated macrophage targets in the absence of Ca++ (required for T cell signaling and intracellular trafficking) and then pulsed with Ca++ to initiate translocation of proteins and secretory vesicles to the interface of an evolving synapse. Conjugates were fixed at subsequent times and stained with both a nuclear dye (DRAQ5) and T cell specific markers – Lck and CD3. Approximately 50,000 to 100,000 events (corresponding to ∼3,000 to 10,000 2-cell conjugates) were collected at each time, compensated across 3 fluorescent channels, and analyzed using image-based algorithms. Two cell conjugates were selected from single cells by virtue of their low nuclear aspect ratio (AR) and two-cell DNA content (Figure 1). Events with one T cell engaged with an APC were gated using the area and aspect ratio of the CD3 image (Figure 2). Conjugates that have low CD3 area and high CD3 aspect ratio contain only one T cell. Because the AMNIS Imagestream instrument utilizes a low-pressure fluidic system and samples flow at a low rate of 22 mm/s, the conjugates appeared stable in the flow stream, presumably because they were fixed prior to acquisition. An indicator of conjugate stability is that only 1.1 ± 0.3% of the acquired single T cells showed polarized CD3 staining, indicating that few T cells had detached after forming conjugates.
Figure 1. Selection criterion for identifying two cell conjugates.
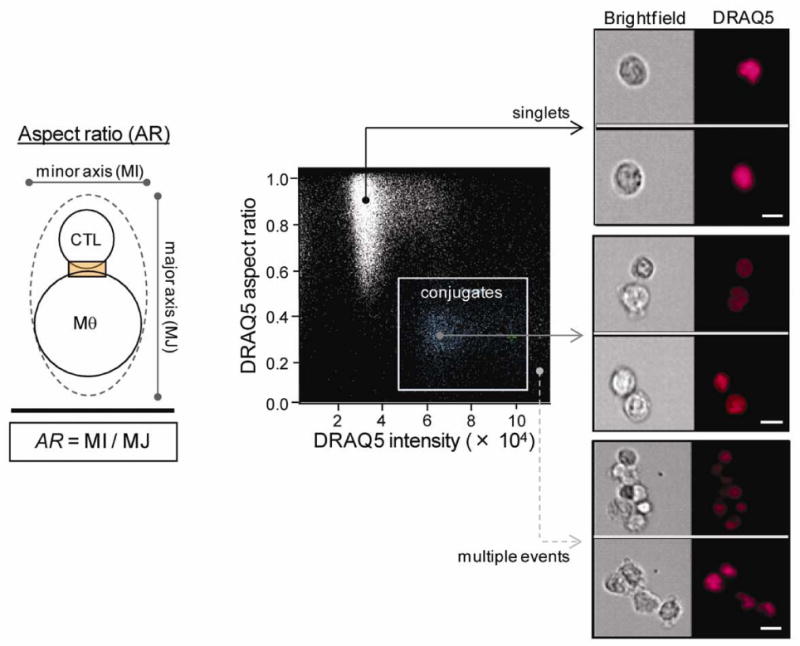
Immune cell doublets were distinguished from single cells or other multiple aggregates based on nuclear aspect ratios (≤ 0.5) and two-cell DNA content. Schematic diagram shows the aspect ratio (AR) as the ratio of the minor axis and major axis of a best-fit ellipse that encapsulates a T cell/macrophage conjugate. Scale bars, 10 μm.
Figure 2. Identification of single T cell conjugates.
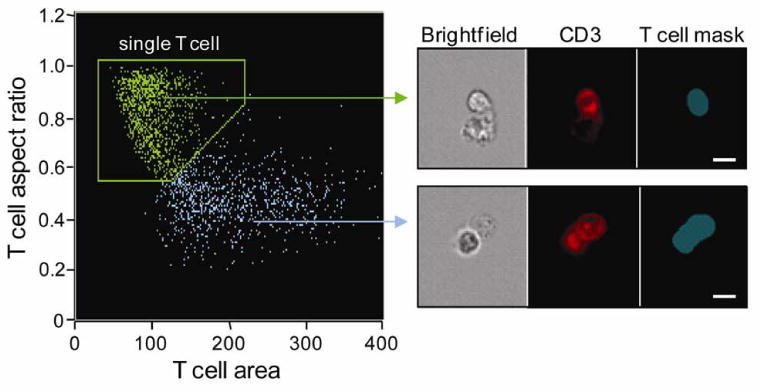
Conjugates containing single T cells were selected from the doublet population using the CD3 image of the T cell. Conjugates with high CD3 AR (∼1) were defined as conjugates of one T cell and one APC. Multiple T cells involved in immune cell clusters have high CD3 area and low CD3 AR (lower panel; blue arrow). The blue mask identifies the region of CD3 staining. Scale bar, 10 μm.
3.2. Defining the area of the immunological synapse in T cell/APC conjugates
The area of the immunological synapse was then identified in the two-cell conjugates using two independent algorithmic functions (Figure 3A). The Valley function identifies the dimmest area between two nuclei and the Interface function identifies the point of contact between two cells and selects only the (CD3+) T cell portion of the T cell/APC synapse. The advantage of the Valley function is that it can be used to study the translocation of proteins derived from both the effector and target cell to the IS, while the Interface function selectively locates proteins derived from one of the two immune cells.
Figure 3. Defining an immunological synapse (IS) by imaging flow cytometry.
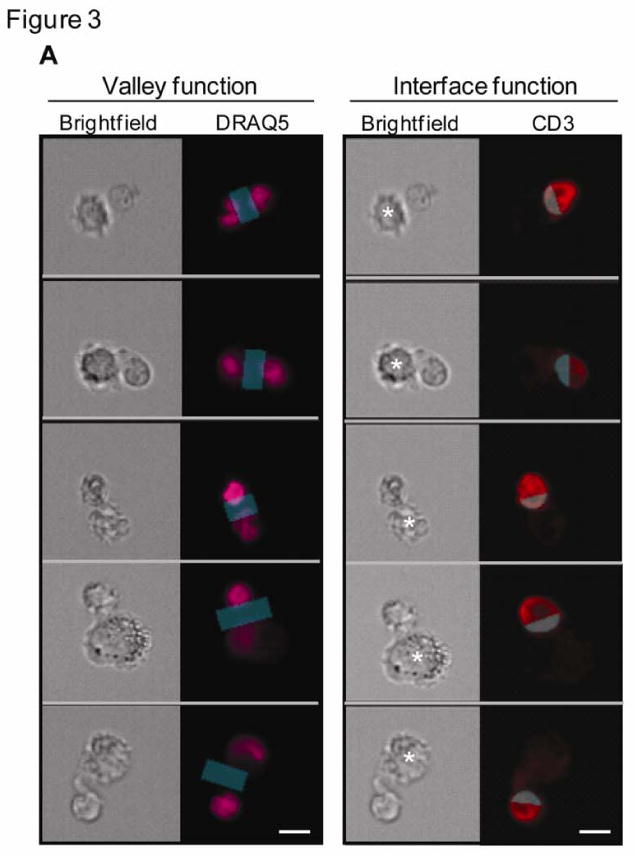
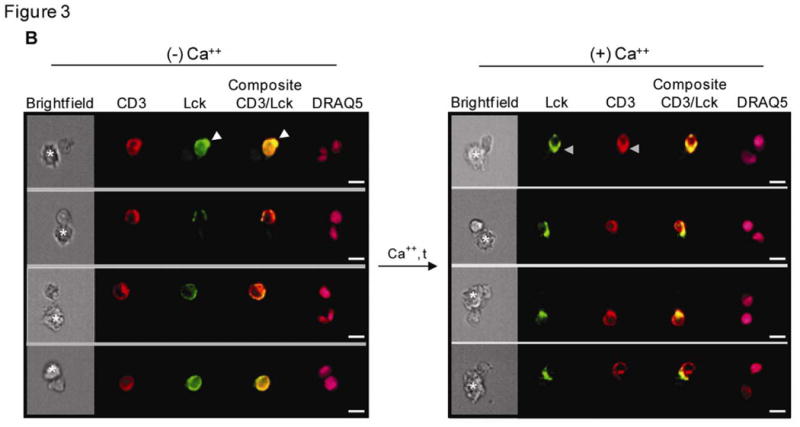
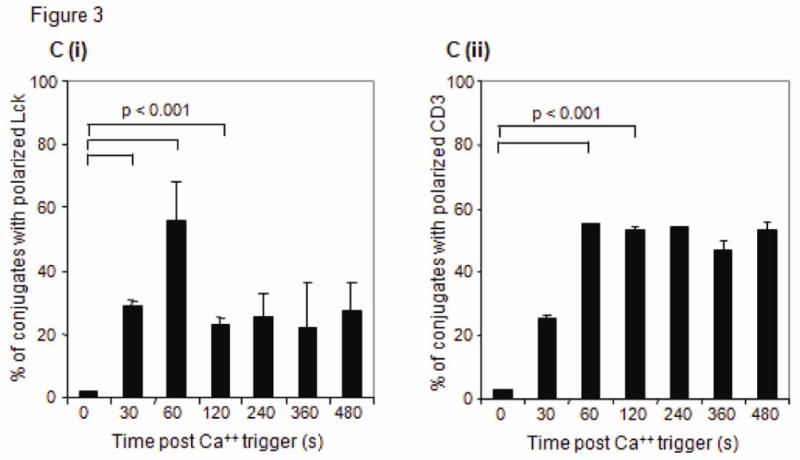
(A) Brightfield and fluorescence images of T cell/macrophage conjugates stained with CD3 on the T cell and nuclear dye (DRAQ5) on both T cell and APC were used to identify the area of the IS. The blue transparent mask depicts the IS region derived from 2 independent functions. Left panel: Using the nuclear image the valley function creates a region centered at the dimmest pixel between the 2 nuclei (pink) in a conjugate. Right panel: Using the CD3 image (red) the interface function creates a region in the T cell image at the point of contact between the two conjugated cells. (B) Multispectral images of CD3 (red) and Lck (green) proteins of single T cell conjugates. At initial times and without a Ca++ trigger, both Lck and CD3 cap away from the immune interface (white arrow). With a Ca++ trigger, both proteins rapidly translocate to the IS (grey arrow) of a T cell conjugate. Co-localization of CD3 and Lck (yellow) in the composite images, obtained 60 s after adding Ca++, reveals the development of a stable IS. Asterisks indicate the location of the APC in the conjugates. Scale bars, 10 μm. (C) Graphs show the mean (± s.d.) percent of T cell/macrophage conjugates with (i) Lck and (ii) CD3 polarized to the IS. Statistical analysis was performed on data from 3 independent experiments using the Student's t test.
3.3. Kinetics of Lck and CD3 translocations to the immunological synapse
At time zero before adding calcium, about 5-8% of T cells formed single cell conjugates. This increased to 7-8% after adding calcium. The proportion of conjugates in the samples remained stable across the specified time points, only varying by 11-14% in any experiment. We determined the time-dependent increase in the formation of conjugates with mature synapses by measuring either (i) Lck intensity in the Valley region or (ii) the ratio of Lck median pixel intensity of the T cell Interface region to Lck median pixel intensity of the entire T cell (Figure 4). Both analytical approaches revealed similar trends and showed that the efficiency of conjugate formation and Lck trafficking to the IS are Ca++-dependent (Figure 3B). At early times and before adding calcium both CD3 and Lck were capped in the area opposite to the IS. Fewer than 10% of the conjugates showed Lck concentrated in the IS. One minute after calcium trigger approximately 50% of the IS had matured with both Lck and CD3 accumulating at the IS (Figure 3C). Therefore Lck and CD3 colocalized at the IS. However, they had distinct dynamics after the first minute: recruitment of CD3 persisted and was stable for as long as data were collected (8 min), while Lck recruitment peaked at 1 min, but after that Lck remained at the IS only in a minority of cell conjugates, suggesting that there were subpopulations of T cells with distinct activation programs. This spatial and temporal pattern of Lck and CD3 movement are consistent with previous reports in human T cell lines (Ehrlich et al., 2002; Serrador et al., 2004).
4. Discussion
We describe a novel and statistically powerful method to delineate highly organized translocation dynamics of two or more individual proteins to the immune interface in response to a rapid TCR triggered event. Existing methods are often statistically challenged by smaller sample size for a specified level of power (Maxwell et al., 2008). Here we objectively collect a large sample size, and use a quantitative score to enumerate IS formation in the conjugates, thus enabling robust statistical analysis of a kinetic response. Quantitative imaging flow cytometry has been used to identify the IS of T cells formed with antigen-coated beads (Burbach et al., 2008), but has not previously been used to monitor the IS formed between cells.
Compared to previous microscopic methods of imaging the IS, this method has the value of statistically analyzing large numbers of events, chosen without bias. It also may be more physiologically relevant to capture the interaction of a T cell with an APC or target cell than to dissect the interaction of the T cell with a lipid bilayer or coated bead. In the future this technique could be used to correlate the quality of the IS with molecular or morphological events elsewhere in the cell, such as downstream signaling events (i.e., nuclear translocation of NFAT) or induction of apoptosis. However, the resolution here, which roughly corresponds to that of a 40× microscope, is much inferior to what can be achieved with state of the art microscopy. Moreover, live cell imaging avoids potential fixation artifacts, which we must keep in mind with this method. Each of these methods has complementary strengths for studying the IS.
With a mathematically defined contact site (IS) between 2 immune cells, it would be of further interest to determine whether imaging flow cytometry could further resolve the spatial distribution of IS proteins into mature synapse morphologies. The most common arrangement is the bull's eye pattern with a central supramolecular activation cluster (cSMAC), surrounded by the peripheral SMAC (pSMAC) and the distal actin ring (dSMAC) (Cemerski and Shaw, 2006; Saito and Yokosuka, 2006; Dustin, 2009). However, multifocal synapses, which show a single pSMAC enclosing multiple cSMACs, have also been observed between T cells and dendritic cells (Brossard et al., 2005). The cSMAC formed by CTLs has been reported to be bipartite, segregating a TCR signaling domain from a secretory domain for releasing effector molecules (Stinchcombe et al., 2001; Bossi and Griffiths, 2005; Makedonas et al., 2009). In some cases, the pSMAC may not completely close to form a tight-sealing ring to prevent leakage of cytotoxic molecules of cytokines out of the IS (Beal et al., 2008). In this study we only looked at two closely associated IS cSMAC components, CD3 and Lck. Future studies could co-stain for molecules that segregate into different compartments of the IS to determine whether the resolution of imaging cytometry could differentiate distinct cross-sectional distributions of molecules that concentrate at the cSMAC, pSMAC and dSMAC. Images from thousands of IS could be pooled, which could in principle overcome the lower resolution of individual images. As a first step it would be worth exploring whether the instrument could distinguish the IS distribution of molecules that are known to concentrate at the cSMAC (such as CD3) from molecules that congregate at the pSMAC (such as LFA-1).
This method could be used in the future to couple functional consequences, such as the translocation of transcription factors regulating T cell function (George et al., 2006; George et al., 2009), or polarized vesicular trafficking for targeted cytokine secretion at the IS (Maldonado et al., 2004; Huse et al., 2006) to the quality of the IS formed in individual activated cells. The same methodology could also be used to evaluate the recruitment and colocalization of molecules to other specialized functional areas within a single cell or in the interactions between antigen-specific cells and infected or transformed target cells or between a cell and a pathogen to focus on infectious synapses. The advantages of flow cytometry might make it possible to capture rare subpopulations of effector cells, such as tetramer-stained antigen-specific effector cells, interacting with their physiological primary target cells.
Acknowledgments
This work was supported by NIH S10 RR023459 (JL, NB), the Harvard Center for AIDS Research (JL, FA) and the Canadian Institutes for Health Research (FA).
Footnotes
Competing Interests Statement: The authors declare competing interests.
Publisher's Disclaimer: This is a PDF file of an unedited manuscript that has been accepted for publication. As a service to our customers we are providing this early version of the manuscript. The manuscript will undergo copyediting, typesetting, and review of the resulting proof before it is published in its final citable form. Please note that during the production process errors may be discovered which could affect the content, and all legal disclaimers that apply to the journal pertain.
References
- Anikeeva N, Somersalo K, Sims TN, Thomas VK, Dustin ML, Sykulev Y. Distinct role of lymphocyte function-associated antigen-1 in mediating effective cytolytic activity by cytotoxic T lymphocytes. Proc Natl Acad Sci U S A. 2005;102:6437–42. doi: 10.1073/pnas.0502467102. [DOI] [PMC free article] [PubMed] [Google Scholar]
- Beal AM, Anikeeva N, Varma R, Cameron TO, Norris PJ, Dustin ML, Sykulev Y. Protein Kinase Cθ regulates stability of the peripheral adhesion ring junction and contributes to the sensitivity of target cell lysis by CTL. J Immunol. 2008;181:4815–4824. doi: 10.4049/jimmunol.181.7.4815. [DOI] [PMC free article] [PubMed] [Google Scholar]
- Bossi G, Griffiths GM. CTL secretory lysosomes: biogenesis and secretion of a harmful organelle. Semin Immunol. 2005;17:87–94. doi: 10.1016/j.smim.2004.09.007. [DOI] [PubMed] [Google Scholar]
- Brossard C, Feuillet V, Schmitt A, Randriamampita C, Romao M, Raposo G, Trautmann A. Multifocal structure of the T cell - dendritic cell synapse. Eur J Immunol. 2005;35:1741–1753. doi: 10.1002/eji.200425857. [DOI] [PubMed] [Google Scholar]
- Bunnell SC, Hong DI, Kardon JR, Yamazaki T, McGlade CJ, Barr VA, Samelson LE. T cell receptor ligation induces the formation of dynamically regulated signaling assemblies. J Cell Biol. 2002;158:1263–1275. doi: 10.1083/jcb.200203043. [DOI] [PMC free article] [PubMed] [Google Scholar]
- Burbach BJ, Srivastava R, Medeiros RB, O'Gorman WE, Peterson EJ, Shimizu Y. Distinct regulation of integrin-dependent T cell conjugate formation and NF-κB activation by the adaptor protein ADAP. J Immunol. 2008;181:4840–4851. doi: 10.4049/jimmunol.181.7.4840. [DOI] [PMC free article] [PubMed] [Google Scholar]
- Cemerski S, Shaw A. Immune synapses in T-cell activation. Curr Opin Immunol. 2006;18:298–304. doi: 10.1016/j.coi.2006.03.011. [DOI] [PubMed] [Google Scholar]
- Crocenzi TS, Tretter CPG, Schwaab T, Schned AR, Heaney JA, Cole BF, Fisher JL, Ernstoff MS. Impaired cytolytic activity in peripheral blood T cells from renal cell carcinoma patients. Clinical Immunol. 2005;117:6–11. doi: 10.1016/j.clim.2005.06.010. [DOI] [PubMed] [Google Scholar]
- Dustin ML. The cellular context of T cell signaling. Immunity. 2009;30:482–92. doi: 10.1016/j.immuni.2009.03.010. [DOI] [PMC free article] [PubMed] [Google Scholar]
- Ehrlich LIR, Ebert PJR, Krummel MF, Weiss A, Davis MM. Dynamics of p56Lck translocation to the T cell immunological synapse following agonist and antagonist stimulation. Immunity. 2002;17:809–822. doi: 10.1016/s1074-7613(02)00481-8. [DOI] [PubMed] [Google Scholar]
- Gati A, Guerra N, Giron-Michel J, Azzarone B, Angevin E, Moretta A, Chouaib S, Caignard A. Tumor cells regulate the lytic activity of tumor-specific cytotoxic T lymphocytes by modulating the inhibitory natural killer receptor function. Cancer Res. 2001;61:3240–3244. [PubMed] [Google Scholar]
- George TC, Fanning SL, Fitzgeral-Bocarsly P, Medeiros RB, Highfill S, Shimizu Y, Hall BE, Frost K, Basiji D, Ortyn WE, Morrissey PJ, Lynch DH. Quantitative measurement of nuclear translocation events using similarity analysis of multispectral cellular images obtained in flow. J Immunol Methods. 2006;311:117–129. doi: 10.1016/j.jim.2006.01.018. [DOI] [PubMed] [Google Scholar]
- George TC, Morrissey PJ, Cui C, Singh S, Bocarsly PF. Measurement of cytoplasmic to nuclear translocation. In: Robinson JP, editor. Current Protocols in Cytometry. John Wiley and Sons, Inc.; New York: 2009. pp. 9.28.1–9.28.15. [DOI] [PubMed] [Google Scholar]
- Grakoui A, Bromley SK, Sumen C, Davis MM, Shaw AS, Allen PM, Dustin ML. The immunological synapse: a molecular machine controlling T cell activation. Science. 1999;285:221–227. doi: 10.1126/science.285.5425.221. [DOI] [PubMed] [Google Scholar]
- Groves JT, Dustin ML. Supported planar bilayers in studies on immune cell adhesion and communication. J Immunol Methods. 2003;278:19–32. doi: 10.1016/s0022-1759(03)00193-5. [DOI] [PubMed] [Google Scholar]
- Holdorf AD, Lee KH, Burack R, Allen PM, Shaw AS. Regulation of Lck activity by CD4 and CD28 in the immunological synapse. Nature Immunol. 2002;3:259–264. doi: 10.1038/ni761. [DOI] [PubMed] [Google Scholar]
- Huse M, Lillemeier BF, Kuhns MS, Chen DS, Davis MM. T cells use two directionally distinct pathways for cytokine secretion. Nature Immunol. 2006;7:247–255. doi: 10.1038/ni1304. [DOI] [PubMed] [Google Scholar]
- Iwashima M, Irving BA, van Oers NS, Weiss A. Sequential interactions of the TCR with two distinct cytoplasmic tyrosine kinases. Science. 1994;263:1136–1139. doi: 10.1126/science.7509083. [DOI] [PubMed] [Google Scholar]
- Kane LP, Lin J, Weiss A. Signal transduction by the TCR for antigen. Curr Opin Immunol. 2000;12:242–249. doi: 10.1016/s0952-7915(00)00083-2. [DOI] [PubMed] [Google Scholar]
- Makedonas G, Banerjee PP, Pandey R, Hersperger AR, Sanborn KB, Gareth ADH, Orange JS, Betts MR. Rapid up-regulation and granule-independent transport of perforin to the immunological synapse define a novel mechanism of antigen-specific CD8+ T cell cytotoxic activity. J Immunol. 2009;182:5560–5569. doi: 10.4049/jimmunol.0803945. [DOI] [PMC free article] [PubMed] [Google Scholar]
- Maldonado RA, Irvine DJ, Schreiber R, Glimcher LH. A role for the immunological synapse in lineage commitment of CD4 lymphocytes. Nature. 2004;431:527–532. doi: 10.1038/nature02916. [DOI] [PubMed] [Google Scholar]
- Maxwell SE, Kelley K, Rausch JR. Sample size planning for statistical power and accuracy in parameter estimation. Ann Rev Psychol. 2008;59:537–563. doi: 10.1146/annurev.psych.59.103006.093735. [DOI] [PubMed] [Google Scholar]
- Medeiros RB, Burbach BJ, Mueller KL, Srivastava R, Moon JJ, Highfill S, Peterson EJ, Shimizu Y. Regulation of NF-κB activation in T cells via association of the adaptor proteins ADAP and CARMA1. Science. 2007;316:754–758. doi: 10.1126/science.1137895. [DOI] [PubMed] [Google Scholar]
- Monks CR, Freiberg H, Sciaky N, Kupfer A. Three-dimensional segregation of supramolecular activation clusters in T cells. Nature. 1998;395:82–86. doi: 10.1038/25764. [DOI] [PubMed] [Google Scholar]
- Mossman KD, Campi G, Groves JT, Dustin ML. Altered TCR signaling from geometrically repatterned immunological synapses. Science. 2005;310:1191–1193. doi: 10.1126/science.1119238. [DOI] [PubMed] [Google Scholar]
- Potter TA, Grebe K, Freiberg B, Kupfer A. Formation of supramolecular activation clusters on fresh ex vivo CD8+ T cells after engagement of the T cell antigen receptor and CD8 by antigen-presenting cells. Proc Natl Acad Sci U S A. 2001;98:12624–9. doi: 10.1073/pnas.221458898. [DOI] [PMC free article] [PubMed] [Google Scholar]
- Saito T, Yokosuka T. Immunological synapse and microclusters: the site for recognition and activation of T cells. Curr Opin Immunol. 2006;18:305–313. doi: 10.1016/j.coi.2006.03.014. [DOI] [PubMed] [Google Scholar]
- Saverino D, Tenca C, Zarcone D, Merlo A, Megiovanni AM, Valle MT, Manca F, Grossi CE, Ciccone E. CTLA-4 (CD152) inhibits the specific lysis mediated by human cytolytic T lymphocytes in a clonally distributed fashion. J Immunol. 1999;162:651–658. [PubMed] [Google Scholar]
- Seed B, Xavier R. Spinophilin and the immune synapse. J Cell Biol. 2008;181:181–183. doi: 10.1083/jcb.200803120. [DOI] [PMC free article] [PubMed] [Google Scholar]
- Serrador JM, Cabrero JR, Sancho D, Mittelbrunn M, Urzainqui A, Sanchez-Madrid F. HDAC6 deacetylase activity links the tubulin cytoskeleton with immune synapse organization. Immunity. 2004;20:417–428. doi: 10.1016/s1074-7613(04)00078-0. [DOI] [PubMed] [Google Scholar]
- Sims TN, Soos TJ, Xenias HS, Thaler DB, Hofman JM, Waite JC, Cameron TO, Thomas VK, Varma R, Wiggins CH, Sheetz MP, Littman DR, Michael LD. Opposing effects of PKCθ and WASp on symmetry breaking and relocation of the immunological synapse. Cell. 2007;129:773–785. doi: 10.1016/j.cell.2007.03.037. [DOI] [PubMed] [Google Scholar]
- Somersalo K, Anikeeva N, Sims TN, Thomas VK, Strong RK, Spies T, Lebedeva T, Sykulev Y, Dustin ML. Cytotoxic T lymphocytes form an antigen-independent ring junction. J Clin Invest. 2004;113:49–57. doi: 10.1172/JCI200419337. [DOI] [PMC free article] [PubMed] [Google Scholar]
- Stinchcombe JC, Bossi G, Booth S, Griffiths GM. The immunological synapse of CTL contains a secretory domain and membrane bridges. Immunity. 2001;15:751–761. doi: 10.1016/s1074-7613(01)00234-5. [DOI] [PubMed] [Google Scholar]
- Stinchcombe JC, Majorovits E, Bossi G, Fuller S, Griffiths GM. Centrosome polarization delivers secretory granules to the immunological synapse. Nature. 2006;443:462–465. doi: 10.1038/nature05071. [DOI] [PubMed] [Google Scholar]
- Wulfing C, Purtic B, Klem J, Schatzle JD. Stepwise cytoskeletal polarization as a series of checkpoints in innate but not adaptive cytolytic killing. Proc Natl Acad Sci U S A. 2003;100:7767–7772. doi: 10.1073/pnas.1336920100. [DOI] [PMC free article] [PubMed] [Google Scholar]
- Yeh JH, Sidhu SS, Chan AC. Regulation of a late phase of T cell polarity and effector functions by Crtam. Cell. 2008;132:846–859. doi: 10.1016/j.cell.2008.01.013. [DOI] [PubMed] [Google Scholar]
- Yokosuka T, Sakata-Sogawa K, Kobayashi W, Hiroshima M, Hashimoto TA, Tokunaga M, Dustin ML, Saito T. Newly generated T cell receptor microclusters initiate and sustain T cell activation by recruitment of ZAP70 and SLP-76. Nature Immunol. 2005;6:1253–1262. doi: 10.1038/ni1272. [DOI] [PubMed] [Google Scholar]