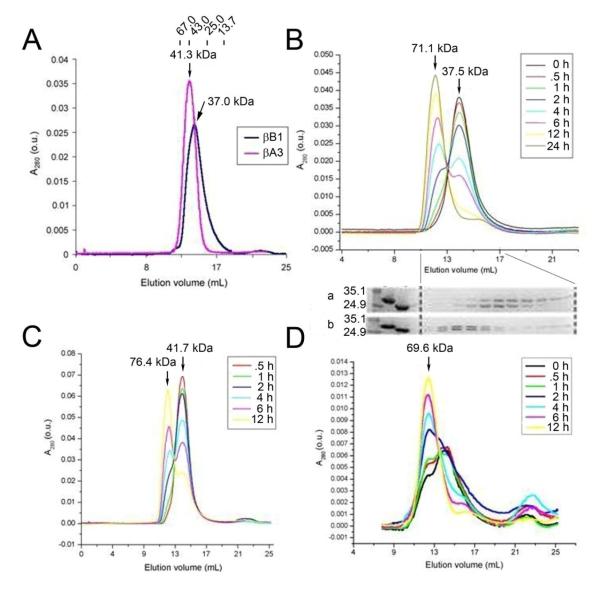
Figure 2.
Size-exclusion chromatography of mouse βB1-crystallin and human βA3-crystallins. Panel A. Size-exclusion chromatography of mouse βB1-crystallin and human βA3-crystallin, each at 1 mg/mL. The elution points of molecular weight standards (albumin 67.0 kDa, ovalbumin 43.0 kDa, chymotrypsinogen 25.0 kDa, and ribonuclease A 13.7 kDa) are shown at the top for reference. Molecular weights of βB1- and βA3-crystallins were calculated to be 37.0 kDa and 41.3 kDa, respectively. Panel B. Size-exclusion chromatography of βB1- and βA3-crystallins mixed at 1 mg/mL. Protein concentration was monitored by absorbance at 280 nm. Chromatograms obtained for each time point after initial mixing of the two crystallins are overlaid to show the trend. Molecular weights of the two peaks at different time points are calculated from the standard curve of the sizing column and averaged to be 71.1 kDa and 37.5 kDa, respectively. A stepwise increase in the higher-molecular-weight species (71.1 kDa) and a stepwise decrease in the lower-molecular-weight species (37.5 kDa) were observed. SDS-PAGE of the fractions from chromatography runs (a) 0 hr and (b) 24 hr are aligned on the bottom to show contents of the peaks. The first lane refers to protein markers (35.1 and 24.9 kDa). The second and third lanes refer to βB1- and βA3-crystallin standards, respectively. Panels C and D. Size-exclusion chromatography of βB1- and βA3-crystallins mixed at (C) 2 mg/mL and (D) 0.5 mg/mL. Averaged molecular weight of each peak is indicated, except for the lower-molecular-weight species in (D), which is indistinct. The small peak observed at the end of each run corresponds to a molecular mass that is lower than the column volume, and is therefore not analyzed.

