

Abstract
In the CNS, microglia are the primary targets of HIV infection. In this study, we investigated the effect of activation of the innate antiviral receptors TLR3 and TLR4 on HIV infection of primary human microglia, as well as microglial cell signaling and gene expression. Ligands for both TLR3 and TLR4 potently inhibited HIV replication in microglia through a pathway requiring IRF3. Surprisingly, a remarkably similar pattern of cell signaling and gene expression was observed in TLR3- and TLR4-activated microglia, suggesting a relatively minor role for MyD88 following TLR4 activation in these cells. HIV did not activate IRF3 but rather decreased IRF3 protein, indicating that HIV does not activate TLR3 or RIG-like helicases in microglia. Taken together, these results indicate that activation of TLR3 or TLR4 will elicit antiviral immunity, in addition to inducing proinflammatory responses. We suggest that a balanced expression between inflammatory and innate immune genes might be achieved by IRF3 overexpression.
Introduction
Cells of the immune system bear toll-like receptors (TLRs) and respond to TLR ligands by expressing a number of genes involved in innate and adaptive immune responses against microbial infection. The TLRs that recognize viral pathogen-associated molecular patterns (PAMPs) are TLR3 (dsRNA), TLR7/8 (single stranded RNA) and TLR9 (DNA)(Akira et al., 2006;Kawai & Akira, 2007)(O'Neill, 2008). TLR3 can also be activated by synthetic dsRNA, poly-riboinosinic-ribocytidylic acid (PIC). In addition to innate immunity, dsRNA could also boost adaptive immunity against viral infection, for example, by cross-priming viral-specific CD8+ CTLs (Seya et al., 2003;Seya et al., 2006;Salio & Cerundolo, 2005). Indeed, TLR ligands are used as adjuvants for the formation of an effective adaptive immune response. Whether HIV can form viral PAMPs that activate TLRs in microglia is unknown, but there is evidence that HIV can activate TLR7/8, and possibly TLR9, in dendritic cells and macrophages (Beignon et al., 2005;Heil et al., 2004). Of the CNS cells, both microglia and astrocytes of rat, mouse and human origin have been extensively studied for TLR-mediated activation (Bsibsi et al., 2002;Carpentier et al., 2008;McKimmie & Fazakerley, 2005). TLR3 is the predominant TLR on astrocytes that mediates activation of antiviral, as well as inflammatory genes (Bsibsi et al., 2006;Carpentier et al., 2005;Farina et al., 2005;Rivieccio et al., 2005), and treatment of astrocytes with PIC elicits strong antiviral activity against HIV and HCMV(Rivieccio et al., 2006;Suh et al., 2007). Microglia express all known TLRs and respond robustly to both PIC (TLR3 ligand) and LPS (TLR4 ligand)(Carpentier et al., 2008;Jack et al., 2005;Town et al., 2006). Whether the activation of these immune receptors in microglia results in suppression of intracellular viral replication is unknown. The detailed intracellular signal activation cascades as well as comprehensive gene expression studies have not been performed, especially with respect to TLR3 activation.
Microglia are CNS immune cells that play a major role in the antiviral response during microbial invasion and infection (Rivest, 2003;Dickson et al., 1991). Microglia also serve as the major targets of infection by HIV in the CNS, and are the prime instigator of HIV-associated neurocognitive disorders (HAND) including HIV-dementia (HAD) (Dickson & Lee, 1996;Kaul et al., 2001;Gonzalez-Scarano & Martin-Garcia, 2005;Persidsky & Gendelman, 2003). The interactions between microglia and the HIV virion, HIV products, or inflammatory mediators generated during infection, are thought to lead to the cascades of events in the CNS that ultimately results in neuronal damage (Ellis et al., 2007). The properties of microglia that contribute to this neurodegenerative process in HAND, as well as several other chronic neurodegenerative disorders, include the presence of cell surface receptors that render them highly reactive to a variety of innate and adaptive immunological stimuli (Kreutzberg, 1996;Perry & Gordon, 1988;Streit et al., 2005). For example, microglia are exquisitely sensitive to the TLR4 ligand, LPS, and are likely the only cell type that can effectively respond to LPS in the CNS(Laflamme & Rivest, 2001). LPS is a potent activator of microglia that induces proinflammatory cytokines and reactive oxygen radicals that have been shown to cause death of neurons and oligodendrocytes in a number of experimental systems (Chao et al., 1992;Cai et al., 2003;Lehnardt et al., 2002). However, microglial activation does not always lead to neurodegeneration, as microglia can also generate growth factors (including brain-derived neurotrophic factors and insulin-like growth factors) and anti-inflammatory cytokines that can contribute to neuroprotection (Gordon, 2003;Hanisch & Kettenmann, 2007;Schwartz et al., 2006). In addition, there is evidence that proinflammatory cytokines and LPS can elicit an antiviral program in microglia (Lokensgard et al., 1997; Si et al., 2004 and unpublished). Currently, the heterogeneity of microglia with respect to their activation phenotypes and their role in disease progression and repair is an area of active investigation.
Investigating microglial TLRs is particularly relevant to HIV diseases. For example, recent studies have demonstrated significant levels of plasma LPS that exist in HIV+ individuals (Brenchley et al., 2006), which might be a significant modifier of the HIV diseases. Specifically, Ancuta et al., have reported that the levels of plasma LPS correlate with the degree of monocyte activation and the presence of HAD in patients with AIDS (Ancuta et al., 2008). LPS has been found to promote glial cell activation and HIV expression in a HIV-transgenic mouse model(Sun et al., 2008). LPS has also been found to promote transmigration of HIV+ monocytes into the brain (Wang et al., 2008). These findings together suggest that HIV-infected individuals are at risk for “activating” peripheral and brain macrophages through TLR4.
In the current study, we investigated the role of TLR3 in microglial activation with respect to its intracellular signal activation, gene induction and antiviral activity, using HIV as a target virus. Since TLR4 is the only other member of the TLR family that can also activate human IFNβ gene expression through activation of IRF3 (Hiscott et al., 2006), we compared microglial responses to TLR3 activation with TLR4 activation. To determine if HIV infection activates IRF3, we also examined HIV-infected microglial responses. The results demonstrated that while there was no significant degree of IRF3 activation in HIV-infected microglia, HIV infection causes decrease in the amount of IRF3. On the other hand, triggering TLR3 or TLR4 by PIC or LPS induced strong anti-HIV activity in microglia. Remarkably, TLR3 and TLR4 activation induced the same intracellular cell activation pathways and induced essentially the same sets of genes in microglia, including proinflammatory cytokines, chemokines and IFN-stimulated genes (ISGs). Among the minor differences noted were slightly higher induction of many ISGs by PIC compared to LPS, and slightly higher induction of many non-IRF3-dependent genes by LPS relative to PIC. These results together demonstrate that TLR3 and TLR4 are the major innate antiviral immune receptors in microglia but that inappropriate activation of these TLRs could also result in a pathogenic outcome through induction of the chronic inflammatory state. Since TLR ligands are being actively considered for antiviral and adjuvant therapy, the latter will be an important issue to address in the context of the CNS environment.
Materials and Methods
Human fetal microglial culture
Human CNS cell cultures were prepared from human fetal abortuses as described (Lee et al., 1992;Suh et al., 2005). All tissue collection was approved by the Albert Einstein College of Medicine Institutional Review Board. Primary mixed CNS cultures were prepared by enzymatic and mechanical dissociation of the cerebral tissue followed by filtration through nylon meshes of 230- and 130-μ pore sizes. Single cell suspension was plated at 1-10 × 106 cells per ml in DMEM (Cellgro: Dulbecco's modified Eagle medium) supplemented with 5% fetal calf serum (FCS: Gemini Bio-products, Woodland, CA), penicillin (100U/ml), streptomycin (100μg/ml) and fungizone (0.25μg/ml) (Gibco) for 2 weeks, and then microglial cells were collected by aspiration of the culture medium. Monolayers of microglia were prepared in 60-mm or 100mm tissue culture dishes at 1 × 10⁷ cells per 10 ml medium or in 96-well tissue culture plates at 104 per 0.1 ml medium. Two to four hours later, cultures were washed twice to remove non-adherent cells (neurons and astrocytes). Microglial cultures were highly pure consisting of > 98% CD68+ cells.
U1 cells (human monocytic cells)
The U1 cell line containing two proviral copies of HIV was obtained through the AIDS Research and Reference Reagent Program, Division of AIDS, NIAID, NIH. U1 cells were cultured in complete RPMI 1640 (supplemented with 2 mM L-glutamine) supplemented with 10% FCS, penicillin-streptomycin (100 μg/ml). Cells were seeded in 100 mm tissue culture dishes at a concentration of 1× 10⁷ cells.
HIV viruses and microglial infection
HIVBal obtained from the AIDS Research and Reference Reagent Program and propagated in peripheral blood mononuclear cells (PBMC) as previously described (Si et al., 2002). HIVADA was generated by transfecting 293 T cells with pHIVADA obtained from Dr. Mario Stevenson, as previously described(Si et al., 2002). These viruses infect microglia through R5 env-CCR5 mediated fusion. Microglia were exposed to 20- to 40-ng/ml p24 HIV for 16 h at 37°C, washed, and incubated with fresh medium. Microglial cultures were also exposed to single-cycle VSVg env HIV. Single-cycle competent, vesicular stomatitis virus (VSVg) env glycoprotein pseudotyped HIV was produced by co-transfecting 293T cells with pNL4.3 (Nef-intact, Vpr-intact, Env-deficient) and pVSVg env (Federico et al., 2001). The resulting viruses enter the cells through the VSVg env-mediated pathway. Microglia were infected with ∼ 40 ng/ml p24 viral input that resulted in 25% to 50% cell infection at 3 days as determined by p24 immunocytochemistry, unless otherwise stated. Mock supernatants were prepared by treating cells in the same manner without viral plasmids or with pVSVg env only. For microarray and real time RT-PCR (Q-PCR), cells were exposed to high concentrations (150-200 ng/ml p24) of VSVg env HIV and RNA harvested at 24 h.
Role of IRF3 in PIC-induced HIV suppression was examined by over-expression of DN- or WT-IRF3 using adenovirus-mediated gene transfer, as previously described (Rivieccio et al., 2005). Briefly, microglia were infected with adenovirus carrying DN-IRF3 or WT IRF3 plasmids at 10 multiplicity of infection (MOI) for 3D. Microglia were then infected with VSVg env HIV with or without PIC for an additional 3D for Western blot analysis. Overexpression of IRF3 was confirmed by Western blot for the WT or N-terminal truncated (DN) IRF3. For Q-PCR, microglia were infected with HIVADA with or without PIC for 3 h. Overexpression of IRF3 was confirmed by Q-PCR.
Cell treatment with stimulants and virus
PIC and LPS were purchased from Sigma-Aldrich (St. Louis, MO). Recombinant human IFN-γ (specific activity, 1 ng = 20 U) and IL-1β were purchased from Peprotech (Rocky Hill, NJ). IFN-β was purchased from PBL Biomedical Laboratories (Piscataway, NJ; 1 ng = 80 U). Microglial cultures in complete medium (DMEM + 5% FCS) were treated with PIC at 10 μg/ml, LPS at 100 ng/ml or other cytokines at 10 ng/ml. When microglia were stimulated with PIC or LPS in the presence of HIV, input virus was washed out 24 h later and cell stimulants were added back. TLR ligands were added together with HIV (co-treatment) unless stated otherwise. The TLR9 ligand CpG ODN and control GpC ODN were obtained from TIB Molbiol, MA, and were used at a concentration of 5 uM.
Extraction of nuclear proteins
Nuclear extracts were prepared using a modified Dignam method (Si et al., 2004). Buffers were supplemented with 1 mM PMSF, 1 mM DTT, and a protease inhibitor mixture (Roche, Indianapolis, IN). Cells (∼1 × 10⁶) were scraped off in 1 mM PMSF/PBS and centrifuged. Pellets were resuspended in low salt buffer (10 mM HEPES (pH 7.9), 1.5 mM MgCl2, and 10 mM KCl), and allowed to sit on ice before addition of Igepal CA-630 (Sigma-Aldrich). Samples were again pelleted and resuspended in high salt buffer (20 mM HEPES (pH 7.9), 25% glycerol, 420 mM NaCl, and 1.5 mM MgCl2); samples were rocked gently before final centrifugation. The protein of nuclear extracts was quantified using the Bradford assay.
Western blot analysis
Briefly, microglial cultures in 60 mm dishes were scraped into lysis buffer (10 mM Tris-HCl [pH 8.8], 50 mM NaCl, 0.5 mM Na3VO4, 30 mM Na4P2O7, 50 mM NaF, 2 mM EDTA, 1% Triton X-100) at various time points. Thirty to seventy micrograms of protein was separated by 10% or 12% sodium dodecyl sulfate-polyacrylamide gel electrophoresis and then transferred to polyvinylidene difluoride membrane. The blots were blocked in Tris-buffered saline-0.1% Tween-20 containing 5% nonfat milk and then incubated with antibodies at 4°C for 16 h (Suh et al., 2007). Primary Antibodies included: IRF3 (C terminal; rabbit IgG which recognizes both the endogenous and N-terminally truncated mutant IRF3), 1/500; C/EBPβ and IKKε, 1:1000; (Santa Cruz Biotechnology); pJNK, pErk, pP38, pY-Stat1, pSer-Stat1, total Stat1, pAkt, pGSK3β and p-eIF2α 1/1000 (Cell Signaling); anti-p24 gag, 1/500 (DakoCytomation); IDO, 1/3000 (gift of Osamu Takikawa) (Suh et al., 2007) and rabbit anti-viperin/cig5, 1/2000 (Gift of Keh Chuang Chin) (Chin & Cresswell, 2001;Rivieccio et al., 2006). The secondary antibody was horseradish peroxidase-conjugated anti-mouse or anti-rabbit IgG and was used at 1:2,000 to 1:10,000 for 1 h at room temperature. Signals were developed using enhanced chemiluminescence (Pierce Biotechnology, Rockford, IL). All blots were reprobed for vinculin (117 kDa) or β-actin using antibodies from Santa Cruz to control for protein loading. Densitometric analysis was performed using Scion NIH Image software (Scion, Frederick, MD).
RNA interference with TLR3-specific siRNA
Microglia in 60 mm dishes were transfected with 10 nM or 30 nM human TLR3-specific small interfering RNA (siRNA) or control non-targeting siRNA (Dharmacon, Chicago, IL) with TransIT-TKO transfection reagents from Mirus, following the manufacturer's instructions(Suh et al., 2007). After incubation for 48 to 72 h, cells were washed with fresh medium and then treated with PIC for 6 h. Real-time PCR was performed to confirm the expression of TLR3, IFNβ, IDO and viperin.
Real time PCR
Quantitative real-time reverse transcription-PCR (Q-PCR) was performed as described previously (Suh et al., 2007;Rivieccio et al., 2006;Rivieccio et al., 2005), using porphobilinogen deaminase (PBDA) or GAPDH as internal controls. Primer sequences for TLR3, and IFN-β, IDO and viperin were published previously (Rivieccio et al., 2006;Suh et al., 2007). Sequences of primers were: IRF3 [forward: caagaggctcgtgatggtc; reverse: ctacccgggccatttctac], TNFα [forward ggcgtggagctgagagataac; reverse ggtgtgggtgaggagcacat], and IP-10 [forward, gaatcgaaggccatcaagaa; reverse, gctcccctctggttttaagg]. Briefly, total RNA was extracted from microglia in culture with TRIzol (Invitrogen Life Technologies), following the manufacturer's instructions. PCR was performed using a SYBR green PCR mix and conducted with the ABI Prism 7900HT (Applied Biosystems). All values were expressed as the increase relative to the expression of PBDA. The mean value of the replicates for each sample was calculated and expressed as the cycle threshold (CT; cycle number at which each PCR reaches a predetermined fluorescence threshold, set within the linear range of all reactions). The amount of gene expression was then calculated as the difference between the CT of the sample for the target gene and the mean CT of that sample for the endogenous control.
Human cDNA 28k microarrays
Microglia plated at 1 × 10⁶ cells/100 mm dish were stimulated with 10 μg/ml PIC or 100 ng/ml LPS for 6 h or 16 h in DMEM containing 5% FCS. Microglia were also infected with 150 ng/ml of VSVg env HIV for 24 hrs. Cell harvest, RNA isolation, and microarrays (obtained from the Albert Einstein College of Medicine cDNA Microarray Facility: http://microarray1k.aecom.yu.edu) were performed as described previously (Rivieccio et al., 2006;John et al., 2005;Rivieccio et al., 2005). Approximately 5 μg of total RNA was used for T7 linear amplification. Linear amplification of total RNA and subsequent fluorescent labeling of corresponding cDNA was carried out using the MessageAmp T7 linear amplification kit (Ambion) and cDNA labeling protocols developed at the AECOM Microarray Facility. Hybridization to cDNA arrays was carried out overnight at 50°C in a buffer containing 30% formamide, 3× SSC, 0.75% SDS and 100 ng of human Cot-1 DNA. Following hybridization, slides were briefly washed with a solution of 1× SSC, 0.1% SDS, then washed for 20 min at room temperature in 0.2× SSC, 0.1% SDS and 20 min at room temperature in 0.1× SSC (without SDS). Independent measurements of Cy5 and Cy3 signal intensity and background were generated for each cDNA element using a Genepix 4000B scanner (Axon Instruments) and Scanalyze software (http://rana.lbl.gov/EisenSoftware.htm). The ratio of the fluorescence intensities of the two dyes represented a measure of differential gene expression between the individual treatments and their corresponding controls Cutoff values were established as Cy5:Cy3 ratio >1.5 or <0.67 and as net signal intensity more than three times background in one or both channels. All elements not satisfying both criteria were discarded. Controls included reversing the fluorochromes and labeling the same sample using both Cy3 and Cy5.
Statistical Analysis
Results shown are representative of two to five separate experiments using cells from different brain cases. For statistical analysis of the data within individual experiments, Student's t-test was performed to compare differences between the treatment and control groups. In addition, a one-way analysis of variance (ANOVA) was performed to determine whether there were significant differences between conditions. When this analysis indicated significance (<0.05), Tukey post test was performed to determine which conditions were significantly different from each other.
Results
TLR3 and TLR4 activation suppresses HIV in microglia (Figure 1A and B)
Figure 1. Anti-HIV activity of microglia activated by TLR3 and TLR4 ligands.

(A) PIC effectively suppresses spreading HIV infection in primary human microglia. Microglia in 96 well plates in four replicates were exposed to HIVBaL ± PIC (10 μg/ml) in DMEM 5%FCS, as described in Materials and Methods. Cultures were examined 16 days after infection by immunocytochemistry for HIV p24 with nitroblue tetrazolium (blue) as chromogen. While HIVp24+ microglia were numerous (BaL), they were not detected in PIC-treated cultures (PIC). The same cell culture supernatants were examined for HIV p24 by ELISA and showed complete suppression of HIV production by PIC (panel to the right). (B) PIC and LPS suppress replication of VSVg env NL4-3 in microglia: To synchronize the intracellular HIV life cycle, microglia were infected with high concentrations of single cycle, env-pseudotyped HIV (pNL4-3) with or without PIC (10 μg/ml) or LPS (10 ng/ml), and viral production was examined 3 days later by HIV p24 immunocytochemistry. As shown, HIV p24+ cells were dramatically reduced by PIC or LPS treatment (*** p <0.001). (C) Effect of TLR3 or TLR4 activation on HIV expression in U1 cells: U1 cells were stimulated for 2 days with PIC, LPS, IL-1β (10 ng/ml) or PMA (10 nM) alone or in combinations as shown. Western blot analysis was performed for HIV p24 expression, with vinculin as a loading control. While PIC induced little or no HIV p24, LPS and IL-1β induced high levels of HIV p24. Also, PIC did not suppress LPS or IL-1-induced HIV expression but rather increased it. PMA was used as a positive control for HIV induction in U1 cells. (D) The effect of the TLR9 ligand CpG ODN on microglial HIV expression: Microglia were pretreated for 1 h with 5 μM of CpG ODN (TLR9 ligand) or the control GpC ODN (both with phosphorothioate modification to increase half-life), and then infected with VSVg HIV for addition 50 h. HIV gag expression was examined by Western blot analysis. HIV expression was inhibited not only by the TLR9 ligand CpG ODN, but also by control GpC ODN. In contrast, viperin induction by HIV was not inhibited by either ODN. These results were repeated with cell-based ELISA (panel to the right) in which p24-immunostained, nitroblue-tetrazolium-positive microglia in 96 well plates were read using an ELISA reader at OD595. Results from triplicate wells are shown (** p <0.01).
We examined the role of TLR3 and TLR4 ligands in modulation of HIV expression in microglia. Primary human fetal microglia were treated or not with PIC (10 μg/ml) and immediately infected with the R5 strain of HIV (BaL)(Figure 1A). HIV gag in culture supernatants was measured by ELISA and the cells were also immunostained for HIV gag. PIC nearly completely inhibited HIV gag expression in microglia. Since it takes 1-3 weeks for productive infection to occur in the spreading infection model (Lee et al., 1993;Si et al., 2004), we adopted VSVg env HIV (NL4.3, Nef-intact, Vpr-intact) for synchronized single cycle infection of microglia, in which HIV gag becomes detectable within 1-2D (Figure 1B). Using VSVg env HIV, we were able to demonstrate anti-HIV activity of PIC in more than 20 independent experiments. The suppression ranged from near complete to partial when PIC was co-administered with HIV, with pretreatment resulting in stronger suppression (not shown). For example, by cell-based ELISA assay for HIVgag, we observed 45%, 57%, 63%, 92% and 96% of HIV inhibition on day 4 in PIC-co-treated microglial cultures compared to cultures exposed to HIV alone. Unexpectedly, the TLR4 ligand LPS also suppressed HIV in microglia (Figure 1B). The degree of inhibition also ranged from complete to partial (∼ 60%).
Effect of TLR3 or TLR4 activation on HIV expression in U1 cells (Figure 1C)
TLRs activate the antiviral pathway in host cells by inducing ISGs (Sen & Peters, 2007), many of which act by suppressing viral gene transcription or translation. We therefore tested whether PIC or LPS could suppress HIV expression in U1 cells, a human monocytic cell line with stably integrated copies of HIV provirus, thus a post-integration latency model. U1 cells were treated with PIC, LPS or IL-1β, individually or in combination, and Western blot was performed to measure HIV gag expression. The results showed that while PIC alone induced negligible amounts of HIV gag, LPS and IL-1β induced higher amounts of HIV expression and PIC did not suppress LPS- or IL-1β-induced HIV expression in U1 cells (Figure 1C). Furthermore, PIC at times slightly enhanced HIV expression induced by LPS or IL-1β (Figure 1C and data not shown). These results show that effects of the TLR ligands and IL-1 on HIV expression are different depending on the HIV infection model used.
TLR9 ligand CpG ODN also suppresses HIV (Figure 1D)
In addition to TLR3 and TLR4, we also tested the role of the TLR9 ligand CpG ODN in microglial HIV expression and found it to be suppressive. However, the control GpC ODN also suppressed HIV expression in microglia, suggesting that the antiviral effect of CpG ODN was mediated by phosphorothioate modification rather than through activating TLR9.
TLR3 and TLR4 ligands activate IRF3 in microglia (Figure 2A)
Figure 2. Microglial cell signaling pathway activation by PIC or LPS.

(A) Nuclear proteins from microglial cultures stimulated with PIC or LPS for various time periods were analyzed by Western blot. Nuclear IRF3 was detected early, whereas pY-Stat1 was detectable 6h after stimulation with PIC. (B) Western blot was performed using whole cell lysates. PIC activates all three MAP kinases within 10 min. (C) Microglial cultures were treated with PIC (10 ug/ml), LPS (100 ng/ml), IFNβ (10 ng/ml) or IFNγ (10 ng/ml) for 20 min to 6h and Western blot analysis was performed for p-Erk, pS-Stat1, p-Akt and pSer9-GSK3β, as described in the Materials and Methods. While PIC and LPS activation profiles are similar, IFNβ and IFNγ show distinctly different cell activation profiles. See text for details. (D) Microglia were subjected to longer (6h to 3D) treatment with LPS or PIC, or IFNβ or IFNγ and their protein expression was analyzed in two separate blots. Transcription factors, Stat1 and C/EBPβ, as well as the inducible IRF3 kinase, IKKε (also called IKKi), were induced similarly by LPS or PIC. LPS and PIC also showed similar induction of viperin (cig5) and IDO with respect to the amounts and kinetics. On the other hand, IKKε and viperin were induced preferentially by IFNβ, while IDO was induced preferentially by IFNγ. Total Stat1 and C/EBPβ were induced by both IFNs. Whole cell lysates were used for Western. The 37 kD and 20 kD mark the putative activatory and inhibitory C/EBPβ isoforms, respectively.
Ligand binding to TLR3 or TLR4 recruits the TIR-domain containing adaptor TRIF which then phosphorylates IRF3 through the activation of recently identified IRF3 kinases, TBK1 and IKKε (also called IKKi) (Sharma et al., 2003;Fitzgerald et al., 2003). The recruitment of TRIF to TLR3 or TLR4 also activates the canonical IKKs (α, β and γ), which then activate NF-κB and MAP kinases. NF-κB, MAP kinases and IRF3 are all required to activate human IFNβ gene (primary response gene) (Enoch et al., 1986;Lenardo et al., 1989). Secreted IFNβ then activates the Jak/Stat pathway in an autocrine manner resulting in the transcriptional induction of ISGs (secondary response genes).
Given the similar anti-HIV activity shown by PIC and LPS in microglia, we sought to systematically examine the activation of intracellular signaling pathways in microglia treated with PIC or LPS. We first examined nuclear translocation of IRF3 by determining the amounts of IRF3 protein in nuclear extracts. Figure 2A shows that in PIC-treated microglia, IRF3 is translocated to the nucleus as early as 20 min, and persisted through 24 h. In LPS-treated cells, IRF3 translocation was noticeable at 1 h, then was suppressed. pY-Stat1 (marker of IFN production) was detected at 6 h post-stimulation in both, with PIC inducing a higher level than LPS. These results show that both PIC and LPS activate IRF3 leading to IFNβ production in microglia.
Effect of TLR3 or TLR4 activation on other microglial signaling pathways and the induction of transcriptional factors and antiviral proteins (Figure 2B-2D)
Additional intracellular signaling pathways were activated by PIC and LPS in microglia. MAP kinase activation was examined in the whole cell lysates: JNK, Erk and p38 MAPK were all phosphorylated within 10 min of stimulation with PIC (Figure 2B), similar to LPS(Kim et al., 2002) (also see Figure 2C). pS-Stat1 was induced within 20 min by PIC, LPS and IFNβ, but not by IFNγ. Serine phosphorylation of Stat1 is required for full transcriptional activation of Stat1, in addition to pY-Stat1. IFNβ activation of p-Erk and pS-Stat1 in microglia is consistent with previous data (Kim et al., 2002). p-Akt (downstream of PI3K) was upregulated at 1 h after PIC- or LPS-stimulation (Figure 2C), but 6 h after IFNβ or IFNγ stimulation, demonstrating an indirect mechanism of activation by IFNs. PI3K (through induction of tyrosine phosphorylation of TLR3) has been shown to enhance IRF3 phosphorylation and subsequent gene induction (Sarkar et al., 2004). GSK3β, a multifunctional kinase implicated in HIV-mediated neuropathogenesis(Dewhurst et al., 2007), was phosphorylated (therefore inactivated) by PIC or LPS (pSer9-GSK3β), while IFNs had minimal effects (Figure 2C).
PIC and LPS in microglia additionally induced expression of antiviral proteins and transcription factors (Figure 2D). Viperin (also called cig5) (Chin & Cresswell, 2001) and indoleamine 2,3 dioxygenase (IDO), which we have identified as PIC-inducible anti-HIV proteins in astrocytes (Rivieccio et al., 2006;Suh et al., 2007), were also induced by PIC and LPS in microglia. IFNβ and IFNγ preferentially induced viperin and IDO, respectively. Transcriptional factors involved in TLR/IFN signaling were upregulated. Stat1 (and Stat2, not shown) was upregulated by all four stimuli, whereas IKKε (an IRF3 kinase) was upregulated by LPS, PIC and IFNβ but not by IFNγ. Macrophage inflammatory gene activator and HIV transactivator C/EBPβ was induced similarly by all four stimuli, including the 37 kD activating and the 20 kD inhibitory isoforms. Thus, a systematic survey of the cell signaling pathways in primary human microglia has shown that TLR3 and TLR4 trigger multiple cell activation pathways in a strikingly similar manner, accounting for their similar antiviral activity as well as gene induction (see below).
HIV-induced microglial cell activation (Figure 3A & B)
Figure 3. HIV-induced microglial cell activation.

(A) Microglia infected with VSVg env HIV for 6h – 4D were analyzed for the expression of HIV gag, IRF3, viperin and Stat1. HIV gag induction was visible within 1D and increased through 4D. IRF3 showed time-dependent decrease. Viperin was induced strongly by HIV and showed biphasic kinetics. Stat1 protein was upregulated by HIV. (B) Microglia infected with HIVADA were analyzed as in (A). No detectable p24 production was noted even at 5D post-inoculation. The p24 levels at 6h and 1D represent input virus (blot over-exposed). IRF3 showed time-dependent decrease. Viperin showed only the early phase of induction. T-stat1 showed upregulation. The numbers below IRF3 blots are densitometric ratios to protein loading controls.
Viral intermediary dsRNA could activate cells via TLR3 or RIG-I-like helicases (RLR) (Akira et al., 2006;Hiscott et al., 2006;Sen & Sarkar, 2005), but currently there is no evidence that HIV can trigger dsRNA receptors (thereby activating IRF3) (Okumura et al., 2008;Brown et al., 2008). Instead, evidence suggests that HIV and other viruses induce degradation of IRF3 in infected cells (Okumura et al., 2008;Lin et al., 1998). In order to examine the relationship between HIV- and dsRNA-induced cell activation, we performed the following experiments. Microglia were infected with VSVg env HIV or R5 HIV (HIVADA) for 6h to 5D and Western blot analysis was performed for HIVgag and microglial antiviral proteins. As shown in Figure 3A, HIV gag was induced within one day and increased through 4D (latest time point) following VSVg HIV infection. In HIVADA-infected microglia, p24 was not detectable even on 5D (latest time point: Figure 3B). The early (6h and 1D) p24 levels represent input virus (blot over-exposed). In both cultures, endogenous IRF3 in microglia showed a time-dependent decrease. In contrast, viperin was induced by VSVg HIV in a biphasic manner (6h, 1D and 4D), whereas only the early phase (6h, 1D) was apparent in HIVADA infected microglia. These results suggest a dual mechanism for viperin induction by HIV, one triggered by early intracellular events of the HIV life cycle, and the other by late productive HIV infection (also see Figure 1D). Unlike viperin, IDO was not induced in either HIV-infected culture (not shown, also see below Figure 4B). Microglial Stat1 protein was induced by both HIV types with similar kinetics (also see below Figure 5). Stat1 protein induction by HIV has been shown previously (Johnston et al., 2000). Together, our results show that HIV-induced microglial gene induction is distinct from that by PIC and support that HIV does not activate IRF3(Okumura et al., 2008).
Figure 4. Role of IRF3 in the induction of IFNβ and anti-HIV activity.

(A) Microglia were first infected with adeno-IRF3 (DN: dominant negative IRF3, or WT: wild-type IRF3) for 3 days, then with HIVADA or not in the presence or absence of PIC for 3 h. Q-PCR analysis was performed as described in the Methods using GAPDH as control. (B) Role of IRF3 in PIC-induced HIV suppression was examined by transduction with adenovirus DN- or WT-IRF3, as in (A), followed by infection with VSVg env HIV with or without PIC for an additional 3D. Over expression of IRF3 was confirmed by Western blot for the WT or N-terminal truncated (DN) IRF3. In DN-IRF3 over-expressing microglia, the effect of PIC on p24 expression was reversed. IDO was not induced by HIV alone, but was induced by PIC, and the amount was reduced in DN-IRF over-expressing microglia, compared to WT-IRF over-expressing microglia.
Figure 5. PIC signaling in HIV-infected and uninfected microglia.

Microglia were infected with VSVg env-pseudotyped HIV (or VSVg env only, mock) for 3 days, and then stimulated with PIC for indicated time periods (0 – 24 h). Western blot analysis was performed for HIV and microglial proteins. HIV induced viperin and Stat1 but not IDO, and PIC stimulation by 24h did not result in significant changes in the level of these proteins compared to mock-infection. Probing for some of the signaling proteins demonstrated that p-Erk, p-Akt, and p-GSK3β were activated normally in HIV-infected microglia, albeit with slight increase in levels compared to mock-infection. Notably, p-eIF2α showed transient suppression at 1 h and 6 h in infected cells, which recovered by 24 h. Densitometric ratios to vinculin are shown for p-Erk and p-eIF2α.
Role of IRF3 in the induction of IFNβ and anti-HIV activity (Figure 4A & B)
We next asked whether IRF3 plays a role in PIC-induced IFNβ expression and HIV suppression, by adopting adenovirus-mediated over-expression of dominant negative (DN) and wild type (WT) IRF3 (Rivieccio et al., 2005). Microglia were first infected with adenovirus for 3 days, then with HIVADA in the presence or absence of PIC for 3 h (optimal time point for IFNβ mRNA). Q-PCR analysis was performed (Figure 4A). The results were notable for upregulation of (adenovirally transduced) IRF3 (both DN and WT) by PIC treatment (p <0.001, t-test). High levels of IFNβ mRNA were induced by PIC (but not by HIV) and this was almost completely inhibited by DN-IRF3 (p <0.001, t-test). A modest level of induction by PIC was demonstrated for IDO, IP-10/CXCL10, Rantes/CCL5 and TNFα mRNA (3h time point), with relatively little or no change by DN-IRF3 (WT versus DN: p > 0.05, not significant). HIV induced only IP-10 mRNA. These results together demonstrated the difference between PIC- and HIV-induced microglial gene expression and that the induction of IFNβ (but not other genes) was greatly dependent on IRF3.
To determine the role of IRF3 in HIV replication, we examined the level of HIV gag in microglial cultures infected with VSVg HIV ± PIC (in addition to adenoviral infection as described above) for an additional 3 days (Figure 4B). Overexpression of DN (N-terminal truncated) and WT-IRF3 was confirmed by Western blot analysis (Figure 4B). The levels of over-expressed IRF3 proteins were higher in the presence of PIC, confirming the results with Q-PCR (Figure 4A). The amount of HIV gag (p55 + p24) expression was greater in DN-IRF3-expressing microglia compared with WT-IRF3-expressing microglia, both in the presence or absence of PIC. Together, these results indicate an anti-HIV role of IRF3 in microglia, most like through the induction of antiviral proteins such as IFNβ. The Western results for IDO (Figure 4B) essentially reflect the mRNA results shown in Figure 4A.
TLR3 signaling is altered minimally in HIV-infected microglia (Figure 5)
We next asked whether HIV can alter PIC-induced microglial activation. Microglia were infected with VSVg env HIV (or mock infected using VSVg env protein only) for 3 days, then stimulated with PIC (Figure 5). HIV gag (p24) expression was downregulated by PIC even though PIC was added 3D after infection, showing complete inhibition by 24 h (compare with kinetics of HIV gag accumulation without PIC in Figure 3A, for example). Similar to results in Figures 2-4, HIV infection induced the expression of viperin and Stat1 but not IDO in microglia, with minimal changes noted at 20 min - 6 h after PIC treatment. By 24 h, there was little or no difference between mock-infected and HIV-infected microglia in the expression of all three proteins. Examination of several phosphoproteins (p-Erk, p-Akt and p-GSK3β) demonstrated that they were variably induced by HIV, but that both mock- and HIV-infected cells showed similar kinetics of induction by PIC, with slightly elevated levels in HIV-infected cells compared to mock. p-eIF2α (a PKR substrate) induction by PIC was transiently suppressed at 1 h and 6 h in HIV-infected microglia (n = 3), but showed recovery by 24 h, by which time HIVgag was completely inhibited. These results together demonstrate that TLR3 signaling is minimally altered in HIV-infected microglia and that PIC can overcome the mechanism(s) elicited by HIV to counteract host antiviral immunity and can inhibit HIV replication.
PIC-induced gene expression is suppressed by TLR3 silencing (Figure 6)
Figure 6. PIC activates microglial TLR3.

Microglia were transfected with TLR3-specific siRNA or control siRNA at 10 or 30 nM for 3D and then stimulated with PIC for 6h, as described in the Materials and Methods. Transcripts for TLR3, IFNβ, IDO and viperin were measured by real time PCR with PBDA as a control. Silencing microglial TLR3 with specific siRNA (more effective at 10 nM) reduced microglial expression of all four genes. The suppression of viperin was less effective. Data are normalized to the transcript levels present in PIC-treated, control-siRNA transfected microglia. These results show that PIC activates microglia primarily through TLR3.
Since dsRNA can activate cytosolic dsRNA sensors (RIG-I-like helicases: RLR)(Akira et al., 2006;Hiscott et al., 2006;Sen & Sarkar, 2005), in addition to endosomally located TLR3, we directly determined the role of TLR3 in PIC-induced microglial activation by RNAi. Microglia were transfected with TLR3-specific siRNA or control siRNA at 10 or 30 nM for 3D then stimulated with PIC for 6h. Transcripts for TLR3, IFNβ, IDO and viperin were measured by Q-PCR with PBDA as control. Figure 6 shows that TLR3-specific siRNA at 10 nM strongly reduced microglial expression of all four genes (p < 0.001) (Rivieccio et al., 2006), demonstrating that PIC acted primarily through TLR3 in microglia. siRNA at 30 nM was less effective than 10 nM, as reported previously in astrocytes (Rivieccio et al., 2006).
Gene expression profiles of PIC or LPS-activated microglia (Figure 7 and Table 1)
Figure 7. Microarray profiles of TLR3- or TLR4-activated microglia.
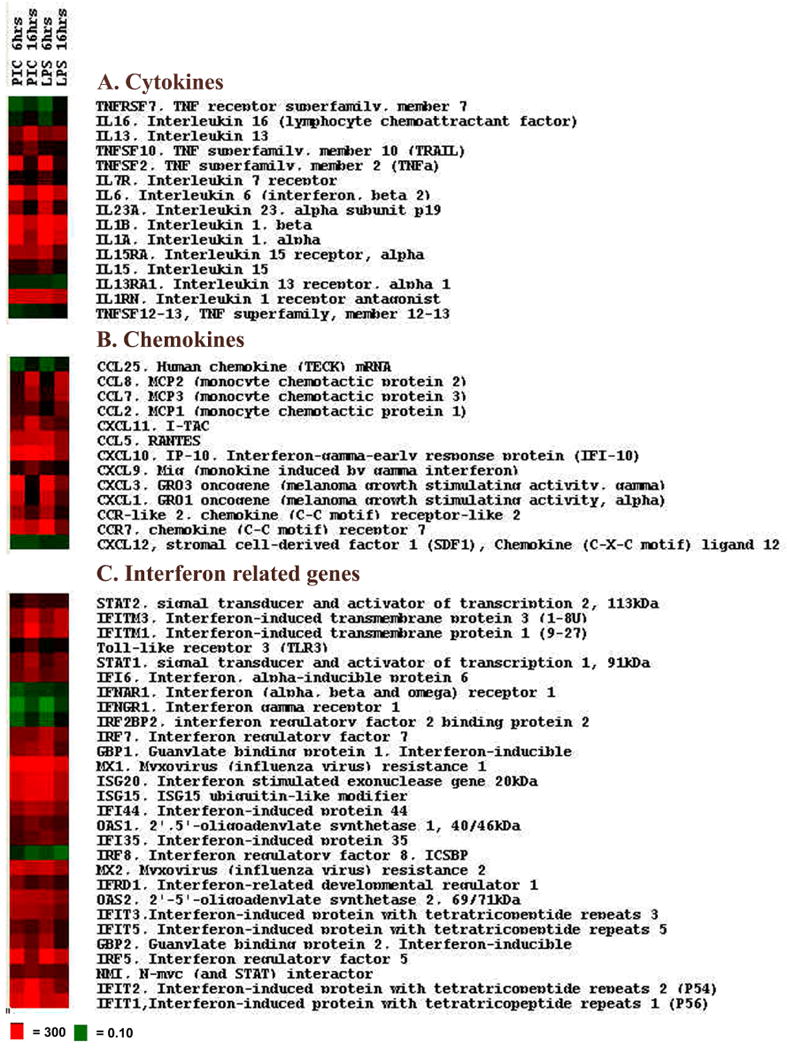
Microglia were activated by PIC (10 μg/ml) or LPS (100 ng/ml) for 6h or 16h, and total RNA as harvested for microarray analysis as described in the Materials and Methods. Heat maps were generated for the three broad categories of genes belonging to cytokines, chemokines and IFN-related genes (A-C). For details, refer to Table 1 (genes are listed in order of appearance in Figure 5), and the text. Each row in the heat map diagram represents a single gene in the signature; each column represents a time point. Red indicates increased expression of the gene relative to the untreated control; green indicates decreased expression.
Table 1. Gene expression in microglia activated by TLR3 or TLR4 ligand1.
| NAME | PIC 6hrs | PIC 16hrs | LPS 6hrs | LPS 16hrs | |
|---|---|---|---|---|---|
| Cytokines | TNFRSF7 | 0.17 | 0.37 | 0.14 | 0.69 |
| IL16 | 0.45 | 1.48 | 0.29 | 1.41 | |
| IL13 | 6.48 | 41.04 | 7.73 | 11.37 | |
| TNFSF10 | 2.53 | 7.19 | 1.76 | 1.44 | |
| TNFSF2 | 76.96 | 1.99 | 92.78 | 2.13 | |
| IL7R | 1.66 | 1.05 | 3.63 | 1.09 | |
| IL6 | 225.77 | 15.78 | 379.04 | 28.01 | |
| IL23A | 10.05 | 1.39 | 41.78 | 2.26 | |
| IL1B | 120.97 | 30.07 | 171.80 | 62.47 | |
| IL1A | 112.12 | 12.78 | 153.53 | 44.11 | |
| IL15RA | 18.61 | 15.76 | 34.00 | 4.38 | |
| IL15 | 2.60 | 2.37 | 5.49 | 1.48 | |
| IL13RA1 | 0.41 | 0.38 | 0.39 | 0.30 | |
| IL1RN | 49.38 | 44.78 | 46.38 | 23.86 | |
| TNFSF12-13 | 0.33 | 0.47 | 0.56 | 0.78 | |
| Chemokines | CCL25 | 0.25 | 0.68 | 0.24 | 0.66 |
| CCL8 | 2.02 | 23.01 | 0.90 | 17.77 | |
| CCL7 | 2.27 | 10.93 | 1.69 | 14.32 | |
| CCL2 | 2.65 | 3.36 | 1.07 | 5.13 | |
| CXCL11 | 4.94 | 26.75 | 5.00 | 2.99 | |
| CCL5 | 18.10 | 21.43 | 24.79 | 8.81 | |
| CXCL10 | 43.48 | 162.11 | 41.08 | 10.05 | |
| CXCL9 | 2.04 | 5.14 | 2.04 | 1.39 | |
| CXCL3 | 62.89 | 1.26 | 66.23 | 6.08 | |
| CXCL1 | 23.20 | 1.01 | 24.72 | 3.10 | |
| CCR-like 2 | 10.30 | 2.66 | 13.63 | 1.77 | |
| CCR7 | 32.11 | 17.30 | 81.67 | 5.53 | |
| CXCL12 | 0.32 | 0.32 | 0.45 | 0.43 | |
| IFN-related | STAT2 | 1.53 | 3.06 | 2.01 | 2.12 |
| IFITM3 | 5.16 | 18.83 | 5.62 | 14.13 | |
| IFITM1 | 6.92 | 42.42 | 7.85 | 15.40 | |
| TLR3 | 1.00 | 3.14 | 0.78 | 1.40 | |
| STAT1 | 3.98 | 10.95 | 2.47 | 5.40 | |
| IFI6 | 4.37 | 8.23 | 3.57 | 4.84 | |
| IFNAR1 | 0.26 | 0.40 | 0.40 | 0.51 | |
| IFNGR1 | 0.11 | 0.31 | 0.11 | 0.39 | |
| IRF2BP2 | 0.22 | 0.53 | 0.23 | 0.74 | |
| IRF7 | 5.80 | 5.91 | 13.41 | 4.61 | |
| GBP1 | 6.97 | 9.48 | 15.37 | 2.98 | |
| MX1 | 39.08 | 43.40 | 44.13 | 23.35 | |
| ISG20 | 20.12 | 30.00 | 33.80 | 11.77 | |
| ISG15 | 21.45 | 30.72 | 30.02 | 11.71 | |
| IFI44 | 7.31 | 12.74 | 11.30 | 5.38 | |
| OAS1 | 3.02 | 5.40 | 3.57 | 2.66 | |
| IFI35 | 2.63 | 3.81 | 5.56 | 3.49 | |
| IRF8 | 0.51 | 0.26 | 0.33 | 0.19 | |
| MX2 | 20.52 | 14.84 | 19.29 | 8.65 | |
| IFRD1 | 5.65 | 2.42 | 3.96 | 2.12 | |
| OAS2 | 14.27 | 12.40 | 12.16 | 6.16 | |
| IFIT3 | 10.81 | 10.20 | 7.95 | 3.89 | |
| IFIT5 | 4.30 | 2.89 | 6.14 | 1.96 | |
| GBP2 | 8.84 | 4.08 | 11.44 | 1.97 | |
| IRF5 | 35.99 | 5.98 | 50.29 | 16.42 | |
| NMI | 4.00 | 5.59 | 3.87 | 3.13 | |
| IFIT2 | 16.14 | 43.17 | 14.41 | 4.75 | |
| IFIT1 | 25.28 | 73.31 | 16.21 | 19.87 | |
Microarray profiles of microglia activated by PIC (10 μg/ml) or LPS (100 ng/ml) for 6h or 16h as shown in Fig. 7. The numbers represent fold induction over control (un-activated) microglia.
The high similarity between PIC- and LPS-activated microglia with respect to their antiviral activity and intracellular signaling suggested that they might modulate similar sets of microglial genes. In order to test this, microarray analysis was performed employing the 27k human cDNA array obtained from the Albert Einstein College of Medicine Microarray Facility. RNA was harvested at 6h and 16h after PIC or LPS stimulation and unstimulated microglia were used as control. A large number of genes were upregulated or downregulated by PIC or LPS at each time point. For example, 1874 genes were upregulated and 2926 genes were downregulated by PIC at 6 h time point using Cy5/Cy3 ratios of 1.5 and 0.67, respectively. The genes were grouped into several categories based on their known function and heat maps were generated to aid visualization of the gene expression pattern. The partial results (cytokines, chemokines, and IFN-related genes) are shown in Figure 7 and Table 1, and the complete data sets are available in the Supplemental Material. They show that the gene expression profiles of PIC- and LPS-activated microglia were remarkably similar, with regard to the types of genes induced (or suppressed) and the amounts and kinetics of change, with some minor differences (see below). The expression of many of the cytokines, chemokines and IFN-related genes was confirmed by Q-PCR, RPA, Western blot analysis and ELISA (Figures 3, 5 & 6, and data not shown). The fold change determined by microarray (rarely over 100 fold) was often an underestimation, since with Q-PCR or ELISA, the fold changes often reached the range of hundreds to thousands (Figures, and data not shown). However, similar underestimations of differential gene expression using DNA microarrays compared to more conventional technologies have been reported previously(Taniguchi et al., 2001).
Cytokines
Proinflammatory cytokines (IL-1α, IL-1β, TNFα and IL-6) were highly induced by PIC and LPS in microglia, with LPS being more potent than PIC by a factor of 1.1 to ∼ 3.5 (Table 1). The reverse was true for the Th2 cytokine IL-13, and IL-1 receptor antagonist (PIC > LPS). The mRNA for IL-13 receptor was suppressed by both. The Th1 cytokine IL-23 (p19) was induced by both (LPS > PIC) but IL-12 was not detected. IL-15, a cytokine that is induced by LPS in vivo and mediates glial activation(Gomez-Nicola et al., 2008), is also highly induced by both. IL-15 receptor was also strongly induced by both PIC and LPS.
Chemokines
Among the most highly upregulated chemokines were the IRF3-dependent (IRF3-enhanced) gene IP-10 (CXCL10), and the related CXCR3-binding chemokines, Mig (CXCL9) and I-TAC (CXCL11), all of which were induced more by PIC than LPS, especially at 16h. Rantes (CCL5) showed a similar trend. The GRO oncogenes (CXCL1 and CXCL3) were very highly induced by PIC and LPS at 6h, with persistent elevation by LPS but not by PIC. The monocyte chemoattractant proteins (MCP) 1, MCP2 and MCP3 (CCL2, CCL8, and CCL7, respectively) were also upregulated at 16h, with no clearly discernible pattern of induction by the two TLR ligands. CCR7, a dendritic cell antigen that is expressed in microglia in inflamed CNS (Serafini et al., 2006;Dijkstra et al., 2006), is highly induced. Stromal derived factor (SDF-1: CXCL12) and the recently discovered chemokine CCL25 were downregulated.
IFN-related genes
IFN-related genes included those involved in the activation of type I IFN genes and IFN signaling, as well as IFN-stimulated genes (ISGs) involved in antiviral responses. These were among the most highly induced genes in both PIC and LPS arrays. These included Stat1 and Stat2 involved in IFN signaling, IRF7 involved in TLR3 (and other TLR) signaling, as well as TLR3 itself, which was induced by PIC only at 16h. IFNβ was not detected reflecting early peak (1-3 h) and low sensitivity of microarray (Taniguchi et al., 2001). ISGs such as Mx1 and Mx2, OAS1 and OAS2, as well as GBP1 and GBP2 were all highly induced, with PIC being more potent than LPS (16h). The IFN-induced protein with tetratricopeptide (IFIT) family genes (Sen & Peters, 2007) were the most highly induced of this gene category. IFIT1 (p56) and IFIT2 (p54), known IRF3-dependent genes, were highly induced, with PIC more potent than LPS (up to ∼ 10-fold at 16h). IFN-induced transmembrane proteins, IFITM1 and IFITM3, were also highly induced with PIC more potent than LPS at 16h. ISG15 and ISG20, also known IRF3-dependent genes (Grandvaux et al., 2002), followed the same pattern. By contrast, IFN regulatory factor 2 (IRF2) binding protein 2 (IRF2BP2), a protein involved in down regulation of IFN signaling, was suppressed, as was IRF8 (also called IFN consensus sequence binding protein: ICSBP), a myeloid and lymphocyte protein involved in cell proliferation, differentiation and innate immunity (Huang et al., 2008). The type I IFN receptor (IFNAR1) and IFNγ receptor (IFNGR1) were downregulated by both PIC and LPS.
HIV-induced genes (Table 2)
Table 2. Gene expression in microglia infected with HIV (VSVg env NL4.3) for 24h.
| Gene name | 1 Fold change | |
|---|---|---|
| Cytokines | IL-1β | 1.58 |
| IL-1RN (IL-1 receptor antagonist) | 3.03 | |
| IL-13 | 1.67 | |
| IL-10RA (IL-10 receptor, alpha) | 0.64 | |
| Chemokines | CXCL10 (IP-10) | 5.30 |
| CCL5 (Rantes) | 1.90 | |
| IFN-related genes | ISG15 | 1.50 |
| ISG20 | 1.00 | |
| OAS1 | 1.50 | |
| OAS2 | 1.30 | |
| GBP2 | 1.65 | |
| Mx2 | 1.70 | |
| IFIT1 (p56) | 1.53 | |
| IFIT2 (p54) | 1.77 | |
| IFIT5 | 1.86 | |
| IFITM1 | 2.18 | |
| IRF7 | 2.03 | |
| STAT2 | 1.65 | |
| eIF2α K2 (eukaryotic translation initiation factor 2α-kinase 2) | 1.59 |
Microglia were either uninfected or infected with VSVg env HIV at high concentrations for 24h, then RNA harvested for microarray analysis as described in the Materials and Methods. Fold change in HIV-infected microglia over control, uninfected microglia.
To determine the extent to which HIV can elicit gene expression, microarray was performed with VSVg env HIV-infected microglia (24 h). As shown in Table 2, a small number of genes belonging to cytokines (IL-1β, IL-1ra and IL-13), chemokines (IP-10/CXCL10 and Rantes/CCL5) and IFN-related genes (ISG15, OAS1, GBP1, IFIT1, IFIT2, IFIT5, and IFITM1, and IRF7) were induced minimally by HIV, with the exception of IP-10 (over 5-fold). The microarray data set is available online (Supplemental Data).
Alteration of microglial gene expression by DN-IRF3 and WT-IRF3 (Table 3)
Table 3. Genes differentially regulated in DN-IRF3- and WT-IRF3-over-expressing microglia*.
| Gene Function | Gene symbol | Gene name | Fold change |
|---|---|---|---|
| A. Decreased genes* | |||
| Chemokines and receptors | CXCL10 | chemokine (C-X-C motif) ligand 10 (IP-10) | 0.03 |
| CXCL11 | chemokine (C-X-C motif) ligand 11 (I-TAC) | 0.04 | |
| CXCL9 | chemokine (C-X-C motif) ligand 9 (Mig) | 0.24 | |
| CCL5 | chemokine (C-C motif) ligand 5 (Rantes) | 0.28 | |
| CCR7 | chemokine (C-C motif) receptor 7 | 0.33 | |
| Cytokines and receptors | IL-1ra | interleukin 1 receptor antagonist, transcript variant 3 | 0.27 |
| TRAIL | tumor necrosis factor (ligand) superfamily, member 10 (TNFSF10) | 0.09 | |
| CD40 | CD40 molecule (TNF receptor superfamily, member 5), transcript variant 1 | 0.24 | |
| IL-13 | interleukin 13 | 0.33 | |
| Antiviral & interferon-induced | IFIT1 | interferon-induced protein with tetratricopeptide repeats 1, transcript variant 2 | 0.16 |
| IFIT2 | interferon-induced protein with tetratricopeptide repeats 2 | 0.08 | |
| IFITM1 | interferon induced transmembrane protein 1 (9-27) | 0.31 | |
| IFI44L | interferon-induced protein 44-like | 0.34 | |
| ISG15 | ISG15 ubiquitin-like modifier | 0.30 | |
| ISG20 | interferon stimulated exonuclease gene 20kDa | 0.15 | |
| OAS1 | 2′,5′-oligoadenylate synthetase 1, 40/46kDa (OAS1), transcript variant 1 | 0.65 | |
| Mx2 | myxovirus (influenza virus) resistance 2 (mouse) | 0.45 | |
| GBP1 | guanylate binding protein 1, interferon-inducible, 67kDa | 0.34 | |
| GBP2 | guanylate binding protein 2, interferon-inducible | 0.40 | |
| IDO | indoleamine-pyrrole 2,3 dioxygenase | 0.49 | |
| APOBEC3A | apolipoprotein B mRNA editing enzyme, catalytic polypeptide-like 3A | 0.24 | |
| APOBEC3G | apolipoprotein B mRNA editing enzyme, catalytic polypeptide-like 3G | 0.28 | |
| CUL5 | cullin 5 | 0.41 | |
| Antiviral signaling | TLR7 | toll-like receptor 7 | 0.30 |
| TANK | TRAF family member-associated NFKB activator, transcript variant 1 | 0.47 | |
| MyD88 | myeloid differentiation primary response gene (88) | 0.56 | |
| IRF7 | interferon regulatory factor 7 (IRF7), transcript variant d | 0.57 | |
| STAT2 | signal transducer and activator of transcription 2, 113kDa | 0.33 | |
| eIF2αK2 | eukaryotic translation initiation factor 2-alpha kinase 2 | 0.48 | |
| Miscellaneous | CD38 | CD38 molecule | 0.18 |
| CD83 | CD83 molecule, transcript variant 1 | 0.48 | |
| CD86 | CD86 molecule, transcript variant 2, mRNA | 0.42 | |
| ICAM5 | intercellular adhesion molecule 5, telencephalin | 0.23 | |
| HK2 | hexokinase 2 | 0.40 | |
| IER2 | immediate early response 2 | 0.43 | |
| MPEG1 | macrophage expressed gene 1 | 0.45 | |
| GRIN1 | glutamate receptor, ionotropic, N-methyl D-aspartate 1, transcript variant NR1-1 | 0.47 | |
| ATF3 | Activating transcription factor 3, transcript variant 4 | 0.22 | |
| B: Increased genes* | |||
| Cytokines, chemokines and receptors | CCL18 | chemokine (C-C motif) ligand 18 (pulmonary and activation-regulated) | 3.57 |
| CXCL1 | chemokine (C-X-C motif) ligand 1 (melanoma growth stimulating activity, alpha)(GRO1, GROα) | 5.14 | |
| CXCL3 | chemokine (C-X-C motif) ligand 3 (GRO3, GROγ) | 8.09 | |
| IL-1α | interleukin 1, alpha | 4.35 | |
| IL-1β | interleukin 1, beta | 7.74 | |
| TNFRSF1B | tumor necrosis factor receptor superfamily, member 1B (TNFR2) | 8.19 | |
| Growth factors & receptors Inflammatory enzymes | CSF3 | colony stimulating factor 3 (granulocyte, G-CSF), transcript variant 2 | 2.67 |
| CSF-1R | colony stimulating factor 1 receptor, formerly McDonough feline sarcoma viral (v-fms) oncogene homolog | 5.64 | |
| COX2 | prostaglandin-endoperoxide synthase 2 (prostaglandin G/H synthase and cyclooxygenase) (PTGS2) | 4.81 | |
| MMP1 | matrix metallopeptidase 1 (interstitial collagenase) | 4.01 | |
| Transcription factors & signaling | HIF1α | hypoxia-inducible factor 1, alpha subunit (basic helix-loop-helix transcription factor), transcript variant 1 | 2.67 |
| BCL6 | B-cell CLL/lymphoma 6 (zinc finger protein 51), transcript variant 1 | 2.88 | |
| RPS6KA1 (S6Kα 1) | ribosomal protein S6 kinase, 90kDa, polypeptide 1, transcript variant 2 (MAPKAPK1A) | 2.38 | |
| FKBP5 | FK506 binding protein 5 | 2.18 | |
| Macrophage antigens | CD163 | CD163 molecule, transcript variant 1 | 3.89 |
| CD14 | CD14 molecule, transcript variant 2 | 4.17 | |
| MMD | monocyte to macrophage differentiation-associated | 2.14 | |
| SDC2 | syndecan 2 | 3.73 | |
Microglia were infected with adenovirus carrying DN-IRF3 or WT-IRF3 plasmid for 3 days in the presence of PIC during the last 24h, and RNA harvested for microarray analysis as described in the Materials and Methods. Values are ratios in DN-IRF3-overexpressing microglia to WT-IRF3-overexpressing microglia. Highly negative values suggest IRF3-dependent (enhanced) gene, and highly positive values suggest genes suppressed by WT-IRF3. Examples of genes with negative values are listed in (A) and positive values in (B).
To examine the role of IRF3 in PIC, LPS and HIV-induced microglial gene expression, we performed microarray analyses of microglia transduced with adenoviral vectors (DN-IRF3 or WT-IRF3). A set of microglia were first transduced with adenovirus (DN-IRF3 or WT-IRF3) for 3D and then were exposed to PIC, LPS, HIV or none (control). Gene expression in DN-IRF3-overexpressing microglia was analyzed against that in WT-IRF3-overexpressing microglia, with an assumption that a value of less than 1 would indicate an IRF3-dependent (IRF3-enhanced) gene.
We indeed observed highly negative values for known IRF3-dependent genes in these experiments (Table 3A). Interestingly, many of these genes were also present in control microglia that were not exposed to any of the stimuli (TLR ligands or HIV, data not shown), indicating that over-expressed WT-IRF3 was also active. Furthermore, we also observed a subset of genes with positive values, suggestive of inhibition by over-expressed WT-IRF3 (Table 3B). A complete microarray data set is available as Supplemental Data.
Discussion
Microglia are innate immune cells in the brain engaged in antiviral responses. Of the 11 TLRs, TLR3 and TLR4 are unique in that they can transmit signals through the MyD88-independent (Akira et al., 2006), TRIF-dependent pathway resulting in the activation of IRF3 and IFNβ gene expression. This latter aspect critically contributes to antiviral immunity. In order to gain insight into the specific TLR signaling pathways that regulate gene expression and antiviral activity, human fetal microglia were challenged with specific TLR ligands PIC and LPS, and their responses were compared using several different approaches. First and foremost, our results showed that TLR3 and TLR4 activate anti-viral immunity in microglia. PIC and LPS suppressed HIV expression in microglia in both the acute spreading infection model as well as the single cycle infection model.
Our study indicates that the role of macrophage activators in macrophage HIV infection could vary depending on the types of infection. It is generally believed that unlike interferons which have known antiviral activity, LPS and proinflammatory cytokines enhance HIV expression (Osiecki et al., 2005;Folks et al., 1989;Rosenberg & Fauci, 1990). However, much of these data were derived from cell lines or cells with stably integrated HIV proviruses, such as U1 cells (monocytic), ACH-2 cells (T cell line) or HIV-transgenic murine macrophages(Sun et al., 2008;Equils et al., 2003). In fact, we find that in U1 cells, both LPS and IL-1 robustly activate HIV expression, and PIC fails to inhibit HIV, unlike in microglia. Indeed, several TLR ligands including those that bind TLR3, TLR7/8 and TLR9 have been shown to enhance HIV/SIV in chronically-infected cell lines (Lester et al., 2008;Scheller et al., 2004;Schlaepfer et al., 2006;Equils et al., 2003), whereas their effects are inhibitory in acute infection models(Barber et al., 2004). We and others also find that proinflammatory cytokines including IL-1β, TNFα and IL-6 suppress HIV expression in microglia ((Si et al., 2004) and unpublished). These results indicate that cytokines and TLR ligands play different roles in HIV replication depending on the types of infection, and call for caution in extrapolating data from different infection models (Wang et al., 2004;Scholle & Mason, 2005;Tabeta et al., 2004;Zucchini et al., 2008).
In addition to TLR3 and TLR4, we also tested the role of the TLR9 ligand CpG ODN in microglial HIV expression and found it to be suppressive. However, the control GpC ODN also suppressed HIV expression in microglia, suggesting that the antiviral effect of CpG ODN was primarily mediated by phosphorothioate modification rather than through activating TLR9. Similar non-specific effects of the TLR9 ligand ODNs have been documented by other investigators in PBMCs with respect to antiviral activity and cytokine expression (Schlaepfer et al., 2004;Wang et al., 2005).
Viruses can activate host cell TLRs and other viral sensors through formation of viral PAMPs. Therefore, one of the questions we attempted to address in our study was whether HIV can activate IRF3 through either TLR3 or the alternative cytosolic dsRNA sensor “RIG-like helicases or RIG-like receptors (RLR)” (Kato et al., 2005;Sen & Sarkar, 2005;Hiscott et al., 2006). Since both types of dsRNA receptors activate IRF3, we examined gene expression profiles with particular focus on IRF3-dependent genes. Minute amounts of induction were observed including IFIT1, IFIT2 and ISG15, and although this does not completely exclude TLR3/RLR activation, it is unlikely that this will amount to significant antiviral immunity. Our analyses also demonstrated similarities and differences between HIV-infected microglia and PIC-activated microglia. The proteins robustly induced by HIV including viperin, Stat1 and IP-10 are all IFN-inducible genes (Rivieccio et al., 2006;Hua & Lee, 2000), and HIV did not induce IRF3-dependent genes (such as IFNβ) in significant quantities. These quantitative differences in antiviral genes lead to different outcomes, as we have observed that IL-1- (as opposed to PIC-) stimulated astrocytes have no antiviral activity, although IL-1 induced IRF3 activation and IFNβ production (Rivieccio et al., 2006). Furthermore, in addition to the lack of IRF3-dependent gene induction by HIV, our analysis also revealed that the amounts of IRF3 protein in HIV-infected microglia decreased with time, and this appeared to be independent of viral replication. Together, these results support the conclusions of the recently published studies which demonstrated that HIV does not activate IRF3 but rather causes its degradation (Okumura et al., 2008;Brown et al., 2008). It is possible that the reported type I interferon (IFNα) induction by HIV is triggered by other viral sensors such as TLR7/8 (Heil et al., 2004;Beignon et al., 2005). As for the role of TLR3 versus RLR in microglial cell signaling by PIC, our RNAi data support a predominant role of TLR3, consistent with the literature (Town et al., 2006). However, these results do not exclude the role for RLR. Indeed, our microarray analysis show that microglia express RIG-I which is further upregulated by PIC (data not shown).
We have also attempted to examine whether HIV-infected microglia are defective in anti-viral immunity conferred by PIC, by examining HIVgag expression, as well as comparing PIC-induced cell signaling and protein expression in infected and uninfected cells. Minor differences notwithstanding, these results seem to indicate that dsRNA-activated antiviral immunity is intact in HIV-infected microglia, as viral replication was suppressed even when PIC was added days after HIV infection.
We have performed gene profiling studies, as well as Western blot analysis, ribonuclease protection assays, and ELISA of antiviral and cytokine/chemokine genes (Figure 2 and data not shown) to contrast the TLR3- and TLR4-induced microglial activation. Activation of NF-κB (not shown), IRF3, MAP kinases, p-Akt, p-GSK3β, and C/EBPβ, all occurred similarly, with minor variations. Induction of several proteins involved in antiviral immunity and signaling were also very similar, and these included Stat 1, IKKε (IRF3 kinase), viperin (type I IFN-induced protein with antiviral properties)63, and IDO (type II IFN-induced protein with tolerogenic and antiviral properties) (Rivieccio et al., 2006;Suh et al., 2007). These results were rather surprising because TLR4 activates the classical MyD88-dependent NF-κB activation, in addition to the TRIF-dependent NF-κB/IRF3 activation pathway. We do not believe the PIC and LPS preparations are cross-contaminated, because astrocytes did not respond to LPS, while they responded robustly to PIC. Previously, the use of gene deletion strategy in mice permitted dissection of the relative contribution of the MyD88-dependent and MyD88-independent pathways in NF-κB activation and gene expression, and earlier studies of murine macrophages indeed have found MyD88 to be necessary for proinflammatory cytokine induction by LPS (Kawai et al., 1999). However, a recent study demonstrated cytokine production by MyD88-deficient murine microglia (although in smaller quantities) (Esen & Kielian, 2006) and our results also suggest a relatively minor role the MyD88 pathway plays in TLR4-induced gene expression in microglia. We speculate that one of the variables that might contribute to this discrepancy may be the amount of macrophage differentiation, as monocytes do not express TLR3 and respond minimally to PIC(Jack et al., 2005;Muzio et al., 2000), suggesting that in monocytes, the TLR4 activation pathway is skewed toward the MyD88-dependent pathway.
Our results also suggest that microglial TLR3 activation may have consequences that are as deleterious as TLR4 activation, i.e., chronic inflammatory activation of the CNS leading to neurodegeneration. Indeed, these undesirable long-term consequences of dsRNA (PIC) have been documented. Injection of PIC to pregnant mice has been shown to produce schizophrenia like disease in the offspring mice (Patterson, 2007), and chronic exposure of mice to PIC produces distinct CNS abnormalities termed “sickness behavior” (Cunningham et al., 2007). These findings suggest that while it would be desirable to activate the innate immune response through TLR3 or TLR4, it would also be necessary to suppress the proinflammatory activity induced by TLR signaling. In this context, it was interesting to observe that over-expression of IRF3 in microglia led to increase in IRF3-dependent antiviral genes including IFNβ and many ISGs, while suppressing IRF3-independent (but NF-κB-dependent) genes (Table 3 and data not shown). Suppression of NF-κB-dependent genes in IRF3-overexpressing cells has been observed previously (Elco et al., 2005) and this aspect merits further investigation since those suppressed by IRF3 over-expression included proinflammatory genes strongly implicated in neurodegeneration such as IL-1. These results together suggest that IRF3 could be an ideal molecular tool by which both the increase in innate antiviral immunity and the suppression of neuroinflammation could be achieved.
Supplementary Material
Acknowledgments
This study was supported by NIH RO1 MH55477, KO1 MH084705, NMSS RG 3827A5, Molecular Neuropathology Training grant NIH T32 NS007098 and Einstein CFAR grant P30 AI051519. We thank the Einstein Human Fetal Tissue Repository for the tissue, Drs. Maurizio Federico and Mario Stevenson for HIV constructs, and Dr. John Hiscott for IRF3 constructs.
Abbreviations
- CNS
central nervous system
- dsRNA
double stranded RNA
- eIF2α
eukaryotic translation initiation factor 2α
- GSK3β
glycogen synthase kinase 3β
- IDO
indoleamine 2,3-dioxygenase
- IKKε
inhibitor of κB kinase ε
- IRF
interferon regulatory factor
- ISGs
IFN-stimulated genes
- LPS
lipopolysaccharide
- ODN
oligodeoxynucleotide
- PAMP
pathogen-associated molecular pattern
- PIC
poly I:C
- PKR
dsRNA-activated protein kinase
- RIG-I
retinoid acid-inducible gene I
- RLR
RIG-I-like receptors
- RPA
ribonuclease protection assay
- TBK
TANK-binding kinase
- TLR
toll-like receptor
- TRIF
toll/interleukin-1 receptor domain-containing adaptor protein inducing IFNβ
- VSVg
vesicular stomatitis virus envelope G protein
Footnotes
Publisher's Disclaimer: This is a PDF file of an unedited manuscript that has been accepted for publication. As a service to our customers we are providing this early version of the manuscript. The manuscript will undergo copyediting, typesetting, and review of the resulting proof before it is published in its final citable form. Please note that during the production process errors may be discovered which could affect the content, and all legal disclaimers that apply to the journal pertain.
References
- Akira S, Uematsu S, Takeuchi O. Pathogen recognition and innate immunity. Cell. 2006;124:783–801. doi: 10.1016/j.cell.2006.02.015. [DOI] [PubMed] [Google Scholar]
- Ancuta P, Kamat A, Kunstman KJ, Kim EY, Autissier P, Wurcel A, Zaman T, Stone D, Mefford M, Morgello S, Singer EJ, Wolinsky SM, Gabuzda D. Microbial translocation is associated with increased monocyte activation and dementia in AIDS patients. PLoS ONE. 2008;3:e2516. doi: 10.1371/journal.pone.0002516. [DOI] [PMC free article] [PubMed] [Google Scholar]
- Barber SA, Herbst DS, Bullock BT, Gama L, Clements JE. Innate immune responses and control of acute simian immunodeficiency virus replication in the central nervous system. J Neurovirol. 2004;10 1:15–20. doi: 10.1080/753312747. [DOI] [PubMed] [Google Scholar]
- Beignon AS, McKenna K, Skoberne M, Manches O, DaSilva I, Kavanagh DG, Larsson M, Gorelick RJ, Lifson JD, Bhardwaj N. Endocytosis of HIV-1 activates plasmacytoid dendritic cells via Toll-like receptor-viral RNA interactions. J Clin Invest. 2005;115:3265–3275. doi: 10.1172/JCI26032. [DOI] [PMC free article] [PubMed] [Google Scholar]
- Brenchley JM, Price DA, Schacker TW, Asher TE, Silvestri G, Rao S, Kazzaz Z, Bornstein E, Lambotte O, Altmann D, Blazar BR, Rodriguez B, Teixeira-Johnson L, Landay A, Martin JN, Hecht FM, Picker LJ, Lederman MM, Deeks SG, Douek DC. Microbial translocation is a cause of systemic immune activation in chronic HIV infection. Nat Med. 2006;12:1365–1371. doi: 10.1038/nm1511. [DOI] [PubMed] [Google Scholar]
- Brown JN, Kohler JJ, Coberley CR, Sleasman JW, Goodenow MM. HIV-1 activates macrophages independent of Toll-like receptors. PLoS ONE. 2008;3:e3664. doi: 10.1371/journal.pone.0003664. [DOI] [PMC free article] [PubMed] [Google Scholar]
- Bsibsi M, Persoon-Deen C, Verwer RW, Meeuwsen S, Ravid R, van Noort JM. Toll-like receptor 3 on adult human astrocytes triggers production of neuroprotective mediators. Glia. 2006;53:688–695. doi: 10.1002/glia.20328. [DOI] [PubMed] [Google Scholar]
- Bsibsi M, Ravid R, Gveric D, van Noort JM. Broad expression of Toll-like receptors in the human central nervous system. J Neuropathol Exp Neurol. 2002;61:1013–1021. doi: 10.1093/jnen/61.11.1013. [DOI] [PubMed] [Google Scholar]
- Cai Z, Pang Y, Lin S, Rhodes PG. Differential roles of tumor necrosis factor-alpha and interleukin-1 beta in lipopolysaccharide-induced brain injury in the neonatal rat. Brain Res. 2003;975:37–47. doi: 10.1016/s0006-8993(03)02545-9. [DOI] [PubMed] [Google Scholar]
- Carpentier PA, Begolka WS, Olson JK, Elhofy A, Karpus WJ, Miller SD. Differential activation of astrocytes by innate and adaptive immune stimuli. Glia. 2005;49:360–374. doi: 10.1002/glia.20117. [DOI] [PubMed] [Google Scholar]
- Carpentier PA, Duncan DS, Miller SD. Glial toll-like receptor signaling in central nervous system infection and autoimmunity. Brain Behav Immun. 2008;22:140–147. doi: 10.1016/j.bbi.2007.08.011. [DOI] [PMC free article] [PubMed] [Google Scholar]
- Chao CC, Hu S, Molitor TW, Shaskan EG, Peterson PK. Activated microglia mediate neuronal cell injury via a nitric oxide mechanism. J Immunol. 1992;149:2736–2741. [PubMed] [Google Scholar]
- Chin KC, Cresswell P. Viperin (cig5), an IFN-inducible antiviral protein directly induced by human cytomegalovirus. Proc Natl Acad Sci U S A. 2001;98:15125–15130. doi: 10.1073/pnas.011593298. [DOI] [PMC free article] [PubMed] [Google Scholar]
- Cunningham C, Campion S, Teeling J, Felton L, Perry VH. The sickness behaviour and CNS inflammatory mediator profile induced by systemic challenge of mice with synthetic double-stranded RNA (poly I:C) Brain Behav Immun. 2007;21:490–502. doi: 10.1016/j.bbi.2006.12.007. [DOI] [PubMed] [Google Scholar]
- Dewhurst S, Maggirwar SB, Schifitto G, Gendelman HE, Gelbard HA. Glycogen synthase kinase 3 Beta (GSK-3beta) as a therapeutic target in neuroAIDS. J Neuroimmune Pharmacol. 2007;2:93–96. doi: 10.1007/s11481-006-9051-1. [DOI] [PubMed] [Google Scholar]
- Dickson DW, Lee SC. Microglia in HIV-related CNS neuropathology: an update. J NeuroAIDS. 1996;1:57–83. doi: 10.1300/j128v01n01_03. [DOI] [PubMed] [Google Scholar]
- Dickson DW, Mattiace LA, Kure K, Hutchins K, Lyman WD, Brosnan CF. Microglia in human disease, with an emphasis on acquired immune deficiency syndrome. Lab Invest. 1991;64:135–156. [PubMed] [Google Scholar]
- Dijkstra IM, de Haas AH, Brouwer N, Boddeke HW, Biber K. Challenge with innate and protein antigens induces CCR7 expression by microglia in vitro and in vivo. Glia. 2006;54:861–872. doi: 10.1002/glia.20426. [DOI] [PubMed] [Google Scholar]
- Elco CP, Guenther JM, Williams BR, Sen GC. Analysis of genes induced by Sendai virus infection of mutant cell lines reveals essential roles of interferon regulatory factor 3, NF-kappaB, and interferon but not toll-like receptor 3. J Virol. 2005;79:3920–3929. doi: 10.1128/JVI.79.7.3920-3929.2005. [DOI] [PMC free article] [PubMed] [Google Scholar]
- Ellis R, Langford D, Masliah E. HIV and antiretroviral therapy in the brain: neuronal injury and repair. Nat Rev Neurosci. 2007;8:33–44. doi: 10.1038/nrn2040. [DOI] [PubMed] [Google Scholar]
- Enoch T, Zinn K, Maniatis T. Activation of the human beta-interferon gene requires an interferon-inducible factor. Mol Cell Biol. 1986;6:801–810. doi: 10.1128/mcb.6.3.801. [DOI] [PMC free article] [PubMed] [Google Scholar]
- Equils O, Schito ML, Karahashi H, Madak Z, Yarali A, Michelsen KS, Sher A, Arditi M. Toll-like receptor 2 (TLR2) and TLR9 signaling results in HIV-long terminal repeat trans-activation and HIV replication in HIV-1 transgenic mouse spleen cells: implications of simultaneous activation of TLRs on HIV replication. J Immunol. 2003;170:5159–5164. doi: 10.4049/jimmunol.170.10.5159. [DOI] [PubMed] [Google Scholar]
- Esen N, Kielian T. Central role for MyD88 in the responses of microglia to pathogen-associated molecular patterns. J Immunol. 2006;176:6802–6811. doi: 10.4049/jimmunol.176.11.6802. [DOI] [PMC free article] [PubMed] [Google Scholar]
- Farina C, Krumbholz M, Giese T, Hartmann G, Aloisi F, Meinl E. Preferential expression and function of Toll-like receptor 3 in human astrocytes. J Neuroimmunol. 2005;159:12–19. doi: 10.1016/j.jneuroim.2004.09.009. [DOI] [PubMed] [Google Scholar]
- Federico M, Percario Z, Olivetta E, Fiorucci G, Muratori C, Micheli A, Romeo G, Affabris E. HIV-1 Nef activates STAT1 in human monocytes/macrophages through the release of soluble factors. Blood. 2001;98:2752–2761. doi: 10.1182/blood.v98.9.2752. [DOI] [PubMed] [Google Scholar]
- Fitzgerald KA, McWhirter SM, Faia KL, Rowe DC, Latz E, Golenbock DT, Coyle AJ, Liao SM, Maniatis T. IKKepsilon and TBK1 are essential components of the IRF3 signaling pathway. Nat Immunol. 2003;4:491–496. doi: 10.1038/ni921. [DOI] [PubMed] [Google Scholar]
- Folks TM, Clouse KA, Justement J, Rabson A, Duh E, Kehrl JH, Fauci AS. Tumor necrosis factor alpha induces expression of human immunodeficiency virus in a chronically infected T-cell clone. Proc Natl Acad Sci U S A. 1989;86:2365–2368. doi: 10.1073/pnas.86.7.2365. [DOI] [PMC free article] [PubMed] [Google Scholar]
- Gomez-Nicola D, Valle-Argos B, Pita-Thomas DW, Nieto-Sampedro M. Interleukin 15 expression in the CNS: blockade of its activity prevents glial activation after an inflammatory injury. Glia. 2008;56:494–505. doi: 10.1002/glia.20628. [DOI] [PubMed] [Google Scholar]
- Gonzalez-Scarano F, Martin-Garcia J. The neuropathogenesis of AIDS. Nat Rev Immunol. 2005;5:69–81. doi: 10.1038/nri1527. [DOI] [PubMed] [Google Scholar]
- Gordon S. Alternative activation of macrophages. Nat Rev Immunol. 2003;3:23–35. doi: 10.1038/nri978. [DOI] [PubMed] [Google Scholar]
- Grandvaux N, Servant MJ, tenOever B, Sen GC, Balachandran S, Barber GN, Lin R, Hiscott J. Transcriptional profiling of interferon regulatory factor 3 target genes: direct involvement in the regulation of interferon-stimulated genes. J Virol. 2002;76:5532–5539. doi: 10.1128/JVI.76.11.5532-5539.2002. [DOI] [PMC free article] [PubMed] [Google Scholar]
- Hanisch UK, Kettenmann H. Microglia: active sensor and versatile effector cells in the normal and pathologic brain. Nat Neurosci. 2007;10:1387–1394. doi: 10.1038/nn1997. [DOI] [PubMed] [Google Scholar]
- Heil F, Hemmi H, Hochrein H, Ampenberger F, Kirschning C, Akira S, Lipford G, Wagner H, Bauer S. Species-specific recognition of single-stranded RNA via toll-like receptor 7 and 8. Science. 2004;303:1526–1529. doi: 10.1126/science.1093620. [DOI] [PubMed] [Google Scholar]
- Hiscott J, Lin R, Nakhaei P, Paz S. MasterCARD: a priceless link to innate immunity. Trends Mol Med. 2006;12:53–56. doi: 10.1016/j.molmed.2005.12.003. [DOI] [PubMed] [Google Scholar]
- Hua LL, Lee SC. Distinct patterns of stimulus-inducible chemokine mRNA accumulation in human fetal astrocytes and microglia. Glia. 2000;30:74–81. doi: 10.1002/(sici)1098-1136(200003)30:1<74::aid-glia8>3.0.co;2-c. [DOI] [PubMed] [Google Scholar]
- Huang W, Zhu C, Wang H, Horvath E, Eklund EA. The interferon consensus sequence-binding protein (ICSBP/IRF8) represses PTPN13 gene transcription in differentiating myeloid cells. J Biol Chem. 2008;283:7921–7935. doi: 10.1074/jbc.M706710200. [DOI] [PubMed] [Google Scholar]
- Jack CS, Arbour N, Manusow J, Montgrain V, Blain M, McCrea E, Shapiro A, Antel JP. TLR signaling tailors innate immune responses in human microglia and astrocytes. J Immunol. 2005;175:4320–4330. doi: 10.4049/jimmunol.175.7.4320. [DOI] [PubMed] [Google Scholar]
- John GR, Lee SC, Song X, Rivieccio M, Brosnan CF. IL-1-regulated responses in astrocytes: relevance to injury and recovery. Glia. 2005;49:161–176. doi: 10.1002/glia.20109. [DOI] [PubMed] [Google Scholar]
- Johnston JB, Jiang Y, van MG, Mayne MB, Ni W, Holden J, McArthur JC, Power C. Lentivirus infection in the brain induces matrix metalloproteinase expression: role of envelope diversity. J Virol. 2000;74:7211–7220. doi: 10.1128/jvi.74.16.7211-7220.2000. [DOI] [PMC free article] [PubMed] [Google Scholar]
- Kato H, Sato S, Yoneyama M, Yamamoto M, Uematsu S, Matsui K, Tsujimura T, Takeda K, Fujita T, Takeuchi O, Akira S. Cell type-specific involvement of RIG-I in antiviral response. Immunity. 2005;23:19–28. doi: 10.1016/j.immuni.2005.04.010. [DOI] [PubMed] [Google Scholar]
- Kaul M, Garden GA, Lipton SA. Pathways to neuronal injury and apoptosis in HIV-associated dementia. Nature. 2001;410:988–994. doi: 10.1038/35073667. [DOI] [PubMed] [Google Scholar]
- Kawai T, Adachi O, Ogawa T, Takeda K, Akira S. Unresponsiveness of MyD88-deficient mice to endotoxin. Immunity. 1999;11:115–122. doi: 10.1016/s1074-7613(00)80086-2. [DOI] [PubMed] [Google Scholar]
- Kawai T, Akira S. Antiviral signaling through pattern recognition receptors. J Biochem. 2007;141:137–145. doi: 10.1093/jb/mvm032. [DOI] [PubMed] [Google Scholar]
- Kim MO, Si Q, Zhou JN, Pestell RG, Brosnan CF, Locker J, Lee SC. Interferon-beta activates multiple signaling cascades in primary human microglia. J Neurochem. 2002;81:1361–1371. doi: 10.1046/j.1471-4159.2002.00949.x. [DOI] [PubMed] [Google Scholar]
- Kreutzberg GW. Microglia: a sensor for pathological events in the CNS. Trends Neurosci. 1996;19:312–318. doi: 10.1016/0166-2236(96)10049-7. [DOI] [PubMed] [Google Scholar]
- Laflamme N, Rivest S. Toll-like receptor 4: the missing link of the cerebral innate immune response triggered by circulating gram-negative bacterial cell wall components. FASEB J. 2001;15:155–163. doi: 10.1096/fj.00-0339com. [DOI] [PubMed] [Google Scholar]
- Lee SC, Hatch WC, Liu W, Kress Y, Lyman WD, Dickson DW. Productive infection of human fetal microglia by HIV-1. Am J Pathol. 1993;143:1032–1039. [PMC free article] [PubMed] [Google Scholar]
- Lee SC, Liu W, Brosnan CF, Dickson DW. Characterization of primary human fetal dissociated central nervous system cultures with an emphasis on microglia. Lab Invest. 1992;67:465–476. [PubMed] [Google Scholar]
- Lehnardt S, Lachance C, Patrizi S, Lefebvre S, Follett PL, Jensen FE, Rosenberg PA, Volpe JJ, Vartanian T. The toll-like receptor TLR4 is necessary for lipopolysaccharide-induced oligodendrocyte injury in the CNS. J Neurosci. 2002;22:2478–2486. doi: 10.1523/JNEUROSCI.22-07-02478.2002. [DOI] [PMC free article] [PubMed] [Google Scholar]
- Lenardo MJ, Fan CM, Maniatis T, Baltimore D. The involvement of NF-kappa B in beta-interferon gene regulation reveals its role as widely inducible mediator of signal transduction. Cell. 1989;57:287–294. doi: 10.1016/0092-8674(89)90966-5. [DOI] [PubMed] [Google Scholar]
- Lester RT, Yao XD, Ball TB, McKinnon LR, Kaul R, Wachihi C, Jaoko W, Plummer FA, Rosenthal KL. Toll-like receptor expression and responsiveness are increased in viraemic HIV-1 infection. AIDS. 2008;22:685–694. doi: 10.1097/QAD.0b013e3282f4de35. [DOI] [PubMed] [Google Scholar]
- Lin R, Heylbroeck C, Pitha PM, Hiscott J. Virus-dependent phosphorylation of the IRF-3 transcription factor regulates nuclear translocation, transactivation potential, and proteasome-mediated degradation. Mol Cell Biol. 1998;18:2986–2996. doi: 10.1128/mcb.18.5.2986. [DOI] [PMC free article] [PubMed] [Google Scholar]
- Lokensgard JR, Gekker G, Ehrlich LC, Hu S, Chao CC, Peterson PK. Proinflammatory cytokines inhibit HIV-1 (SF162) expression in acutely infected human brain cell cultures. J Immunol. 1997;158:2449–2455. [PubMed] [Google Scholar]
- McKimmie CS, Fazakerley JK. In response to pathogens, glial cells dynamically and differentially regulate Toll-like receptor gene expression. J Neuroimmunol. 2005;169:116–125. doi: 10.1016/j.jneuroim.2005.08.006. [DOI] [PubMed] [Google Scholar]
- Muzio M, Bosisio D, Polentarutti N, D'amico G, Stoppacciaro A, Mancinelli R, van't VC, Penton-Rol G, Ruco LP, Allavena P, Mantovani A. Differential expression and regulation of toll-like receptors (TLR) in human leukocytes: selective expression of TLR3 in dendritic cells. J Immunol. 2000;164:5998–6004. doi: 10.4049/jimmunol.164.11.5998. [DOI] [PubMed] [Google Scholar]
- O'Neill LA. When signaling pathways collide: positive and negative regulation of toll-like receptor signal transduction. Immunity. 2008;29:12–20. doi: 10.1016/j.immuni.2008.06.004. [DOI] [PubMed] [Google Scholar]
- Okumura A, Alce T, Lubyova B, Ezelle H, Strebel K, Pitha PM. HIV-1 accessory proteins VPR and Vif modulate antiviral response by targeting IRF-3 for degradation. Virology. 2008;373:85–97. doi: 10.1016/j.virol.2007.10.042. [DOI] [PMC free article] [PubMed] [Google Scholar]
- Osiecki K, Xie L, Zheng JH, Squires R, Pettoello-Mantovani M, Goldstein H. Identification of granulocyte-macrophage colony-stimulating factor and lipopolysaccharide-induced signal transduction pathways that synergize to stimulate HIV type 1 production by monocytes from HIV type 1 transgenic mice. AIDS Res Hum Retroviruses. 2005;21:125–139. doi: 10.1089/aid.2005.21.125. [DOI] [PubMed] [Google Scholar]
- Patterson PH. Neuroscience. Maternal effects on schizophrenia risk. Science. 2007;318:576–577. doi: 10.1126/science.1150196. [DOI] [PubMed] [Google Scholar]
- Perry VH, Gordon S. Macrophages and microglia in the nervous system. Trends Neurosci. 1988;11:273–277. doi: 10.1016/0166-2236(88)90110-5. [DOI] [PubMed] [Google Scholar]
- Persidsky Y, Gendelman HE. Mononuclear phagocyte immunity and the neuropathogenesis of HIV-1 infection. J Leukoc Biol. 2003;74:691–701. doi: 10.1189/jlb.0503205. [DOI] [PubMed] [Google Scholar]
- Rivest S. Molecular insights on the cerebral innate immune system. Brain Behav Immun. 2003;17:13–19. doi: 10.1016/s0889-1591(02)00055-7. [DOI] [PubMed] [Google Scholar]
- Rivieccio MA, John GR, Song X, Suh HS, Zhao Y, Lee SC, Brosnan CF. The cytokine IL-1beta activates IFN response factor 3 in human fetal astrocytes in culture. J Immunol. 2005;174:3719–3726. doi: 10.4049/jimmunol.174.6.3719. [DOI] [PubMed] [Google Scholar]
- Rivieccio MA, Suh HS, Zhao Y, Zhao ML, Chin KC, Lee SC, Brosnan CF. TLR3 ligation activates an antiviral response in human fetal astrocytes: a role for viperin/cig5. J Immunol. 2006;177:4735–4741. doi: 10.4049/jimmunol.177.7.4735. [DOI] [PubMed] [Google Scholar]
- Rosenberg ZF, Fauci AS. Immunopathogenic mechanisms of HIV infection: cytokine induction of HIV expression. Immunol Today. 1990;11:176–180. doi: 10.1016/0167-5699(90)90070-p. [DOI] [PubMed] [Google Scholar]
- Salio M, Cerundolo V. Viral immunity: cross-priming with the help of TLR3. Curr Biol. 2005;15:R336–R339. doi: 10.1016/j.cub.2005.04.025. [DOI] [PubMed] [Google Scholar]
- Sarkar SN, Peters KL, Elco CP, Sakamoto S, Pal S, Sen GC. Novel roles of TLR3 tyrosine phosphorylation and PI3 kinase in double-stranded RNA signaling. Nat Struct Mol Biol. 2004;11:1060–1067. doi: 10.1038/nsmb847. [DOI] [PubMed] [Google Scholar]
- Scheller C, Ullrich A, McPherson K, Hefele B, Knoferle J, Lamla S, Olbrich AR, Stocker H, Arasteh K, ter M V, Rethwilm A, Koutsilieri E, Dittmer U. CpG oligodeoxynucleotides activate HIV replication in latently infected human T cells. J Biol Chem. 2004;279:21897–21902. doi: 10.1074/jbc.M311609200. [DOI] [PubMed] [Google Scholar]
- Schlaepfer E, Audige A, Joller H, Speck RF. TLR7/8 triggering exerts opposing effects in acute versus latent HIV infection. J Immunol. 2006;176:2888–2895. doi: 10.4049/jimmunol.176.5.2888. [DOI] [PubMed] [Google Scholar]
- Schlaepfer E, Audige A, von BB, Manolova V, Weber M, Joller H, Bachmann MF, Kundig TM, Speck RF. CpG oligodeoxynucleotides block human immunodeficiency virus type 1 replication in human lymphoid tissue infected ex vivo. J Virol. 2004;78:12344–12354. doi: 10.1128/JVI.78.22.12344-12354.2004. [DOI] [PMC free article] [PubMed] [Google Scholar]
- Scholle F, Mason PW. West Nile virus replication interferes with both poly(I:C)-induced interferon gene transcription and response to interferon treatment. Virology. 2005;342:77–87. doi: 10.1016/j.virol.2005.07.021. [DOI] [PubMed] [Google Scholar]
- Schwartz M, Butovsky O, Bruck W, Hanisch UK. Microglial phenotype: is the commitment reversible? Trends Neurosci. 2006;29:68–74. doi: 10.1016/j.tins.2005.12.005. [DOI] [PubMed] [Google Scholar]
- Sen GC, Peters GA. Viral stress-inducible genes. Adv Virus Res. 2007;70:233–263. doi: 10.1016/S0065-3527(07)70006-4. [DOI] [PubMed] [Google Scholar]
- Sen GC, Sarkar SN. Hitching RIG to action. Nat Immunol. 2005;6:1074–1076. doi: 10.1038/ni1105-1074. [DOI] [PubMed] [Google Scholar]
- Serafini B, Rosicarelli B, Magliozzi R, Stigliano E, Capello E, Mancardi GL, Aloisi F. Dendritic cells in multiple sclerosis lesions: maturation stage, myelin uptake, and interaction with proliferating T cells. J Neuropathol Exp Neurol. 2006;65:124–141. doi: 10.1097/01.jnen.0000199572.96472.1c. [DOI] [PubMed] [Google Scholar]
- Seya T, Akazawa T, Tsujita T, Matsumoto M. Role of Toll-like receptors in adjuvant-augmented immune therapies. Evid Based Complement Alternat Med. 2006;3:31–38. doi: 10.1093/ecam/nek010. [DOI] [PMC free article] [PubMed] [Google Scholar]
- Seya T, Akazawa T, Uehori J, Matsumoto M, Azuma I, Toyoshima K. Role of toll-like receptors and their adaptors in adjuvant immunotherapy for cancer. Anticancer Res. 2003;23:4369–4376. [PubMed] [Google Scholar]
- Sharma S, tenOever BR, Grandvaux N, Zhou GP, Lin R, Hiscott J. Triggering the interferon antiviral response through an IKK-related pathway. Science. 2003;300:1148–1151. doi: 10.1126/science.1081315. [DOI] [PubMed] [Google Scholar]
- Si Q, Kim MO, Zhao ML, Landau NR, Goldstein H, Lee S. Vpr- and Nef-dependent induction of RANTES/CCL5 in microglial cells. Virology. 2002;301:342–353. doi: 10.1006/viro.2002.1613. [DOI] [PubMed] [Google Scholar]
- Si Q, Zhao ML, Morgan AC, Brosnan CF, Lee SC. 15-deoxy-Delta12,14-prostaglandin J2 inhibits IFN-inducible protein 10/CXC chemokine ligand 10 expression in human microglia: mechanisms and implications. J Immunol. 2004;173:3504–3513. doi: 10.4049/jimmunol.173.5.3504. [DOI] [PubMed] [Google Scholar]
- Streit WJ, Conde JR, Fendrick SE, Flanary BE, Mariani CL. Role of microglia in the central nervous system's immune response. Neurol Res. 2005;27:685–691. doi: 10.1179/016164105X49463a. [DOI] [PubMed] [Google Scholar]
- Suh HS, Kim MO, Lee SC. Inhibition of granulocyte-macrophage colony-stimulating factor signaling and microglial proliferation by anti-CD45RO: role of Hck tyrosine kinase and phosphatidylinositol 3-kinase/Akt. J Immunol. 2005;174:2712–2719. doi: 10.4049/jimmunol.174.5.2712. [DOI] [PubMed] [Google Scholar]
- Suh HS, Zhao ML, Rivieccio M, Choi S, Connolly E, Zhao Y, Takikawa O, Brosnan CF, Lee SC. Astrocyte indoleamine 2, 3 dioxygenase (IDO) is induced by the TLR3 ligand poly IC: mechanism of induction and role in anti-viral response. J Virol. 2007 doi: 10.1128/JVI.00792-07. [DOI] [PMC free article] [PubMed] [Google Scholar]
- Sun J, Zheng JH, Zhao M, Lee S, Goldstein H. Increased in vivo activation of microglia and astrocytes in the brains of mice transgenic for an infectious R5 human immunodeficiency virus type 1 provirus and for CD4-specific expression of human cyclin T1 in response to stimulation by lipopolysaccharides. J Virol. 2008;82:5562–5572. doi: 10.1128/JVI.02618-07. [DOI] [PMC free article] [PubMed] [Google Scholar]
- Tabeta K, Georgel P, Janssen E, Du X, Hoebe K, Crozat K, Mudd S, Shamel L, Sovath S, Goode J, Alexopoulou L, Flavell RA, Beutler B. Toll-like receptors 9 and 3 as essential components of innate immune defense against mouse cytomegalovirus infection. Proc Natl Acad Sci U S A. 2004;101:3516–3521. doi: 10.1073/pnas.0400525101. [DOI] [PMC free article] [PubMed] [Google Scholar]
- Taniguchi M, Miura K, Iwao H, Yamanaka S. Quantitative assessment of DNA microarrays--comparison with Northern blot analyses. Genomics. 2001;71:34–39. doi: 10.1006/geno.2000.6427. [DOI] [PubMed] [Google Scholar]
- Town T, Jeng D, Alexopoulou L, Tan J, Flavell RA. Microglia recognize double-stranded RNA via TLR3. J Immunol. 2006;176:3804–3812. doi: 10.4049/jimmunol.176.6.3804. [DOI] [PubMed] [Google Scholar]
- Wang H, Sun J, Goldstein H. Human immunodeficiency virus type 1 infection increases the in vivo capacity of peripheral monocytes to cross the blood-brain barrier into the brain and the in vivo sensitivity of the blood-brain barrier to disruption by lipopolysaccharide. J Virol. 2008;82:7591–7600. doi: 10.1128/JVI.00768-08. [DOI] [PMC free article] [PubMed] [Google Scholar]
- Wang J, Alvarez R, Roderiquez G, Guan E, Caldwell Q, Wang J, Phelan M, Norcross MA. CpG-independent synergistic induction of beta-chemokines and a dendritic cell phenotype by orthophosphorothioate oligodeoxynucleotides and granulocyte-macrophage colony-stimulating factor in elutriated human primary monocytes. J Immunol. 2005;174:6113–6121. doi: 10.4049/jimmunol.174.10.6113. [DOI] [PubMed] [Google Scholar]
- Wang T, Town T, Alexopoulou L, Anderson JF, Fikrig E, Flavell RA. Toll-like receptor 3 mediates West Nile virus entry into the brain causing lethal encephalitis. Nat Med. 2004;10:1366–1373. doi: 10.1038/nm1140. [DOI] [PubMed] [Google Scholar]
- Zucchini N, Bessou G, Traub S, Robbins SH, Uematsu S, Akira S, Alexopoulou L, Dalod M. Cutting Edge: Overlapping Functions of TLR7 and TLR9 for Innate Defense against a Herpesvirus Infection. J Immunol. 2008;180:5799–5803. doi: 10.4049/jimmunol.180.9.5799. [DOI] [PubMed] [Google Scholar]
Associated Data
This section collects any data citations, data availability statements, or supplementary materials included in this article.