Abstract
Fluorescence recovery after photobleaching and fluorescence correlation spectroscopy are the primary means for studying translational diffusion in biological systems. Both techniques, however, present numerous obstacles for measuring translational mobility in structures only slightly larger than optical resolution. We report a new method using through-prism total internal reflection fluorescence microscopy with continuous photobleaching (TIR-CP) to overcome these obstacles. Small structures, such as prokaryotic cells or isolated eukaryotic organelles, containing fluorescent molecules are adhered to a surface. This surface is continuously illuminated by an evanescent wave created by total internal reflection. The characteristic length describing the decay of the evanescent intensity with distance from the surface is smaller than the structures. The fluorescence decay rate resulting from continuous evanescent illumination is monitored as a function of the excitation intensity. The data at higher excitation intensities provide apparent translational diffusion coefficients for the fluorescent molecules within the structures because the decay results from two competing processes (the intrinsic photobleaching propensity and diffusion in the small structures). We present the theoretical basis for the technique and demonstrate its applicability by measuring the diffusion coefficient, 6.3 ± 1.1 µm2/sec, of green fluorescent protein (GFP) in Escherichia coli cells.
Keywords: fluorescence microscopy, fluorescent proteins, protoplasmic mobility, total internal reflection
Introduction
Translational diffusion is central to most biological processes especially in prokaryotic cells. Since these cells lack the motor proteins and developed cytoskeletal networks of higher organisms, diffusion is often their primary source of intracellular movement. Measuring diffusion in micron-sized structures, however, is challenging because of their small size compared to classical optical resolution.
The primary method for measuring diffusion in biological systems, fluorescence recovery after photobleaching (FRAP) with a small focused spot,1,2 suffers from the fact that the smallest focused laser spot used for illumination is not much smaller than an Escherichia coli cell or an organelle.3 Thus, not only is optical alignment difficult, but also the quantity of unbleached molecules that can contribute to fluorescence recovery is limited. These effects reduce the signal-to-noise ratio and complicate data analysis. In addition, the recovery time associated with a small, focused spot and solute diffusion is too rapid for many conventional, simpler instruments. Despite these challenges, diffusion of green fluorescent protein (GFP) has been measured in E. coli with a combination of confocal microscopy and bleaching of a significant portion of the cell.4–6
Fluorescence correlation spectroscopy (FCS) is the other primary method for measuring translational diffusion in biological systems.2,7,8 FCS suffers in the context of small, contained structures, since the size of the illuminated region is on the same order of magnitude as the structures. Consequently, there is only a small population of non-illuminated molecules. Under such conditions, the fluorescence fluctuations can be recorded for only a short time before the reservoir of unbleached molecules is depleted by photobleaching. This limitation significantly reduces the signal-to-noise ratio of the fluorescence fluctuation autocorrelation function. Nonetheless, FCS has been successfully employed to measure protein diffusion coefficients in E. coli cells.9 The method is limited, however, to low concentrations of fluorescent molecules.
Continuous fluorescence microphotolysis or continuous photobleaching (CP) is an alternate method for characterizing lateral diffusion in biological systems. In CP, a small region of a fluorescently labeled sample is continuously illuminated such that two competing processes arise—photobleaching of fluorophores in the illuminated region and fluorescence recovery due to diffusion of unbleached fluorophores from surrounding regions into the illuminated region. By monitoring the rate and shape of the fluorescence decay, rate constants for the two processes can be determined by fitting to appropriate theoretical forms.10,11 Recently, CP has been used, along with FCS, to measure diffusion and compartmentalization in giant unilamellar vesicles and in large living cells.12 The results of CP, FCS, spatial imaging, and confocal microscopy have been used together to analyze diffusion of intracellular molecules and binding to specific sites in cells.13 CP has also been combined with 4Pi microscopy to obtain higher spatial resolution.14 Pulsed FRAP, a modification that combines CP and FRAP, has been used with confocal microscopy to measure the diffusion coefficients of fluorescent proteins in E. coli.15
Total internal reflection (TIR) has previously been combined with FRAP to measure solute diffusion in eukaryotic cells.16 The small penetration depth of the evanescent wave results in photobleaching only near the interface. Since this depth is much smaller than the diameter of the laser beam, a one-dimensional geometry can be used to simplify the mathematical diffusion model. The small penetration depth, however, also leads to fast recovery, thus requiring special equipment (e.g., acousto-optic modulators).
Here, we combine total internal reflection and continuous photobleaching to demonstrate a new method, TIR-CP, for characterizing the translational diffusion of fluorescent molecules contained in structures only slightly larger than classical optical resolution. These structures are deposited on a surface at which a laser beam is internally reflected, such that the resulting evanescent intensity illuminates only those fluorescent molecules close to the surface. The sample is continuously photobleached as a function of the excitation intensity. As in CP, two competing processes contribute to the rate and shape of fluorescence decay. At low intensities, the decay is determined by the photobleaching rate within the evanescent wave. At higher intensities, the decay is also affected by diffusion of the fluorescent molecules. Thus, the diffusion coefficient of the fluorescent molecules within the small structures can be determined by acquiring data as a function of the excitation intensity. This paper describes the theoretical basis for this new method and demonstrates its applicability by measuring the diffusion coefficient of GFP in E. coli cells.
Theory
Conceptual Basis
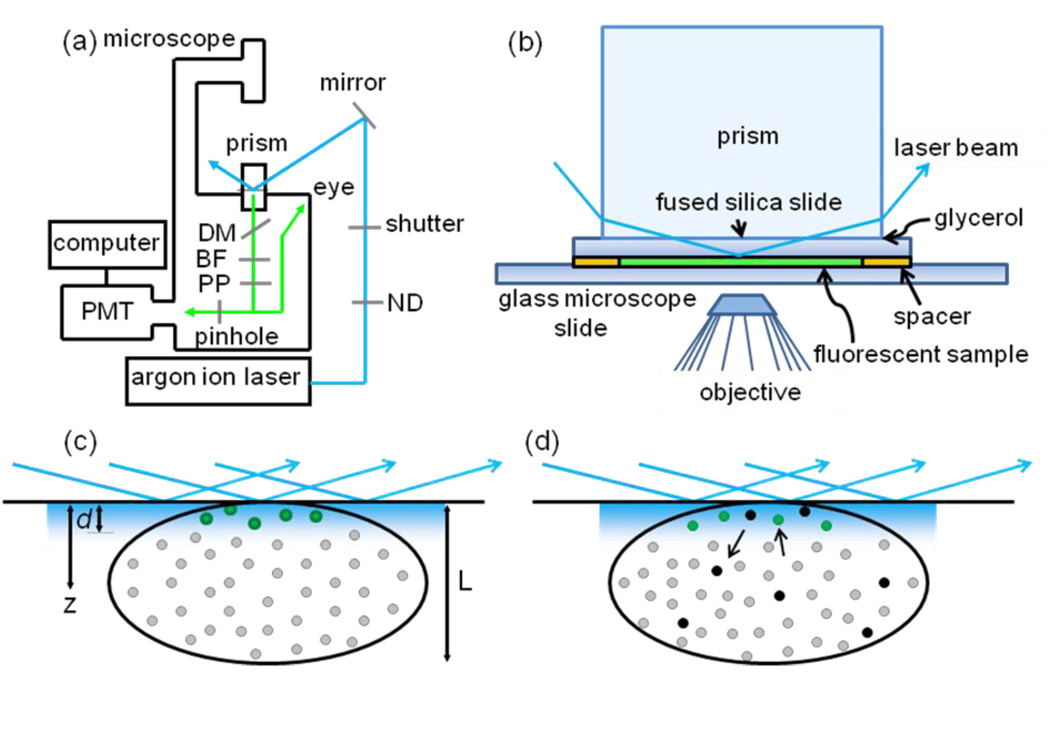
The notion behind the new method is illustrated in Fig. 1. Small structures of average length L are deposited on a surface at which a laser beam is internally reflected. The evanescent intensity decays with distance z from the surface and with a spatial profile in the x–y plane as
| (1) |
where I0 is the intensity at the interface (z = 0) and at the spot center (x = y = 0).17 The characteristic distance for the evanescent wave decay, d, depends on the excitation wavelength, the incidence angle, and the refractive indices of the two materials at which internal reflection occurs. Parameters wx and wy are 1/e2 values for the elliptical Gaussian shape of the internally reflected beam in the sample plane and dsepend on the initial beam radius as well as the optical parameters used to generate internal reflection.
FIGURE 1.
Through-Prism Total Internal Reflection with Continuous Photobleaching (TIR-CP). (a) Schematic of the instrumentation: PMT, photomultiplier tube; BF, barrier filter; DM, dichroic mirror; PP, polarization paper (see Methods); ND, neutral density filter. (b) A fused silica prism is optically coupled with glycerol to a sandwich made from fused silica and microscope slides. (c) Small structures that extend a distance L into the solution are attached to the lower surface of the fused silica slide. A laser beam is internally reflected at the interface of the fused silica slide and the internal solution of the sandwich to create an evanescent field whose intensity decays exponentially with distance, z, from the interface. The characteristic distance of this decay, d, is much smaller than L. Molecules contained within the small structure do not fluoresce (grey circles) until they diffuse into the surface-associated evanescent field. (d) Eventually, the fluorescent molecules (green circles) are permanently bleached (black circles) by exposure to the evanescent field. At low excitation intensities, the decay of evanescently excited fluorescence with time is dominated by the propensity for photobleaching. At high excitation intensities, the decay of fluorescence with time is dominated by diffusion through the length of the small structure.
The observed sample volume is defined by the depth of the evanescent intensity and by a pinhole placed at a back image plane of an optical microscope through which the fluorescence is collected. The pinhole, which is positioned to correspond to the center of the illuminated region (x = y = 0), restricts fluorescence observation to a small volume so that the collected fluorescence is low enough to be measurable even at relatively high excitation intensities. For the same reason, fluorescence is collected though a low numerical aperture objective. The low numerical aperture does not compromise z-axis resolution, which is very thin as defined by the evanescent excitation intensity. The observed area is small enough so that only a few of the small structures are present in this area.
The sample’s fluorescence is monitored as a function of time, t, with t = 0 corresponding to the onset of illumination. The time-dependent fluorescence decays to zero as molecules within the evanescent wave are photobleached and the reservoir of unbleached molecules within the small structure is depleted. Two competing processes, diffusion and photobleaching, contribute to the rate and shape of fluorescence decay. At low intensities, the decay is determined by the photobleaching rate within the evanescent wave. At high enough intensities, the photobleaching rate is fast enough that the diffusion of unbleached molecules into the evanescent wave becomes the rate limiting step. By acquiring data as a function of the excitation intensity, the diffusion coefficient of the fluorescent molecules within the small structure is determined.
Concentration of Unbleached Molecules as a Function of Space and Time
The evanescently illuminated area is much larger than the observed area, and the pinhole is placed at the center of this illumination. Since the sample radius (∼ 5 µm) is much less than wx and wy (22 and 65 µm respectively), the intensity at z = 0 does not vary much over the observed area in the x–y plane. The intensity at z = 0 also does not vary significantly as a function of x and y for a given cell because an E. coli cell is smaller than the observed area. Furthermore, the characteristic distance of the evanescent wave decay (d ∼ 0.1 µm) is much less than the length of a cell in the z-direction (L ∼ 2 µm). For these reasons, the mathematical problem is approximately one-dimensional in space with the key coordinate being z. The evanescent intensity (Eq. 1) is then approximated as
| (2) |
and the concentration of unbleached molecules is assumed not to depend on coordinates x and y. As a result, an approximate differential equation for the concentration of unbleached molecules is spatially one-dimensional and depends only on the distance from the interface, z, and the time, t. This equation is
| (3) |
where U(z,t) is the concentration of unbleached molecules as a function of space and time, and D is the diffusion coefficient. Unlike similar theories,10,11 Eq. 3 lacks a term describing photobleaching, because photobleaching occurs only at or near the illuminated surface. Instead, this process is described by a boundary condition (Eq. 6, see below).
The initial condition is
| (4) |
where C is the total concentration of fluorescent molecules. One boundary condition is
| (5) |
where L is the length of the cell measured from the surface into the solution. This “reflection” condition expresses the notion that the flux across the boundary of the structure far from the interface is zero. The other boundary condition is
| (6) |
where κ is a proportionality constant describing the photobleaching propensity with units of intensity−1 time−1.18
The general solution to Eq. 3 is
| (7) |
where A, B and β are constants. Eqs. 5–7 [i.e., the two boundary conditions and the general solution] imply that
| (8) |
These two equations yield a discrete, countably infinite number of β and x values defined by
| (9) |
where xn (for n = 1,2,3,…) and c are dimensionless quantities.
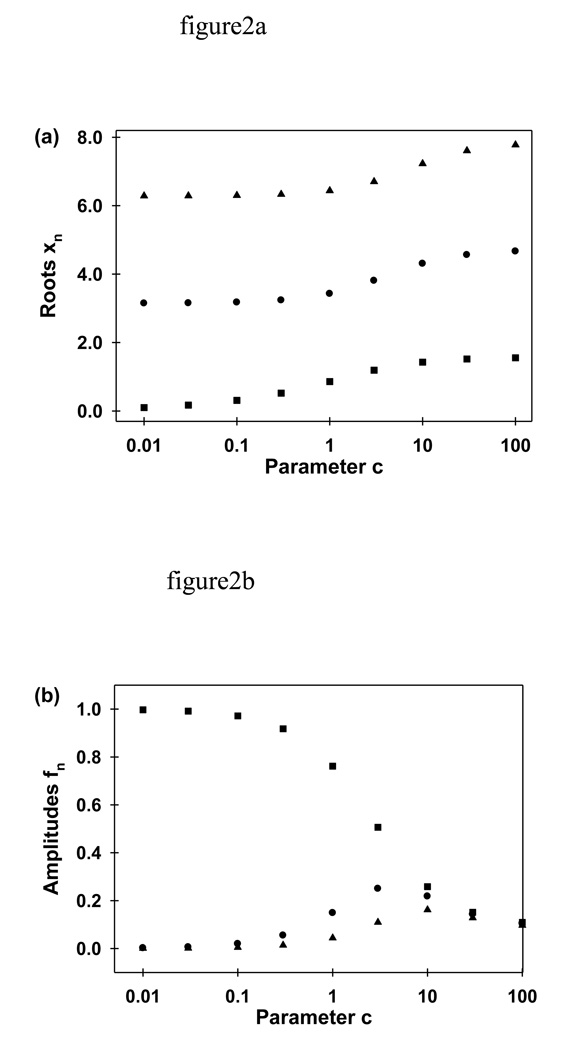
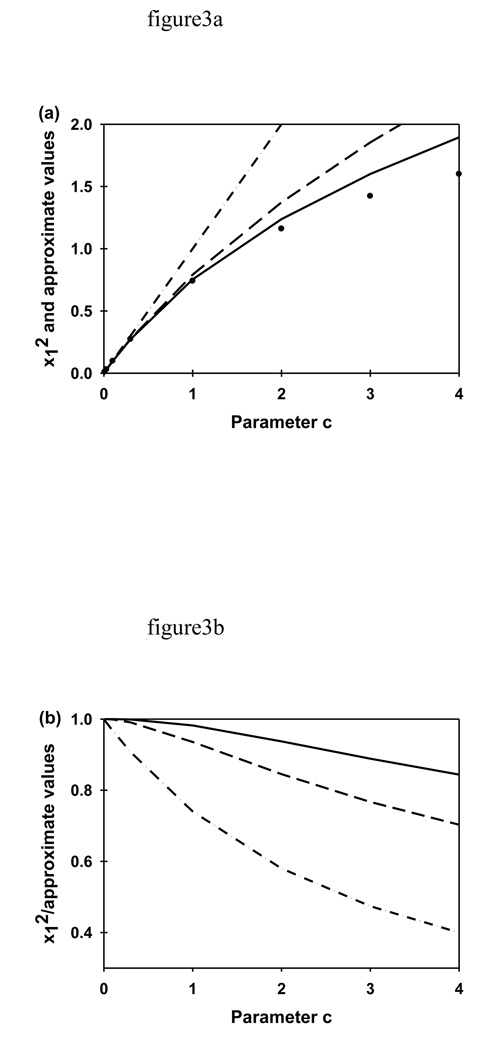
The values of x1, x2 and x3 (determined numerically) are shown in Fig. 2a as a function of c, which is proportional to the excitation intensity, I0 (Eqs. 9). The values of xn have the following properties. First, (n-1)π ≤ xn ≤ (2n-1)π/2. Second, xn increases with c. At extremely low intensities, c ≈ 0, tan(x1) ≈ 0, and x12 ≈ 0. At higher intensities, tan(x1) ≈ x1 and x12 ≈ c. As shown in Fig. 3, this approximation is accurate within 10% up to c ≤ 0.3. At even higher intensities,
| (10) |
FIGURE 2.
Parameters xn and fn. Fluorescence decay during continuous photobleaching is described by an infinite sum of exponentials with rates D(xn/L)2, where D is the diffusion coefficient and L is the cell length (Eqs. 9 and 19). The parameters xn are a discrete, countably-infinite set of values that are determined by the value of the parameter c. Parameter c depends on experimental conditions (D, L, the depth of the evanescent wave d, and the bleaching propensity κ). Most importantly, c is proportional to the excitation intensity I0. The parameters fn are amplitudes associated with the different exponentially decaying terms and are defined, in general, by the values of c, L, d and xn. (a) The values of x1 (■), x2 (●) and x3 (▲) were calculated numerically as a function of c by using Eq. 9. (b) The values of f1 (■), f2 (●) and f3 (▲) were calculated by using Eq. 19 with L = 2.2 µm and d = 0.1 µm. At low c values, the first amplitude, f1 is much larger than the others and the fluorescence decay can be approximated as a single exponential with rate D(x1/L)2. In addition, for many experimental conditions, the terms associated with rates having n > 1 decay too rapidly to affect the observed fluorescence decay.
FIGURE 3.
Accuracy of x12 Approximations. Parameters xn and c are described in the caption to Fig. 2. (a) This plot shows x12 approximated as c (-·.-·) (see text), as Eq. 10 (- - -) and as Eq. 11 (—) compared with the numerically determined values (●) as a function of the parameter c (Eq. 9). (b) This plot shows the corresponding ratios of the actual x12 values divided by the approximations as a function of c, such that values close to one represent an accurate approximation. As shown, Eq. 11 is a good approximation for the experimental conditions used in this work (c ≤ 2).
As shown in Fig. 3, this approximation is accurate within 10% up to c ≤ 1.5. At even higher intensities,
| (11) |
As shown in Fig. 3, this approximation is accurate within 10% up to c ≤ 2.9. For extremely large intensities, c → ∞ and x1 → π/2.
| (12) |
| (13) |
| (14) |
Multiplying both sides of Eq. 14 by the factor,
| (15) |
and integrating z from zero to L (with Eq. 9) implies that
| (16) |
It can be shown in a straightforward manner (with Eq. 9) that each term in Eq. 16 satisfies Eqs. 3, 5 and 6. The consistency of Eq. 16 with Eq. 4 can be demonstrated numerically.
Fluorescence Decay During Continuous Photobleaching
The observed fluorescence during continuous photobleaching at (x,y) = (0,0), is given by (Eqs. 2, 9 and 16)
| (17) |
where Q is a proportionality constant. The initial fluorescence value is (Eqs. 4 and 17)
| (18) |
Thus,
| (19) |
For our experimental conditions, d ≈ 0.1 µm and L ≈ 2.2 µm (see below). Fig. 2b shows the values of f1, f2 and f3 as function of c, for these values of d and L. As shown, f1 drops below 0.9 only for c > 0.3. Thus, for c < 0.3, the fluorescence decay can be accurately approximated by a single exponential with rate R1 = D(x1/L)2. For our experimental conditions, c ≤ 2 (see below). As shown in Fig. 2b, for 0.3 ≤ c ≤ 2, f1 ranges from 0.9 to 0.6. Therefore, one might expect that multi-exponential analysis would be required for the higher intensities. For these intensities, however, the second rate, R2 = D(x2/L)2, ranges from 5–18 sec−1 (see below), faster than the time resolution of our software (50 msec), and contributions to f(t) from terms with n > 1 are negligible. Therefore, we evaluate all data as a single exponential with rate, R, where
| (20) |
Limits as a Function of Intensity Parameter c
When c is small (≈ 0), x12 ≈ 0 (Eq. 9), and Eq. 20 predicts the expected result that R ≈ 0 and f(t) ≈ 1 is constant with time. In other words, for very low intensities, photobleaching does not occur. When c is small but nonzero, tan(x1) ≈ x1, x12 ≈ c and Eqs. 9 and 20 predict that
| (21) |
The ratio x12/c ≥ 0.9 for c ≤ 0.3 (Fig. 3b). In this limit, diffusion within the small structure is fast enough so that the fluorescence decay rate R does not depend on D but only on d, L, κ, and the intensity, as expected. In addition, R is linear with the intensity. For extremely high intensities (c → ∞), xn ≈ (2n-1)π/2, cos(xn) ≈ 0, cd >> L, c2 >> c. Also, d << L. By using these approximations and the method of partial fractions, one can thus show that (Eq. 19)
| (22) |
As expected, for high intensities, the fluorescence decay depends only on d, D and L and not on the intensity.
Measurements with Immobilized GFP
To determine the approximate value of κ, the decay of fluorescence with time was measured with purified GFP immobilized on the surface. In this case,
| (23) |
where F(t) is proportional to the density of unbleached GFP on the surface.
Methods
GFP Expression
The pAcGFP1 vector (BD BioSciences Clontech, Palo Alto, CA), which contains the gene for a nondimerizable GFP19 with 94% identity to EGFP, was transformed into E. coli BL2-Gold (DE3) competent cells (Stratagene, La Jolla, CA) and plated on Luria Broth plates containing 1 µg/mL ampicillin (LBAMP). A starter culture of liquid LBAMP was inoculated with a single colony and grown overnight at 37°C with constant shaking at 225 rpm. This starter culture was used to inoculate (1:25 dilution) 25 mL of fresh LBAMP in a 250mL flask. Once the optical density at 600 nm was between 0.5 to 0.7, the culture was induced with a final concentration of 1-mM isopropyl-β-D-thiogalactopyranoside (IPTG) and allowed to grow at 37°C with constant shaking at 225 rpm.
GFP Purification
One L of culture prepared as described above was harvested 4 h after induction by centrifugation (Sorvall RC-3B, Sorvall Instruments, Newtown, CT) at 1600 g for 30 min at 4°C. The pellet was resuspended in 30 mL of lysis buffer [20-mM Tris (pH 8.0), 200-mM NaCl, 1-mM EDTA, 1-mM PMSF, 1-mM DNase, 1-mM RNase] and pulse sonicated (Branson Ultrasonics, China) at 4°C (18% amplitude) for two rounds of 5 min each. Cell debris were removed by centrifugation (Sorvall RC-5B with a SS-34 rotor) at 27000 g. After dialyzing overnight at 4°C against 20-mM Tris buffer (pH 8), the sample was purified by using anion exchange chromatography (HiLoad 16/10 Q Sepharose, AKTA FPLC UPC-900, GE Healthcare, Piscataway, NJ) in 20-mM Tris buffer using a linear gradient from 0-M to 1-M NaCl. The fractions containing GFP were concentrated in an Amicon Ultra MWCO 3,000 centrifugal filter unit (Millipore, Billerica, MA) and dialyzed into water. The protein was further purified by using size exclusion chromatography (16/60 superdex 75, GE Healthcare) with water. The purity was confirmed by using SDS-PAGE (18%) with Coomassie Brilliant Blue staining.
Sample Preparation
Fused silica slides (1” × 1” × 1 mm, Quartz Scientific, Fairport Harbor, OH) and glass microscope slides (3” × 1” × 1 mm, Fisher Scientific, Fair Lawn, NJ) were boiled in ICN detergent (MP Biomedicals, Solon, OH) for 10 min, bath-sonicated for 30 min, rinsed thoroughly with deionized water, and dried overnight at 160°C. The dried slides were cleaned in an argon-ion plasma cleaner (PDC-3XG, Harrick Scientific, Ossining, NY) for 15 min at 25°C immediately prior to use. The fused silica slides were pretreated with a 0.01% (w/v) poly-L-lysine solution (Sigma-Aldrich, St. Louis, MO) for 15 min, rinsed with minimal media [7.6-mM (NH4)2SO4, 60-mM K2HPO4, 2-mM MgSO4, 20-µM FeSO4, 1-mM EDTA (pH6.8)], and attached to a microscope slide with double-sided tape (Part No. 021200-64988, 3M Corp, St. Paul, MN) to form a sandwich. For osmotic stress measurements, the minimal media rinse contained 250-mM sorbitol (0.390 osmolal). The samples, which consisted of either bacterial cultures collected 3 h after induction or 2-µM purified GFP containing 5-mg/mL bovine serum albumin (Sigma-Aldrich, St. Louis, MO), were injected into the sandwiches. After incubating for 30 min at 25°C, the sample chamber was rinsed with minimal media and sealed with vacuum grease.
Total Internal Reflection (TIR) Fluorescence Microscopy
Through-prism total internal reflection bleaching experiments were carried out on an instrument consisting of an inverted microscope (Zeiss Axiovert 35, Thornwood, NY), an argon ion-laser (Innova 90-3; Coherent, Palo Alto, CA), and a single-photon counting photomultiplier (RCA C31034A, Lancaster, PA). The instrument was controlled with an in-house LabVIEW program and DAQ board (PCI-MIO-16XE-50, Texas Instruments, Austin, TX). Experiments were conducted at 25oC by using an excitation wavelength of 488 nm and a laser power ≤ 500 mW. To achieve optimal excitation intensity without overloading the detector, a 100-µm diameter pinhole was inserted in a back intermediate image plane of the microscope and aligned to correspond with the center of the TIR illumination. Polarization paper (25% transmission, Edmund Optics, NT54-795) was also inserted after the dichroic mirror and barrier filter, but before the detector, to attenuate the signal. The bleaching intensity was varied by inserting neutral density filters in the beam path prior to excitation. The fluorescence decay was collected with a 10x, 0.25 numerical aperture objective for up to 90 sec.
Size of Evanescent Illumination
TIR was generated on a fused silica/microscope slide sandwich containing a 1-µM solution of Alexa Fluor 488 carboxylic acid, tetrafluorophenyl ester (Molecular Probes/Invitrogen, Carlsbad, CA) as described above. Five images of the TIR spot were collected with an AT200 CCD camera and software (Photometrics, Tucson, AZ). To determine wx and wy (Eq. 1), slices of the images with y = 0 or x = 0 were converted to pixel intensities W(x) or W(y) with the Photometrics software and plotted as a function of distance. The pixel dimension (0.87 µm) was determined by imaging a graticule. The data were fit in Sigma Plot (Systat Software Inc., San Jose, CA) to
| (24) |
or
| (25) |
with W0, wx(or wy), and γ (the background) as free parameters.
Intensity Values
For a given incident laser power, P, at z = 0 (Eq. 1),
| (26) |
The value of I0 was determined as
| (27) |
by using Eq. 27 with the known values of P, wx and wy.
Cell Length
Samples were prepared as described above except that 5-µg/mL FM1-43 membrane stain (Molecular Probes/Invitrogen, Carlsbad, CA) was added to the samples and No. 1.5 glass coverslips (Fischer Scientific, Fair Lawn, NJ) were used in place of the fused silica slides. The cells were imaged on a Zeiss 510 scanning confocal inverted microscope (Carl Zeiss, Thornwood, NY) with a 63x, 1.4 NA oil-immersion objective, a 65-µm pinhole, and an excitation wavelength of 488 nm. Sixteen 36.6-µm × 36.6-µm images were collected in the x–y plane by moving away from the coverslip in 0.2-µm increments. From these images, the maximum lengths of 110 cells in the z-direction were determined and averaged, yielding L = 2.2 ± 0.5 µm. Repeating this process for 107 sorbitol-treated cells gave L = 1.8 ± 0.5 µm.
Data Analysis
Fluorescence decays were fit to the following function by using Sigma Plot:
| (28) |
with F(0), R and φ (the background) as the free parameters. At least three (and often more) decay curves were collected for each I0 and the R values averaged. Three complete data sets were acquired. The average values of R as a function of I0, for the three data sets, were fit to Eq. 20 with x12 given by Eq. 11 and c given by Eq. 9. In these fits, L was fixed to 2.2 µm (see above) and the free parameters were D and b = κd. The process was repeated for the sorbitol-treated cells using L =1.8 µm (see above).
Results
Size of Evanescent Illumination in the x–y Plane and I0 Values
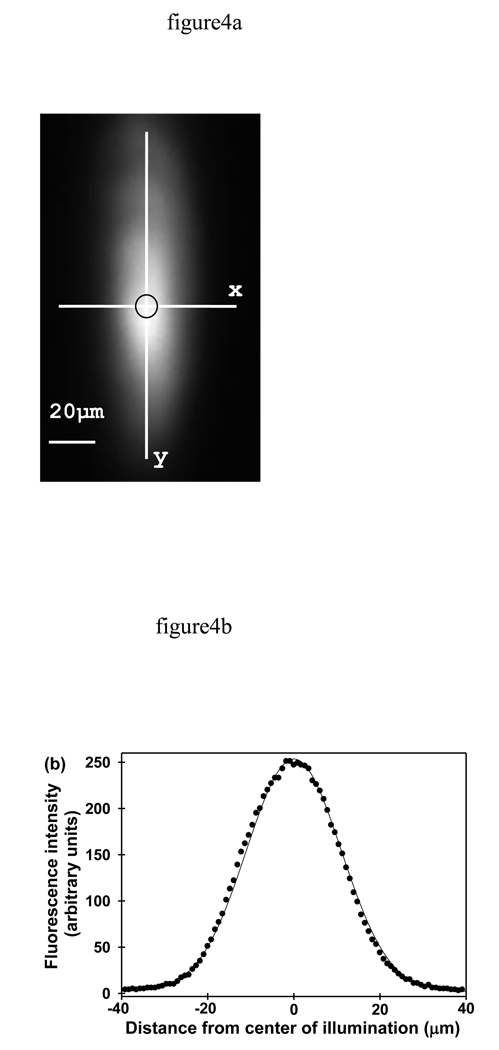
To determine the values of wx and wy (Eq. 1), five images of fused silica slides coated with Alexa Fluor 488 were acquired using an imaging detector (see Methods). As shown in Fig. 4a, the lateral intensity profile of the evanescent illumination appeared to be of an elliptical Gaussian shape.17 Images like those shown in Fig. 4a report the value of I(x,y,0) (Eqs. 1, 24, 25 and 26). The pixel intensities as a function of distance along the x-axis (y = 0) and along the y-axis (x = 0) were plotted for each image. These data were fit to Eqs. 24 and 25 and gave Gaussian-shaped curves as shown by the quality of the fits (Fig. 4b). The averages of the best-fit values were wx = 22.4 ± 0.5 µm and wy = 65.0 ± 0.4 µm. Excitation intensities I0 were then determined by using Eq. 27.
FIGURE 4.
Spatial Profile of the Evanescent Illumination in the x–y Plane. (a) Evanescently excited Alexa Fluor 488 dye was non-specifically adsorbed to the surface of fused silica. The circle indicates the observed area within the pinhole. (b) Data were obtained by slicing images with x = 0 or y = 0 and plotting the corresponding pixel intensities as a function of distance. A representative slice with y = 0 and its best fit to Eq. 24 is also shown.
Cell Length
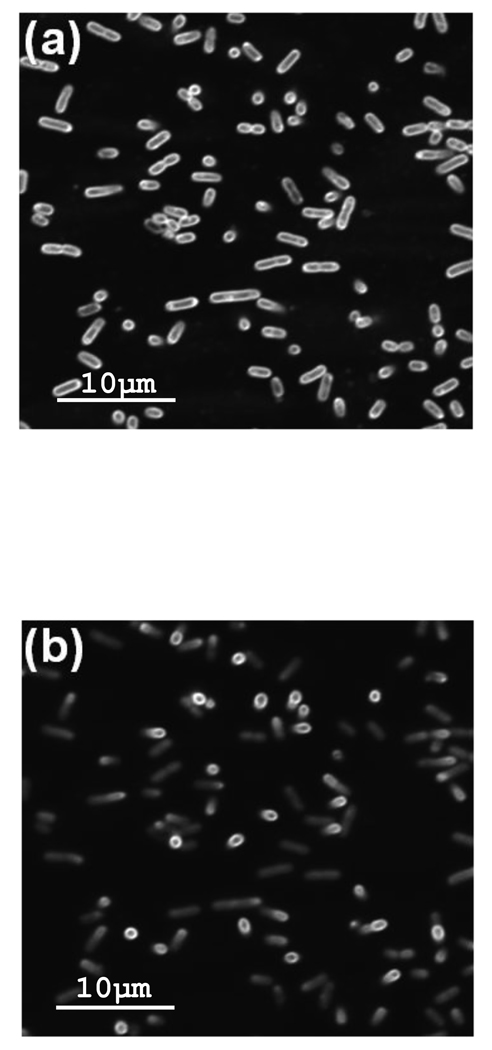
The cell length L was measured by using confocal microscopy and E. coli treated with the membrane stain FM1-43. Sixteen 36.6-µm by 36.6-µm images were collected in the x–y plane by moving away from the coverslip to which the E. coli were adhered in 0.2-µm increments. Fig. 5 shows two slices in the x–y plane of cells at different distances from the interface. The majority of the cells were ellipsoidal and had their major axis parallel to the interface. The circles in Fig. 5a are cells attached perpendicular to the interface and thus extend further into the solution. This result is apparent in Fig. 5b (the slice farther from the interface) where the ellipsoidal shaped cells have begun to fade, while the fluorescence of the circular cells remains strong. These images also confirmed that the cells were immobilized by the poly-L-lysine and that the GFP was contained within the cells. By averaging the maximum length in the z-direction of 110 cells in different spatial orientations, L was determined to be 2.2 ± 0.5 µm, which is consistent with the literature value.20,21 Repeating this process for 107 sorbitol-treated cells gave L = 1.8 ± 0.5 µm. With > 99% confidence (student’s t-test), the sorbitol-treated cells are shorter than non-treated cellst, since osmotic stress shrinks the cells.22
FIGURE 5.
Cell Length, L. E. coli cells expressing GFP were stained with FM1-43 dye and attached to poly-L-lysine coated coverslips. Using a confocal microscope, images were collected in the x–y plane by moving away from the coverslip in 0.2-µm increments. The images are 36.6 µm × 36.6 µm and were collected (a) 1.4 µm and (b) 2.4 µm from the coverslip.
Photobleaching Propensity
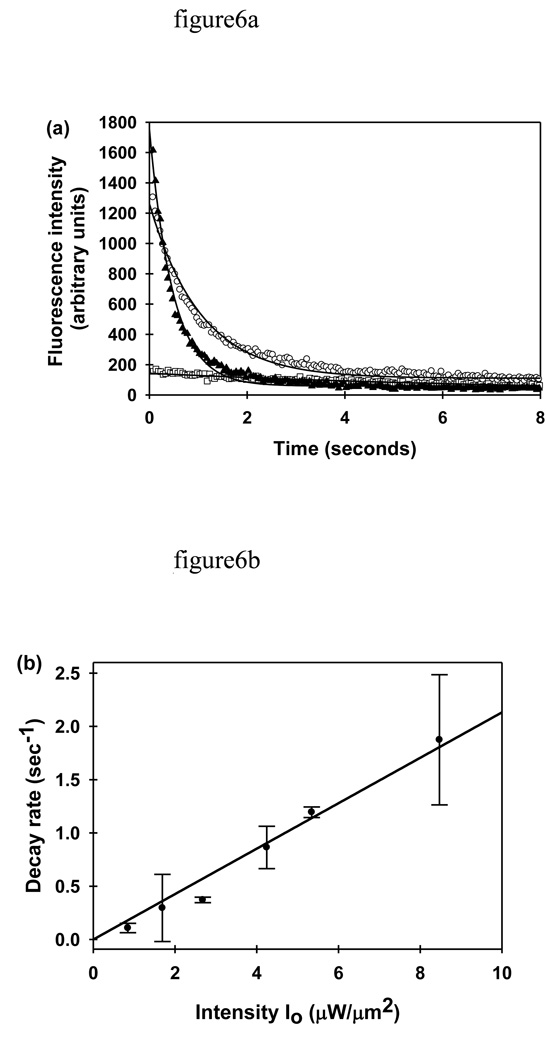
The propensity for photobleaching, described by the parameter κ (Eqs. 6, 9 and 23), was measured by monitoring the evanescently excited fluorescence decay of pure GFP immobilized on fused silica slides, as a function of time and excitation intensity. Fig. 6a shows three representative decay curves and the corresponding best fits to Eq. 28. At very low excitation intensities, bleaching was almost negligible. As the laser power was increased, so did the initial fluorescence intensity and the decay rate. As shown in Fig. 6b, the decay rate was linearly proportional to the excitation intensity. The slope of this line yields a κ (for immobilized GFP) of 0.21 ± 0.01 µm2 µW−1sec−1.
FIGURE 6.
Photobleaching Propensity for Immobilized GFP. (a) Representative evanescently excited fluorescence decay curves are shown for purified GFP immobilized on fused silica. The excitation intensities I0 were 0.9 (□), 4.3 (○), and 8.5 (▲) µW/µm2. The solid curves show the best fits of the data to Eq. 28. (b) The average fluorescence decay rate R is a linear function of the excitation intensity, I0.
Diffusion Coefficient of GFP in E. coli
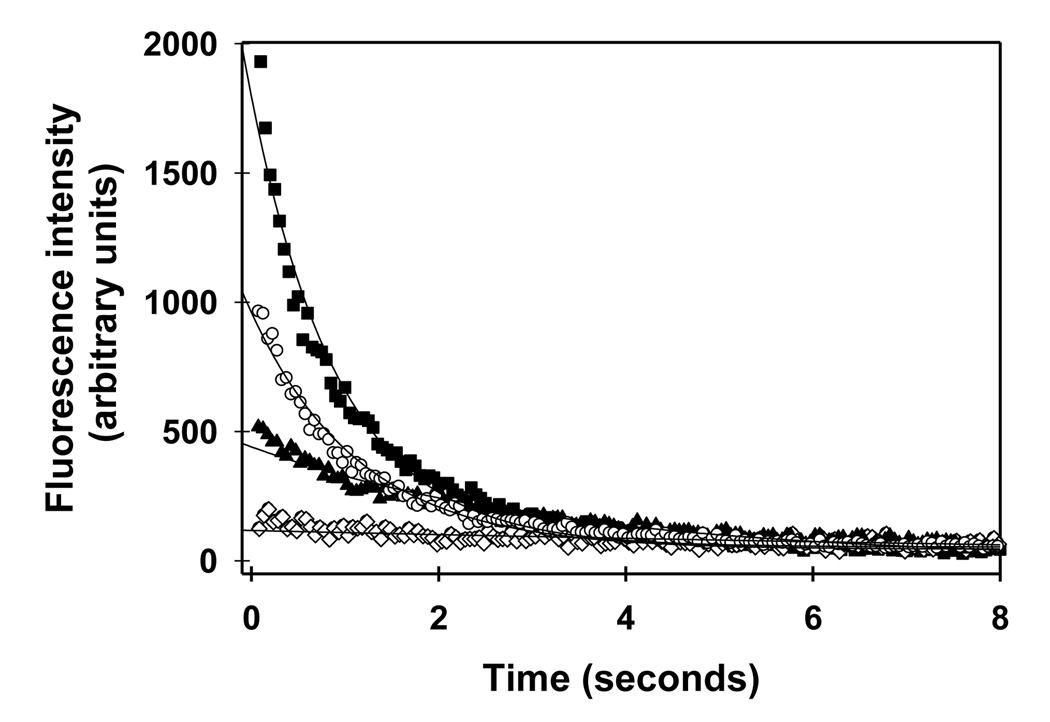
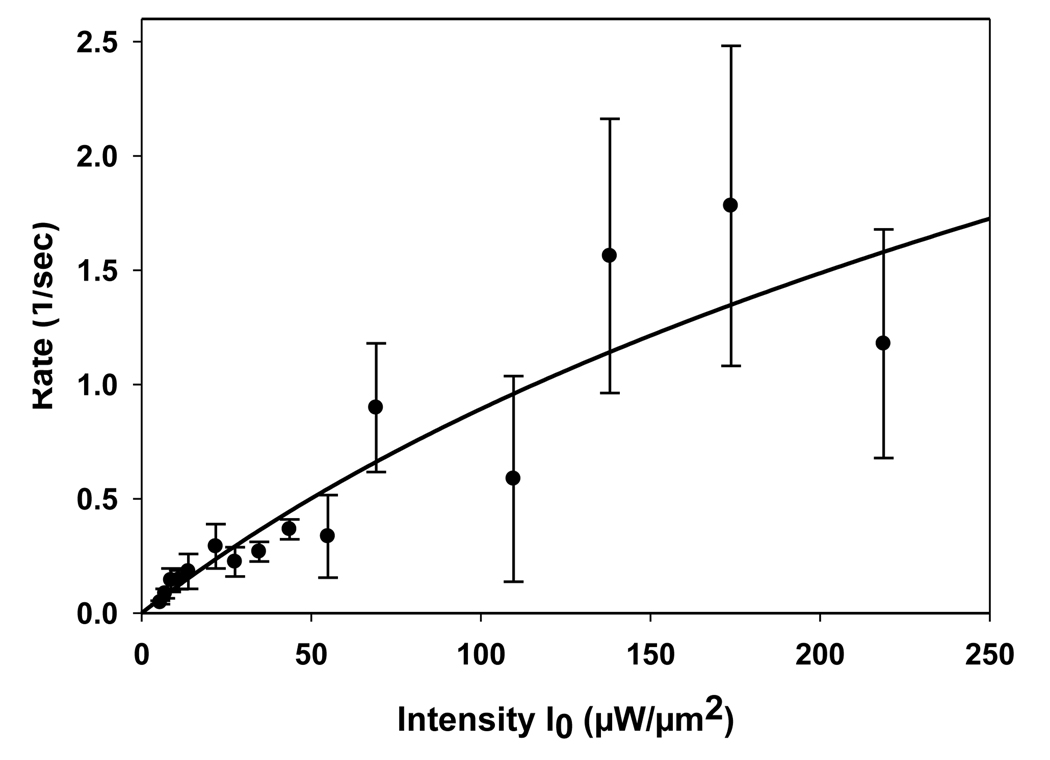
Three complete data sets for the intensity-dependent, evanescently-excited fluorescence decays of GFP in E. coli were acquired. Fig. 7 shows examples of typical decay curves collected from continuous photobleaching of the cells close to the adherent surface. For each decay curve, the decay rate constant, R, was determined by fitting the data to Eq. 28 with the intensity, I0, determined as described above. As expected, both F(0) and R increased with I0. For each data set, the average values of R as a function of I0 were then fit to Eq. 20 with L = 2.2 µm, x12 given by Eq. 11, and c given by Eq. 9. The free parameters were D and b = κd. A representative plot showing the experimental values and their best fits to this theoretical form is shown in Fig. 8. The best fit values of the free parameters for the three data sets were averaged to give D = 6.3 ± 1.1 µm2sec−1 and b = 0.026 ± 0.001 µm3 µW−1sec−1. In all cases, the parameter c was calculated by using Eq. 9 and the best-fit values of b and D along with the known values of L and I0. The maximum value of c was 2.0, validating the use of single-exponential fits and Eq. 11 (see above).
FIGURE 7.
Representative Evanescently Excited Fluorescence Decay Curves for GFP in E. coli Cells. The excitation intensities were 5 (◊), 35 (▲), 87 (○), and 220 (■) µW/µm2. The solid curves show the best fit of the data to Eq. 28.
FIGURE 8.
Diffusion Coefficient D and Parameter b for GFP in E. coli. Plot shows data from one data set in which the measured decay rates R are plotted as a function of the excitation intensities, I0. Rates represent an average of at least three measurements with uncertainties given as standard deviations. The line shows the best fit to Eq. 20 with x12 given by Eq. 11, L fixed at 2.2 µm, and free parameters D and b = dκ. In this case, D = 6.4 µm2sec−1, b = 0.025 µm3µW−1sec−1, the maximum value of c = 2.0 (Eq. 9), and correlation coefficient was 0.93.
The diffusion coefficient obtained by TIR-CP, 6.3 ± 1.1 µm2sec−1, agrees well with that measured by confocal-FRAP on the same system in our laborartory (data not shown). The measured coefficient also agrees well with literature values for GFP diffusion in E. coli cells. The most commonly referenced value4, 7.7 ± 2.5 µm2 s−1, was obtained by using confocal FRAP. Similar studies found D = 6.1 ± 2.4 µm2 s−1 5 and 3.2 µm2 s−1.15. Other groups have measured diffusion coefficients of GFP fusion proteins in E. coli that are also consistent with our value, such as TorA-GFP (30 kDa), 9.0 ± 2.1 µm2 s−1;6 cMBP-GFP (72 kDa), 2.5 ± 0.6 µm2 s−1;4 and CheY-GFP (40 kDa), 4.6 ± 0.8 µm2 s−1.9
The b parameter from the fits contains information about the propensity for GFP to photobleach, since b = κd. For our experimental conditions, d ≈ 0.1 µm23 and b = 0.026 ± 0.001 µm3 µW−1sec−1. Taken together, these values yield κ ≈ 0.26 µm2 µW−1sec−1, which is comparable to the value (0.21 ± 0.01 µm2µW−1sec−1) for the immobilized GFP (Fig. 6).
Several GFP variants have been reported to reversibly photobleach.16,24 To assess the degree of reversible photobleaching that might be occurring, confocal microscopy was used to bleach GFP throughout entire E coli cells and to monitor the intracellular fluorescence over time. Post-bleach fluorescence recovery was not observed, indicating that GFP is irreversibly photobleached over the time scale of the experiment (data not shown).
Effects of Osmotic Shock
To further confirm the validity of the new technique, we measured GFP diffusion in sorbitol-treated cells. Sorbitol, and other forms of osmotic shock, increase the intracellular concentration of macromolecules, which significantly decreases protein mobility.25 Data from confocal FRAP experiments show that GFP diffusion in E. coli cells decreases to 0.94 ± 0.55 µm2sec−1 in 392 milliosmolal solution.5 A similar study reported a diffusion coefficient of 1.8 µm2sec−1 in a 370 milliosmolal buffer.15 For TIR-CP experiments, three complete data sets were collected for GFP in E. coli exposed to a 390 milliosmolal sorbitol buffer and analyzed as described above. The diffusion coefficient decreased from 6.3 ± 1.1 µm2sec−1, to 3.05 ± 1.0 µm2sec−1in a sorbitol buffer.
Discussion
As shown here, total internal reflection illumination with continuous photobleaching (TIR-CP) can be used to monitor the translational mobility of fluorescent molecules within small structures that are only slightly larger than optical resolution. The structures are deposited on a surface such that the evanescent wave generated by internal reflection continuously photobleaches only those fluorescent molecules very near the surface (Fig. 1). The resulting fluorescence decay curves depend on two competing processes: photobleaching and diffusion. At low excitation intensities, the propensity for photobleaching determines the rate and shape of the fluorescence decay curves. At higher excitation intensities, the diffusion rate of the fluorescent molecules across the length of the small structure also affects the fluorescence decay curves. By examining the fluorescence decay as a function of the excitation intensity, the diffusion coefficient of the fluorescent molecules within the small structures can be determined. This new method was demonstrated by measuring the diffusion coefficient of GFP in E. coli. The measured diffusion coefficient agreed with those measured by different methods.4–6,9,15 In addition, data were acquired for GFP in E. coli subjected to an osmotically stressed environment and analysis of these data reported lower GFP diffusion coefficients. This result is also consistent with data obtained by different methods.5,15
As described in the Introduction, other techniques have also been developed for examining molecular mobility in small biological structures, particularly E. coli. The most well developed of these methods is confocal-FRAP. Two advantages of TIR-CP as compared to confocal-FRAP are that the evanescent illumination confines photobleaching to a smaller fraction of the E. coli volume and the simplicity of the required instrumentation. TIR-CP also avoids the complication of aligning a very small focused laser beam within the small structure of interest (e.g., E. coli). However, for both methods, either the shape of the E. coli must be approximated to obtain analytical theoretical forms for the exact geometry of a given E. coli must be measured and used in numerical simulations.
Confocal-FRAP monitors diffusion on a cell-by-cell basis, and, although data analysis is somewhat tedious, this method can provide diffusion coefficient histograms and correlations of intracellular molecular mobility with other cellular characteristics. In TIR-CP as described here, a few cells rather than one are in the observed volume. However, the possibility exists of generalizing TIR-CP by using a fast EMCCD camera and subsequent imaging. Because the evanescent intensity varies as a function of position (Fig 4), the entire range of intensity-dependent decay curves could be acquired from a single time-dependent image sequence. Given a dilute enough density of adherent cells, this method might also provide histograms of apparent diffusion coefficients, as well as correlations of mobility with other cellular properties.
A third method, TIR-FRAP, has also been used to measure the cytoplasmic mobility of fluorescent molecules close to the inner leaflet of membranes of surface adherent, large eukaryotic cells.16 TIR-FRAP has potential for being generalized to small cells such as E. coli. TIR has also been combined with FCS to monitor translational mobility close to surface-adsorbed model membranes.26 TIR-FCS could, in principle, measure membrane-local diffusion coefficients in small structures. Such potential TIR-FCS measurements, however, would suffer because the pool of unbleached molecules is limited in small structures. In addition, it has been demonstrated that the apparent diffusion coefficients of proteins close to membrane surfaces is significantly reduced due to hydrodynamic effects.27 Such potential measurements, therefore, would not directly report the overall apparent diffusion coefficient of fluorescent molecules throughout the structure.
In this paper we have used TIR-CP to examine protein diffusion in E. coli. This new method may also be applicable to other small biological structures such as phospholipid vesicles, isolated synaptic vesicles, and isolated organelles (e.g., mitochondria). Furthermore, the technique shows promise for use over a wide range of protein concentrations. While FCS is strictly limited to very low concentrations, confocal-FRAP becomes challenging at low concentrations due to poor signal-to-noise. In contrast, TIR-CP is applicable both to low and high concentrations, because of the range of excitation intensities available. Analysis at these concentrations may be important as it has been reported that the level of protein expression in E. coli may affect the protein diffusion coefficient.4 In addition, controlling the level of one protein while monitoring the diffusion coefficient of another protein might reveal not only concentration-dependent diffusion, but also provide insight about protein-protein interactions.
Acknowledgements
We thank Michael Chua of the UNC Microscopy Facility for assistance with confocal microscopy and Xiang Wang of UNC Chemistry for assistance with imaging the evanescent illumination. This work was supported by NSF Grants MCB-0641087 (NLT) and MCB-0516547 (GJP), an NSF Graduate Fellowship Award 2006037054 (KMS), and by NIH Director’s Pioneer Award DP10D783 (GJP).
References
- 1.Axelrod D, Koppel DE, Schlessinger J, Elson E, Webb WW. Biophys. J. 1976;16:1055. doi: 10.1016/S0006-3495(76)85755-4. [DOI] [PMC free article] [PubMed] [Google Scholar]
- 2.Lippincott-Schwartz J, Snapp E, Kenworthy A. Nat. Rev. Mol. Cell Biol. 2001;2:444. doi: 10.1038/35073068. [DOI] [PubMed] [Google Scholar]
- 3.Mullineaux CW. Methods Mol. Biol. 2007;390:3. doi: 10.1007/978-1-59745-466-7_1. [DOI] [PubMed] [Google Scholar]
- 4.Elowitz MB, Surette MG, Wolf PE, Stock JB, Leibler S. J. Bacteriol. 1999;181:197. doi: 10.1128/jb.181.1.197-203.1999. [DOI] [PMC free article] [PubMed] [Google Scholar]
- 5.Konopka MC, Shkel IA, Cayley S, Record MT, Weisshaar JC. J. Bacteriol. 2006;188:6115. doi: 10.1128/JB.01982-05. [DOI] [PMC free article] [PubMed] [Google Scholar]
- 6.Mullineaux CW, Nenninger A, Ray N, Robinson C. J. Bacteriol. 2006;188:3442. doi: 10.1128/JB.188.10.3442-3448.2006. [DOI] [PMC free article] [PubMed] [Google Scholar]
- 7.Thompson NL, Lieto AM, Allen NW. Curr. Opin. Struct. Biol. 2002;12:634. doi: 10.1016/s0959-440x(02)00368-8. [DOI] [PubMed] [Google Scholar]
- 8.Rigler R, Elson ES, editors. Fluorescence Correlation Spectroscopy, Theory and Applications. Springer Series in Chemical Physics, No. 65. Heidelberg, Germany: Springer-Verlag; 2001. [Google Scholar]
- 9.Cluzel P, Surette M, Leibler S. Science. 2000;287:1652. doi: 10.1126/science.287.5458.1652. [DOI] [PubMed] [Google Scholar]
- 10.Peters R, Brunger A, Schulten K. Proc. Natl. Acad. Sci. U.S.A. 1981;78:962. doi: 10.1073/pnas.78.2.962. [DOI] [PMC free article] [PubMed] [Google Scholar]
- 11.Brünger A, Peters R, Schulten K. J. Chem. Phys. 1985;82:2147. [Google Scholar]
- 12.Delon A, Usson Y, Derouard J, Biben T, Souchier C. Biophys. J. 2006;90:2548. doi: 10.1529/biophysj.105.069815. [DOI] [PMC free article] [PubMed] [Google Scholar]
- 13.Wachsmuth M, Weidemann T, Müller G, Hoffmann-Rohrer UW, Knoch TA, Waldeck W, Langowski J. Biophys. J. 2003;84:3353. doi: 10.1016/S0006-3495(03)70059-9. [DOI] [PMC free article] [PubMed] [Google Scholar]
- 14.Arkhipov A, Hüve J, Kahms M, Peters R, Schulten K. Biophys. J. 2007;93:4006. doi: 10.1529/biophysj.107.107805. [DOI] [PMC free article] [PubMed] [Google Scholar]
- 15.van den Bogaart G, Hermans N, Krasnikov V, Poolman B. Mol. Microbiol. 2007;64:858. doi: 10.1111/j.1365-2958.2007.05705.x. [DOI] [PubMed] [Google Scholar]
- 16.Swaminathan R, Bicknese S, Periasamy N, Verkman AS. Biophys. J. 1996;71:1140. doi: 10.1016/S0006-3495(96)79316-5. [DOI] [PMC free article] [PubMed] [Google Scholar]
- 17.Burghardt T, Thompson N. Opt. Eng. 1984;23:62. [Google Scholar]
- 18.Thompson NL, Burghardt TP, Axelrod D. Biophys. J. 1981;33:435. doi: 10.1016/S0006-3495(81)84905-3. [DOI] [PMC free article] [PubMed] [Google Scholar]
- 19.Yang F, Moss LG, Phillips GN., Jr Nat. Biotechnol. 1996;14:1246. doi: 10.1038/nbt1096-1246. [DOI] [PubMed] [Google Scholar]
- 20.Koch AL. The variability and individuality of the bacterium. In: Neidhardt F, editor. Escherichia coli and Salmonella typhimurium: Cellular and Molecular Biology. Vol. 2. Washington D.C.: American Society for Microbiology; 1987. p. 1608. [Google Scholar]
- 21.Cullum J, Vicente M. J. Bacteriol. 1978;134:330. doi: 10.1128/jb.134.1.330-337.1978. [DOI] [PMC free article] [PubMed] [Google Scholar]
- 22.Baldwin WW, Sheu MJ, Bankston PW, Woldringh CL. J. Bacteriol. 1988;170:452. doi: 10.1128/jb.170.1.452-455.1988. [DOI] [PMC free article] [PubMed] [Google Scholar]
- 23.Thompson NL, Pero J. In: Total internal reflection fluorescence microscopy: Applications in biophysics, in Fluorescence Spectroscopy in Biology: Advanced Methods and Their Applications to Membranes, Proteins, DNA and Cells. Wolfbeis O, Hof M, Hutterer R, Fidler V, editors. Berlin: Springer-Verlag; 2005. p. 79. [Google Scholar]
- 24.Sinnecker D, Voigt P, Hellwig N, Schaefer M. Biochemistry. 2005;44:7085. doi: 10.1021/bi047881x. [DOI] [PubMed] [Google Scholar]
- 25.Cayley S, Record MT., Jr Biochemistry. 2003;42:12596. doi: 10.1021/bi0347297. [DOI] [PubMed] [Google Scholar]
- 26.Starr TE, Thompson NL. Biophys. Chem. 2002;97:29. doi: 10.1016/s0301-4622(02)00037-6. [DOI] [PubMed] [Google Scholar]
- 27.Pero JK, Haas EM, Thompson NL. Journal of Physical Chemistry B. 2006;110:10910. doi: 10.1021/jp056990y. [DOI] [PubMed] [Google Scholar]


