Abstract
Extracellular DNA (eDNA) is produced by several bacterial species and appears to contribute to biofilm development and cell-cell adhesion. We present data showing that the oral commensals Streptococcus sanguinis and Streptococcus gordonii release DNA in a process induced by pyruvate oxidase-dependent production of hydrogen peroxide (H2O2). Surprisingly, S. sanguinis and S. gordonii cell integrity appears unaffected by conditions that cause autolysis in other eDNA-producing bacteria. Exogenous H2O2 causes release of DNA from S. sanguinis and S. gordonii but does not result in obvious lysis of cells. Under DNA-releasing conditions, cell walls appear functionally intact and ribosomes are retained over time. During DNA release, intracellular RNA and ATP are not coreleased. Hence, the release mechanism appears to be highly specific for DNA. Release of DNA without detectable autolysis is suggested to be an adaptation to the competitive oral biofilm environment, where autolysis could create open spaces for competitors to invade. Since eDNA promotes cell-to-cell adhesion, release appears to support oral biofilm formation and facilitates exchange of genetic material among competent strains.
The release of bacterial DNA into the environment is of recent interest since this polymer is now recognized to stabilize cell-to-cell adherence and biofilm architecture (1, 35, 37). Treatment of extracellular DNA (eDNA) with DNase results in reduced intercellular stickiness, consistent with an adhesive function for eDNA. Furthermore, eDNA from Neisseria meningitis appears to have sufficient structural integrity to transform competent strains (11), indicating chromosomal origin. Since the abundance of eDNA is influenced by growth conditions, DNA release can also be regulated (40).
DNA release is typically a consequence of cell lysis. Linked to DNA release, genetic transformation is the natural ability of competent bacterial species to take up DNA from the environment (13, 34, 42). During competence development, Streptococcus pneumoniae DNA is released by lysis of a subpopulation of cells (30, 42). Cell lysis and DNA release are controlled in a cell density-dependent signal transduction process. The S. pneumoniae comX regulon, carrying late competence genes, also includes the murein hydrolase genes lytA and cbpD (19, 42). Murein hydrolases digest structural components of the peptidoglycan, contributing to remodeling, recycling, and daughter cell separation. Furthermore, murein hydrolases trigger autolytic cell wall digestion, leading to release of DNA and other cellular content into the environment (36). The autolysis of bacterial cells as part of a regulated death program seems to be an important source for eDNA in diverse species, including Staphylococcus aureus (4, 36, 37), Staphylococcus epidermidis (35), Enterococcus faecalis (44), and Pseudomonas aeruginosa (1). In these species, the eDNA contributes to biofilm formation as a component of the extracellular biofilm matrix (35, 37, 44).
Unlike for cell lysis-dependent release, the oral streptococci appear to induce eDNA release by a novel mechanism. In dual-species cultures, the oral commensals Streptococcus sanguinis and Streptococcus gordonii release eDNA in a manner dependent on pyruvate oxidase (Pox) generation of hydrogen peroxide (H2O2) under the control of ambient oxygen (23). In this report, we now provide direct evidence of selective H2O2-induced eDNA release by these oral commensal streptococci.
MATERIALS AND METHODS
Bacterial strains and media.
S. sanguinis SK36 (48) and S. gordonii DL1 (32), and their isogenic Pox− mutants JKH1 and JKH2 (23), were routinely grown anaerobically (90% N2-5% CO2-5% H2) or aerobically (5% CO2) at 37°C in brain heart infusion broth (BHI; Difco, Sparks, MD) or on BHI agar plates. When required, cultures of JKH1 and JKH2 were supplemented to 500 μg ml−1 spectinomycin.
eDNA and eRNA quantification.
To determine the eDNA and extracellular RNA (eRNA) release kinetics during growth, S. sanguinis, S. gordonii, and their isogenic Pox− mutants were grown overnight in BHI (mutants supplemented with 500 μg spectinomycin). The overnight cultures were washed twice with fresh BHI medium to remove contaminating extracellular nucleic acids, diluted to an absorbance at 600 nm (A600) of approximately 0.05 in 20 ml BHI and incubated aerobically on a rocking platform for maximal H2O2 production (23). Under these conditions, neither S. sanguinis nor S. gordonii forms a biofilm due to shear forces generated by rocking. At the indicated times, cells were removed by centrifugation for 2 min at 16,000 × g at 4°C. Supernatants (1 ml) were transferred to new tubes containing 0.5 ml TE buffer (Tris-EDTA, pH 7.8 to 8.2) saturated with premixed phenol-chloroform-isoamyl alcohol (25:24:1) (saturated phenol at 25°C, pH of 6.5 to 6.9), and the mixture was vortexed for 30 s. To precipitate DNA, the mixture was centrifuged at 4°C for 5 min at 16,000 × g. The aqueous phase (0.8 ml) was removed and mixed with 80 μl of 3 M sodium acetate, pH 5.2, and 500 μl of 100% 2-propanol. The mixture was then centrifuged for 10 min at 16,000 × g, the supernatant was decanted, and the precipitated sample was air dried and suspended in 25 μl of deionized nuclease-free H2O (Fisher Scientific; Fair Lawn, NJ). Total DNA from 1 ml of cell suspension was extracted by mechanical disruption of cells as described earlier (50). DNA was precipitated in the same way as described for eDNA. To visualize nucleic acids, 1-μl samples were electrophoresed on 1% agarose gels and stained with ethidium bromide (1 μg/ml).
The relative quantity of chromosomal DNA (chDNA) was determined using a standard curve of dilutions (1:1, 1:5, 1:25, 1:125, and 1:625), using universal primers for the 16S rRNA genes (16S strep F and 16S strep R) (23). S. gordonii and S. sanguinis each have four chromosomal copies of the 16S rRNA gene. DNA from the standard dilutions and samples from S. sanguinis and S. gordonii were amplified by real-time PCR as described previously (23). The quantity of DNA was calculated relative to the cycle threshold values of the DNA dilutions. Real-time PCR was performed using FullVelocity SYBR green quantitative PCR master mix (Stratagene) in accordance with the manufacturer's instructions. The concentration of RNA was determined using a Quant-iT RNA assay kit (Invitrogen; Carlsbad, CA), which is based on RNA-specific binding by a fluorescent dye (5), and read using a Qubit fluorometer (Invitrogen).
ATP determinations.
At the indicated times, culture supernatants (1 ml) were removed and cells were cleared by centrifugation as described above. The ATP concentration was measured with a luciferase-based ATP determination kit (Invitrogen) in accordance with the manufacturer's instructions. Luciferase activity was measured using an Orion microplate luminometer (Berthold Detection Systems, Pforzheim, Germany).
Autolysis assay.
As described previously (35), cells from overnight static cultures in BHI (10 ml) were grown to mid-log phase, harvested by centrifugation, and washed twice with chilled water. After resuspension in autolysis buffer (0.05 M Tris-HCl, pH 7.2, 0.05% [vol/vol] Triton X-100), cells were incubated at 37°C in 5% CO2 as static cultures. Cells were resuspended and absorption (A600) was measured at the indicated times. To test the effect of H2O2 on cell lysis, BHI cultures were harvested from logarithmic phase (A600, ∼0.7), washed with phosphate-buffered saline (PBS) (pH 7.4), and resuspended in PBS to give an A600 of ∼0.3 in PBS supplemented with the indicated concentrations of H2O2. Absorption (A600) was measured using a Bioscreen C analyzer, version 2.4 (Oy Growth Curves AB, Ltd., Finland). Programmed to shake the samples periodically to simulate conditions used to determine eDNA concentrations, this analyzer kinetically measured the turbidity in multiple cultures simultaneously.
Ampicillin treatment.
Overnight cultures were washed twice in BHI, inoculated in fresh BHI, and grown at 37°C in 5% CO2 for approximately one generation on a rocking platform for maximal H2O2 production. The cultures were split, ampicillin was added to give a final concentration of 8 μg/ml, and incubation continued. Samples were removed at the indicated times for DNA, RNA, and ATP quantification as described above.
PCR.
PCR was performed with a Mastercycler thermocycler (Eppendorf, Westbury, NY) in accordance with the manufacturer's protocol. GoTaq-DNA polymerase was obtained from Promega. Primer sequences (Table 1) were designed using sequence data obtained from the Los Alamos National Laboratory Oral Pathogens Sequence Database (http://www.oralgen.lanl.gov/) and synthesized by Integrated DNA Technologies (Coralville, IA). Chromosomal DNA (chDNA) was isolated by following standard procedures, using lysozyme digestion of cells, chloroform-phenol extraction, and isopropanol precipitation, essentially as described previously (28). PCR products were run on a 1% agarose gel and stained with ethidium bromide.
TABLE 1.
Primers used in this study
| Primer | Functiona | Sequence (5′ to 3′) | Source or referenceb |
|---|---|---|---|
| 16S strep F | DNA release quantification | AAGCAACGCGAAGAACCTTA | 23 |
| 16S strep R | DNA release quantification | GTCTCGCTAGAGTGCCCAAC | 23 |
| EUB 338 | Fluorescent FISH probe | GCTGCCTCCCGTAGGAGT | 2 |
| Ss gyrB F | ATGGAATGGAGCAGGTCAAG | ||
| Ss gyrB R | TTCAACCGTAATGTCGTCCA | ||
| Ss ccpA F | TGGCGACAGTCAGTCGAGTA | ||
| Ss ccpA R | AGAACTTCGCGTTCTTCCAA | ||
| Ss clpX F | TGGGAAGAACCAAGATGAGG | ||
| Ss clpX R | AGCATCCTCGTCAAATTCAAG | ||
| Ss ppsA F | ACTTCAGCGGTGTCTGCTTT | ||
| Ss ppsA R | CCGGCTTGTACCAAGGAATA | ||
| Ss LDH F | TTGCTTTGGCTCGTATCACA | ||
| Ss LDH R | TACGATACCGTGAGCACCAA | ||
| Sg ccpA F | TGAAGCAGGGGTTTCTATGG | ||
| Sg ccpA R | TTCCAACTCTTCCTTGTGCAT | ||
| Sg gyrA F | CCAAACCTTTTGGTCAATGG | ||
| Sg gyrA R | CCCAGGCAAAACTTCCATAA | ||
| Sg LDH F | GCTCTTGGCTAGTGGAGGTG | ||
| Sg LDH R | CCGATTTCCAGCCTTCTACA | ||
| Sg ppsA F | CAAGCGACCTTGCTCTCTCT | ||
| Sg ppsA R | CCCTTGGGATTAGCTGTGAA | ||
| Sg clpX F | CCGTGAAGAATTAGCCGAAG | ||
| Sg clpX R | TCCATCATGGTTTCTTCGAT | ||
| Sg sspA 1 | CTAAAAACGATCCTGAACTTGGTAAATAC | ||
| Sg sspA 2 | CCTAAAACTCCTAGTAAAGCCGCAAGAC | ||
| Ss 0243 1 | CTTGCCTAAAATATCAGAAACATAGC | ||
| Ss 0243 2 | CCTGCAAGTCCGGTCATGACAAGTC |
The function is eDNA characterization unless otherwise noted.
The source is this work unless otherwise noted.
Semiquantitative PCR was performed with precipitated eDNA samples by using the same protocol. Briefly, 0.5 μl of eDNA (suspended in 25 μl of deionized nuclease-free H2O) was added to 24.5 μl PCR master mix. PCR was run for 20, 23, and 26 cycles with the 16S rRNA-specific oligonucleotides, and the products were resolved on an agarose gel as described above.
DNase and RNase.
For RNase and DNase treatment of nucleic acids, samples were treated for 1 h at 37°C with either 5 μl of 0.4-mg/ml RNase A (Sigma-Aldrich) or 5 units of RQ1 DNase (Promega) in 25 μl (final volume).
Cell aggregation.
For cell aggregation, cells from overnight cultures were washed twice in BHI and resuspended in 2 ml BHI (5-ml tubes) to give an A600 of 0.05. Cells were incubated at 37°C for 1 h on a rocking platform, A600 was measured, and RQ1 DNase (15 units) (Promega) was added. Cells were then incubated for 1 h at 37°C, and the final A600 was recorded.
Fluorescence microscopy and fluorescent labeling of bacteria.
Cells were grown in BHI on a rocking platform at 37°C to late logarithmic phase (A600, ∼0.6 to 0.7). To differentiate between bacteria with compromised or intact membranes, a Live/Dead BacLight bacterial viability kit was used in accordance with the manufacturer's recommendations (Invitrogen). The dyes were added directly to the growth medium and incubated for 10 min prior to microscopy. The kit contains two different dyes, propidium iodide (PI) conferring red fluorescence and SYTO9 conferring green fluorescence. PI diffuses only into cells with compromised membranes and binds to DNA, whereas intact cells can be stained only with SYTO9 (8).
Cells with high metabolic activity were fluorescently labeled with CellTracker Green CMFDA in accordance with the manufacturer's instructions (Invitrogen). Cells were incubated for 1 h at 37°C in the presence of 5 μM dye (15) and then examined microscopically.
Fluorescence in situ hybridization (FISH) was performed essentially as described earlier (15). The oligonucleotide probe for 16S rRNA (EUB338) was 5′ labeled with Alexa Fluor 488 N-hydroxysuccinimide ester and synthesized by Integrated DNA Technologies (Coralville, IA). To perform FISH, planktonic cells in 40 μl of hybridization solution (0.9 M NaCl, 20 mM Tris-HCl, 20% formamide, 0.01% sodium dodecyl sulfate) containing 100 ng of the oligonucleotide probe were incubated for 4 h at 46°C in a water bath. Cells were washed twice with washing solution (0.18 M NaCl, 20 mM Tris-HCl, 0.01% sodium dodecyl sulfate), and total bacteria in the FISH sample were stained with 1 ng DAPI (4′,6-diamidino-2-phenylindole) (Merck, Darmstadt, Germany) for 10 min. Upon binding to DNA, the DAPI fluoresced intensely and cells were observed by microscopy.
Bacterial cell walls were stained by incubating cells for 1 h with 1 μg per ml Alexa Fluor 555-labeled wheat germ agglutinin (WGA; Invitrogen) and washed twice with PBS. For microscopy, 8 μl of cell suspension was applied to a microscope slide, covered with a coverslip, and sealed with clear nail polish to avoid evaporation. Microscopy was performed with a Nikon Eclipse E800 microscope and a 60×/1.40-numerical-aperture or 100×/1.40-numerical-aperture Plan Apo oil lens. Pictures were processed with MetaMorph software (Molecular Devices, Sunnyvale, CA). Contrast and brightness for the entire image were adjusted nonselectively.
Statistical analysis.
Descriptive statistics, including the mean and standard deviation (SD), were calculated. Statistical analysis of data was performed with QuickCalcs online calculators (http://www.graphpad.com/quickcalcs/index.cfm) using t test software to compare the means of results from two groups. Data were considered significantly different if the two-tailed P value was ≤0.05.
RESULTS
Characterization of eDNA release kinetics of S. sanguinis and S. gordonii.
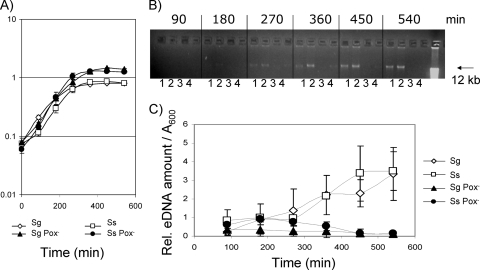
S. sanguinis and S. gordonii wild-type strains and Pox− mutants showed similar generation times in BHI medium, but the Pox− mutants yielded higher cell densities in stationary phase (Fig. 1A). To determine the kinetics of release, the relative amount of eDNA in the medium was analyzed using agarose gel electrophoresis (Fig. 1B) and quantified with real-time PCR (Fig. 1C). By 270 min of incubation, the wild-type strains of both species released DNA resolving as a high-molecular-weight band (Fig. 1B, lanes 1 and 2), which appeared to increase in intensity by 540 min. At all times, the Pox− mutants appeared to release less high-molecular-weight DNA (Fig. 1B, lanes 3 and 4). The kinetics of eDNA presence in the medium was confirmed by quantitative PCR (Fig. 1C). By 540 min (stationary phase), the wild-type strains released about 10-fold more DNA than the Pox− mutants (Fig. 1C). When normalized for cell density, the wild-type strains showed increased release of eDNA and the Pox− mutants showed decreased release of eDNA over time (Fig. 1C). These results suggest that S. sanguinis and S. gordonii release DNA in a Pox-dependent manner during growth.
FIG. 1.
Growth curves and eDNA release kinetics for S. sanguinis (Ss) and S. gordonii (Sg) wild-type strains and Pox− mutants. (A) Growth curves in BHI medium. (B) Agarose gel electrophoresis (1%) of high-molecular-weight DNA stained with ethidium bromide (1 μg/ml) as described in Materials and Methods. The photograph is representative of three independent experiments with similar results. Lanes: 1, S. gordonii; 2, S. sanguinis; 3, S. gordonii Pox−; 4, S. sanguinis Pox−. (C) Quantitative real-time PCR of eDNA, using the 16S rRNA genes as an amplification template. The relative quantities of eDNA in the streptococcal supernatants were calculated in comparison to the cycle threshold values of a dilution series of isolated chDNA. The values were adjusted to the A600 levels of the bacterial cultures. Data presented are the means ± SD of results from two independent experiments done in duplicate on different days.
Total amount of DNA versus eDNA.
To determine the ratio of eDNA to the total amount of cellular DNA, cells were grown to late logarithmic growth phase and the concentrations of DNA in the supernatant and whole-cell lysates were measured. Total DNA from S. sanguinis was 5,121 ± 813 ng/ml and eDNA 953 ± 49 ng/ml (mean ± SD for duplicate samples from two independent experiments). For S. gordonii, total DNA was 7,319 ± 804 ng/ml and eDNA 1,012 ± 100 ng/ml, suggesting that eDNA represents about 15 to 20% of the total cellular DNA.
H2O2 dependence of eDNA release.
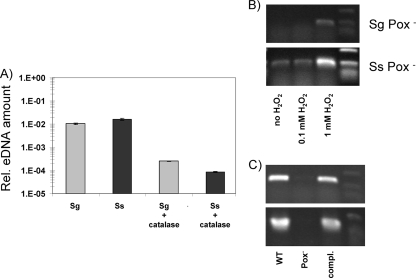
To determine whether eDNA release is stimulated by H2O2, we added H2O2-degrading catalase to wild-type cultures of S. sanguinis and S. gordonii grown under H2O2-producing conditions as described previously (23). Catalase reduced eDNA detected in overnight cultures more than 10-fold (Fig. 2A), to levels similar to those in anaerobic mixed cultures of these bacterial strains (no H2O2 production) (23). Addition of H2O2 (final concentration = 1 mM) to mid-logarithmic phase (A600, ∼0.4) Pox− mutants increased eDNA (Fig. 2B). Complementing Pox− mutants rescued eDNA release to wild-type strain levels (Fig. 2C). H2O2 appeared to be directly involved in DNA release (eDNA) under aerobic conditions.
FIG. 2.
Influence of catalase and H2O2 addition on eDNA amounts of S. sanguinis (Ss) and S. gordonii (Sg) cultures. (A) The relative eDNA amounts in culture supernatants were measured with real-time PCR and standardized to 16S rRNA of isolated chDNA by using different dilutions. Data presented are the means ± SD of results from two independent experiments done on different days. (B) Effect of H2O2 addition on eDNA release of the Pox− mutants. Semiquantitative PCR was performed on precipitated eDNA. (C) Complementation of the Pox− mutants reinstalled eDNA release. Semiquantitative PCR was performed on precipitated eDNA. Pictures are representatives of at least two experiments. WT, wild type.
Characterization of eDNA.
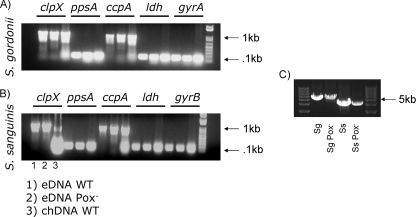
The genomic structures of eDNA and chDNA were compared. In each DNA sample, selected genes were amplified from different loci on the chromosome. The chDNA genes ppsA, clpX, ccpA, ldh, and gyrA (gyrB for S. sanguinis) could be amplified from eDNA from all wild-type strains and Pox− mutants (Fig. 3A and B). The primers for clpX and ccpA encompassed a region of 1 kb, whereas the other primers amplified targets of about 0.12 kb, indicating that the wild-type and mutant eDNAs were similar to each other and chDNA. We were also able to amplify larger segments (over 4 kb) from both species (Fig. 3C), suggesting that the genomic sequence is intact over large sections of eDNA.
FIG. 3.
Characterization of eDNA. eDNA was isopropanol precipitated from wild-type (WT) and Pox− mutant cell supernatants and compared to purified chDNA. PCR amplification was performed over 32 cycles by using primers targeting genes located on different positions on the chromosome. PCR products were resolved on 1% agarose gels. (A) S. gordonii with primers for clpX, ppsA, ccpA, ldh, and gyrA. (B) S. sanguinis with primers for clpX, ppsA, ccpA, ldh, and gyrB. Lanes: 1, eDNA wild type; 2, eDNA Pox− mutant; 3, chDNA wild type. (C) PCR amplification of products greater than 4 kb. Sg, S. gordonii; Ss, S. sanguinis.
Detection of eRNA.
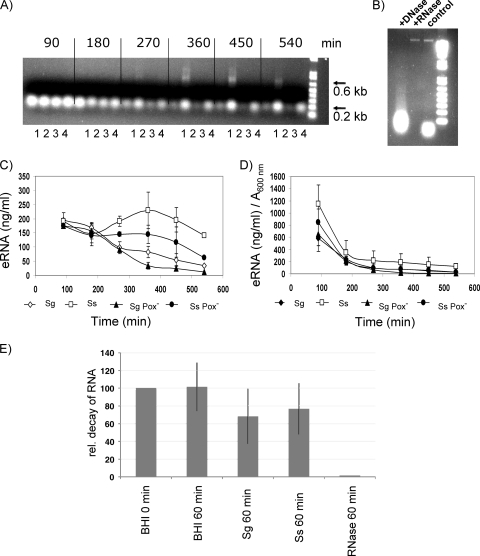
eDNA levels began to increase over baseline at about 270 min of growth and continued to increase during log phase until plateauing at 540 min. To determine if leaky cells released eDNA, the kinetics were compared to those of eRNA. During electrophoresis of eDNA, bands that appeared to correspond to 16S rRNA, 23S rRNA, and low-molecular-weight nucleic acids usually seen during RNA isolation from S. sanguinis and S. gordonii were detected (Fig. 4A). To verify that RNA is present in the media, precipitated nucleic acids from S. gordonii were treated with RNase or DNase and analyzed using agarose gel electrophoresis (Fig. 4B). The low-molecular-weight band disappeared upon treatment with RNase but not DNase (Fig. 4B, lane 2). In contrast, DNase digested the high-molecular-weight band (Fig. 4B, lane 1).
FIG. 4.
Characterization of eRNA. (A) Agarose gel electrophoresis (1%) of RNA stained with ethidium bromide (1 μg/ml) as described in Materials and Methods. The photograph is representative of three independent experiments with similar results. Lanes: 1, S. gordonii; 2, S. sanguinis; 3, S. gordonii Pox−; 4, S. sanguinis Pox−. (B) Precipitated nucleic acids from S. gordonii were digested with DNase RQ1 and RNase A, resolved by agarose gel electrophoresis (1%), and stained with ethidium bromide (1 μg/ml). (C) Quantification of eRNA by use of an RNA-specific fluorescent dye with the Quant-iT RNA assay. Sg, S. gordonii; Ss, S. sanguinis. (D) Relative amounts of RNA normalized to cell density measured at A600. Data presented are the means ± SD of results from three independent experiments done on different days. (E) eRNA degradation. Total RNA from S. mutans (2 μg/ml) was added to the cultures. After 60 min of incubation, a 1-ml aliquot was removed. RNA was precipitated and analyzed for decay on an agarose gel by comparing pixel intensities of RNA bands with ImageJ software (http://rsb.info.nih.gov/ij/). Shown are means ± SD of results from at least two independent experiments with BHI, with the 0-min arbitrary level set to 100%.
A maximum of 230 ng per ml eRNA was recovered from S. sanguinis wild-type supernatant, higher than the level for S. gordonii or either Pox− mutant (Fig. 4C). When normalized to cell density, however, the highest concentration of eRNA was recovered during initial logarithmic growth and then declined for all four strains (Fig. 4D), which contrasted with the release kinetics of eDNA (Fig. 1C). To determine whether RNA is degraded after release, total RNA from Streptococcus mutans was isolated and then added to S. sanguinis and S. gordonii logarithmic-phase cells. At 60 min, the relative amount of S. mutans RNA recovered after incubation with S. sanguinis and S. gordonii was reduced by 30 to 40% more than when recovered from sterile BHI medium (Fig. 4E). Nuclease activity might account for decreasing RNA levels in log phase.
Release of ATP.
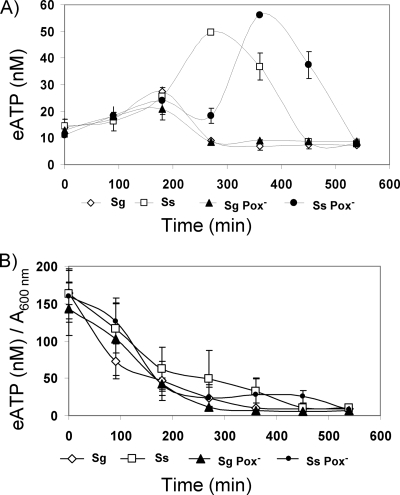
To learn whether eDNA is associated with release of other cellular content, we measured the concentrations of ATP in the supernatants of S. sanguinis and S. gordonii wild-type strains and Pox− mutants grown under H2O2-producing conditions. ATP has been used as indicator of nisin-induced cell lysis (45). The S. gordonii wild type and the Pox− mutant yielded similar amounts of extracellular ATP (eATP), maximizing at 180 min (Fig. 5A). For S. sanguinis, the kinetics of eATP appearance differed (Fig. 5A). After 180 min, the S. sanguinis wild type and the Pox− mutant released increasing amounts of ATP to reach maximal concentrations about twice that of S. gordonii. Compared to the wild type, the S. sanguinis Pox− mutant yielded a maximum eATP concentration about 60 min later. When normalized to cell densities, all four strains showed similar continuous decreases in eATP concentration over time (Fig. 5B), suggesting that lysis-induced release of ATP did not occur. When added to mid-logarithmic-phase cells, ATP appeared to be relatively stable, and eATP remained undegraded after release from cells (data not shown).
FIG. 5.
ATP release from S. sanguinis (Ss) and S. gordonii (Sg) wild-type strains and Pox− mutants. (A) Quantification of ATP by use of a luciferase assay as described in Materials and Methods. The concentration relative to an ATP dilution standard curve was determined. (B) Relative ATP amount normalized to cell density measured at 600 nm. Data presented are the means ± SD of results from three independent experiments.
Cell viability and integrity.
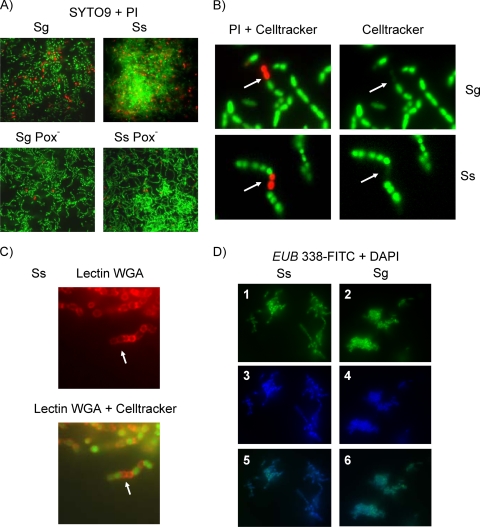
To learn whether the level of eDNA was associated with membrane compromised cells, late-logarithmic-growth-phase cells grown under H2O2-producing conditions (300 min) (A600 for wild-type strains, ∼0.9; A600 for Pox mutants, ∼1.2) were stained with PI and SYTO9 to ascertain cell viability. PI would be excluded from cells with intact membranes. S. sanguinis and S. gordonii wild-type strains showed higher proportions of nonviable red fluorescent cells than the Pox− mutants (Fig. 6A). On the basis of enumeration of PI-stained red cells, about 10% of the wild-type cell population was membrane compromised (S. gordonii, 9.6% ± 0.29%; S. sanguinis, 10.9% ± 0.08%). The Pox− mutant population, however, contained less than 1% compromised cells (S. gordonii, 0.7% ± 0.52%; S. sanguinis, 0.95% ± 0.43%). These data appeared to be consistent with the approximately 10-fold difference in eDNA release between wild-type and Pox− mutant cells in late logarithmic to early stationary phase (Fig. 1C).
FIG. 6.
Cell integrity of S. sanguinis (Ss) and S. gordonii (Sg). Fluorescence microscopy was performed with a Nikon Eclipse E800 microscope at ×60 or ×100 magnification. Pictures were processed with MetaMorph software (Molecular Devices, Sunnyvale, CA). (A) Fluorescence micrograph of live (green; SYTO9 staining) and membrane-compromised (red; PI staining) cells grown as planktonic cultures. (B) Fluorescence micrograph of metabolically active (green; CellTracker Green) and membrane-compromised (red; PI) cells. (C) Fluorescence micrograph localizing the N-acetylglucosamine of the peptidylglycan of the streptococcal cell wall (red; WGA lectin staining) and metabolic activity (green; CellTracker Green). (D) Fluorescence micrograph showing ribosomal (green; EUB338-specific FISH probe; images 1 and 2) and DNA (blue; DAPI staining; images 3 and 4) contents of wild-type strains grown as planktonic cells and an overlay of the green and blue channels (images 5 and 6).
To determine the metabolic activity of the PI-stained red fluorescent cells, cells were counterstained using CellTracker Green dye (Fig. 6B). Cells staining with PI showed only faint green fluorescence in comparison to the surrounding cells, indicating weak, residual metabolic activity (Fig. 6B). To determine whether cell wall lysis had occurred, we probed wall integrity by using WGA, which selectively binds to N-acetylglucosamine (GlcNAc) of the peptidoglycan. Nonviable and viable S. sanguinis (Fig. 6C) and S. gordonii (data not shown) cells showed similar levels of cell wall integrity.
If H2O2 adversely affected cell envelope integrity, we would expect ribosomes to be lost. Wild-type cells were grown under H2O2-producing conditions, and ribosome content was assessed using FISH with the oligonucleotide probe EUB338 (2) for eubacterial 16S rRNA (15). All cells hybridizing with the 16S rRNA probe (bright green fluorescence) also counterstained with the DNA fluorescent dye DAPI (blue fluorescence), indicating no obvious loss of ribosome content (Fig. 6D).
Autolysis of S. sanguinis and S. gordonii.
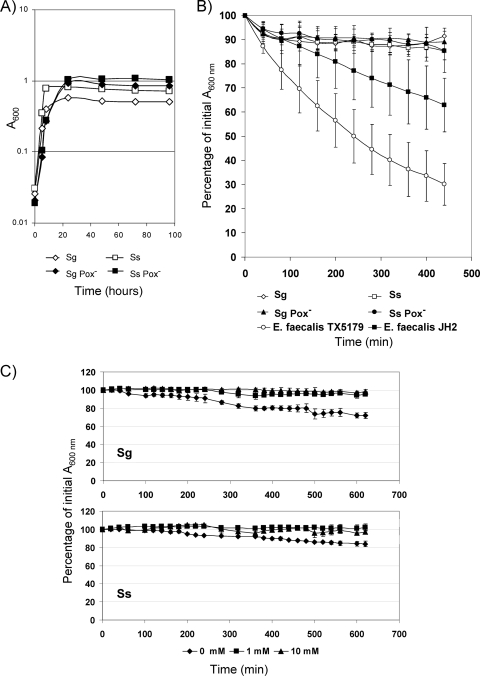
Although the data suggested that cells maintain wall integrity and ribosomes in the presence of H2O2, eDNA could be released from an otherwise undetectable portion of autolysing cells. To learn whether cells undergo autolysis during prolonged incubation in BHI, absorption was measured over several days as an indicator of cell density. Over time, there was no obvious loss in absorption (Fig. 7A). Since E. faecalis was recently described as autolytic during eDNA generation (44), we monitored S. sanguinis and S. gordonii under autolytic conditions for other firmicutes and for comparison to E. faecalis strains TX5179 (49) and JH2 (18). Initially, A600 decreased 10% in all strains, consistent with cell shrinkage after transfer into autolysis buffer (Fig. 7B). After 80 min, the A600s of S. sanguinis and S. gordonii remained constant through overnight incubation (data not shown). In contrast, the two strains of E. faecalis showed cell lysis at different rates (Fig. 7B). Since H2O2 triggers DNA release, we determined whether H2O2-induced release of DNA is the result of cell lysis. S. sanguinis and S. gordonii were incubated in the presence of 1 mM and 10 mM H2O2. No autolysis was detected (Fig. 7C). These data suggest that both streptococcal species do not lyse substantially under conditions known to cause lysis of other firmicutes.
FIG. 7.
Autolysis of S. sanguinis (Ss) and S. gordonii (Sg) wild-type strains and Pox− mutants. (A) Cell density of cultures during prolonged incubation in BHI. (B) Cells were resuspended in specific autolysis buffer. Autolysis was estimated as the decrease in absorption (A600) was recorded over time. Autolysis-positive E. faecalis strains were used as positive controls. Data presented are the means ± SD of results from three (streptococci) and two (enterococci) independent experiments done on different days. (C) Autolysis assay in the presence of 1 mM and 10 mM H2O2.
Antibiotic-induced release of DNA, RNA and ATP.
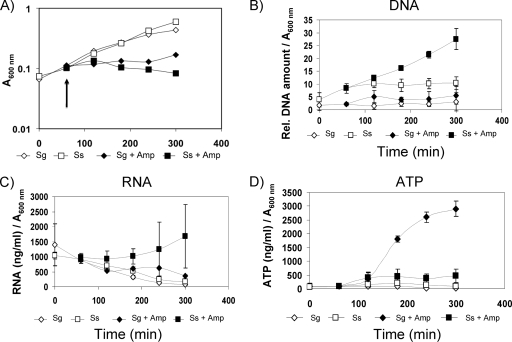
Ampicillin can inhibit bacterial cell wall synthesis and induce cell leakage and lysis in streptococci (17). S. sanguinis and S. gordonii wild-type cells were grown under H2O2-producing conditions with ampicillin and monitored for release of DNA, RNA, and ATP. Ampicillin caused immediate growth arrest of the cells (Fig. 8A). When normalized to cell density, eDNA was found to be threefold greater in ampicillin-treated than in untreated S. sanguinis cells at 300 min (P ≤ 0.003) (Fig. 8B). S. gordonii eDNA was consistently greater in response to ampicillin, but the difference was not significant. With ampicillin, S. sanguinis eRNA increased about threefold (P ≤ 0.003) (Fig. 8C) and S. gordonii eATP was about fivefold higher (P ≤ 0.0001) (Fig. 8D). S. sanguinis did not release significantly more ATP when treated with ampicillin. The releases of DNA, RNA, and ATP were increased compared to the levels for untreated cells, but the increase was not always significant. In response to ampicillin, S. sanguinis and S. gordonii cell walls lost staining with WGA lectin at 300 min (data not shown). Hence, DNA, RNA, and ATP are released when lysis is induced by ampicillin, and all accumulate in the medium.
FIG. 8.
Ampicillin-induced lysis of S. sanguinis (Ss) and S. gordonii (Sg). (A) Representative growth curve demonstrating the effect of ampicillin addition (arrow depicts time of addition). (B to D) Release of DNA, (B) RNA (C), and ATP (D) into the medium after induced lysis with ampicillin (8 μg/ml) was measured over time. The amounts of DNA, RNA, and ATP were determined as described for the other experiments and normalized to the cell density at A600. Data presented are the means ± SD of results from three independent experiments done on different days.
eDNA promotes S. sanguinis aggregation.
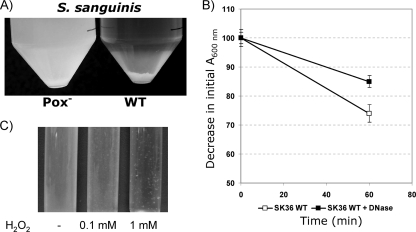
When grown under aerobic, H2O2-producing conditions, the S. sanguinis wild type forms visible aggregates, which precipitate to the bottom of the tube over time (Fig. 9A). Under the same conditions, the Pox− mutant did not aggregate or precipitate (Fig. 9A). To determine whether aggregation is mediated by eDNA, DNase was added to cultures growing under aerobic, H2O2-producing conditions. The DNase-treated cells showed reduced aggregation (Fig. 9B). S. sanguinis aggregation was also induced by H2O2 in a dose-dependent manner (Fig. 9C). Under the same conditions, S. gordonii did not form aggregates.
FIG. 9.
Effect of aerobic growth and DNase treatment on the aggregation of the S. sanguinis wild type and the Pox− mutant. (A) Overnight cultures of the wild type and the Pox− mutant obtained after further static incubation has resulted in aggregation of the wild type but not the Pox− mutant strain. (B) Aggregation inhibition by DNase treatment of wild-type cells during anaerobic growth. Data presented are the means ± SD of results from two independent experiments done on different days. (C) H2O2-induced aggregation of the S. sanguinis Pox− mutant.
DISCUSSION
This is the first report showing that eDNA is produced in response to the streptococcal virulence factor H2O2. The H2O2-dependent release of DNA without autolysis may reflect a special adaptation to the biofilm environment of S. sanguinis and S. gordonii, where autolysis could create open spaces where competitors would invade. During early oral biofilm formation, the concentration of oxygen is sufficient for S. sanguinis and S. gordonii to produce H2O2 (29). The production of H2O2 would help both species to compete efficiently with other hydrogen peroxide-sensitive early colonizers. Since eDNA promotes cell-to-cell adhesion, release of DNA appears to support oral biofilm formation and may facilitate exchange of genetic material among competent strains. In addition, the release of DNA might promote S. sanguinis and S. gordonii adhesion to the tooth surface. For S. sanguinis, eDNA appeared to contribute to intercellular adhesion since DNase treatment reduces cell aggregation in aerobic cultures. eDNA contributes to intercellular interactions in other species since DNase treatment also prevents clumping of P. aeruginosa cells (1) and cell-to-cell adhesion of P. aeruginosa and Rheinheimera baltica (1, 6).
As reported previously for other species (12, 13, 24, 41), S. sanguinis and S. gordonii eDNA is characterized as chDNA. With the use of PCR to show the integrity of the eDNA, streptococcal chromosomal regions up to 5 kb could be amplified. Moreover, eDNA and high-molecular-weight DNA (>12 kb) showed similar mobilities on agarose gels, and no obvious degradation was seen. Hence, streptococcal eDNA is strongly suggested to be largely intact chDNA.
For most species investigated, eDNA appears upon autolysis of a subpopulation of cells, which requires the activity of murein hydrolases (30, 36, 37, 42). Both S. gordonii and S. sanguinis encode putative N-acetylmuramidases (46), required for cell growth during cycles of controlled lysis, remodeling, and synthesis of new peptidoglycan building blocks (46). To what extent these murein hydrolases contribute to the release of DNA in oral streptococci is currently under investigation. Interestingly, earlier reports failed to detect peptidoglycan hydrolase activity in S. sanguinis (16, 17).
H2O2 addition did not result in measurable autolysis, although H2O2 can trigger the release of eDNA. Hence, there exists an eDNA-releasing mechanism for S. gordonii and S. sanguinis that does not appear to involve the generalized autolysis reported for other species, like S. pneumoniae (38). Consistent with this conclusion, DNA release appeared independent of release of other intracellular components, like ATP. ATP has been used to monitor nisin-induced lysis of lactobacilli (45). Interestingly, RNA was detected in the supernatant of S. gordonii and S. sanguinis during initial growth, but the concentration then declined over time. The decline might be caused by eRNA nuclease activity, since growing cells degraded added RNA. It is likely that S. sanguinis and S. gordonii release RNA only during initial growth. The release kinetics of RNA, thus, differed from those of eDNA. DNA, RNA, and ATP, however, did leak out of cells treated with ampicillin, which is known to cause cell wall damage (17). Hence, S. sanguinis and S. gordonii wild-type strains are strongly suggested to selectively release DNA in an H2O2-dependent manner.
Hydrogen peroxide production by S. sanguinis and S. gordonii promotes release of eDNA under aerobic conditions, as we have reported (23). Consistent with these findings, Pox-mediated production of H2O2 occurs only in aerobically grown cells (9, 10). As we now show, isogenic Pox− mutants produce significantly less eDNA during growth. Since catalase reduces eDNA from wild-type cells to Pox− mutant levels and H2O2 addition to Pox− mutants triggers eDNA release, H2O2 is the principal active agent. In the presence of catalase, wild-type cells showed significantly reduced but detectable eDNA, suggesting that S. gordonii and S. sanguinis may possess other H2O2- and Pox-independent eDNA release mechanisms.
S. sanguinis and S. gordonii are pioneer colonizers of oral biofilms (20), and about 80% of early colonizers are oral streptococci (31, 39). The oral streptococci share similar metabolic requirements, which in the nutritionally challenging oral environment promote fierce competition for space and nutrients. To compete with other species, S. sanguinis and S. gordonii produce hydrogen peroxide to antagonize peroxide-sensitive species, as we have reported (22). While S. sanguinis and S. gordonii produce H2O2, other oral streptococcal species are the sensitive targets. Although S. sanguinis and S. gordonii appear to resist autolysis in the presence of H2O2, we speculate that H2O2-compromised cell membranes cause the apparently specific release of DNA. We are currently investigating whether compromised membranes trigger partial autolysis and limited or incomplete digestion of cell wall peptidoglycan. Membrane-compromised cells show less metabolic activity (Fig. 6B), but the cell wall remains intact (Fig. 6C). The intact cell walls enable cells to retain intracellular components, including ribosomes (Fig. 6D). H2O2-producing S. sanguinis and S. gordonii strains grow to lower cell densities than their respective isogenic Pox− mutants. Wild-type cultures contain about 10-fold more membrane-compromised cells (Fig. 6A) than Pox− mutants and release correspondingly more eDNA. The eDNA represents about 15 to 20% of the total chDNA. While the extraction technique can underrepresent total DNA (7, 27, 51), we compared three different techniques (enzymatic digestion, boiling, and mechanical disruption) and reported only mechanical disruption as yielding the largest amount of DNA. Nonetheless, our results suggest that the membrane-compromised cells are likely responsible for the release of DNA without generalized lysis. While H2O2 compromises membrane integrity in a small fraction of streptococcal cells, leading to eDNA release, cells must be programmed to determine which cells actually functionalize (or resist) DNA release.
A developmental program for bacterial cell death and DNA release has been shown for several species, including streptococci (recently reviewed in reference 36). Under our experimental conditions, H2O2 should be uniformly distributed, preventing localized concentrations from reaching toxic levels. Individual cells in growing planktonic cultures, however, could be in different metabolic states, as proposed for biofilm cells (43). Less active cells could be more susceptible to H2O2 and trigger DNA release. In S. mutans, low concentrations of H2O2 inhibit glycolysis (3). In less metabolically active cells, H2O2 could further decrease metabolic activity and trigger eDNA release. Interestingly, the operon controlling cell lysis in S. aureus, cidABC, encodes a pyruvate oxidase, CidC (33). When excess glucose is available, stationary-phase S. aureus CidC− mutants show higher levels of cell viability than wild-type cells, indicating metabolic control of cell death. Whether the metabolic status of the cell determines the release of DNA in S. sanguinis and S. gordonii is currently under investigation.
The eDNA mediates the biofilm phenotype of diverse species and contributes to dispersal and colonization of the marine bacterium Pseudoalteromonas tunicata (25, 26). In oral streptococci, release of eDNA without obvious lysis of cells could provide an evolutionary advantage enabling gene selection during transformation, as suggested by mathematical modeling (14). For the pioneer oral streptococci, such as S. sanguinis and S. gordonii, H2O2-producing cells play a crucial role in preventing growth of competing bacteria in a highly competitive biofilm community (21, 23). Metabolically inactive cells are unable to contribute H2O2 and may not be competitors serving on behalf of the population. If these metabolically inactive cells are more susceptible to H2O2 and produce eDNA, however, these cells support the genetic fitness of the population. Cells adhere better in the presence of eDNA, as we show for S. sanguinis. Intraspecies aggregation could prevent spatial intrusion of competing bacteria. For aggregated oral streptococci, the overall negative charge of eDNA might also promote colonization of the positively charged enamel surface (47) and early dental plaque formation.
Acknowledgments
The support from NIH/NIDCR grants R01DE08590 and R01DE11831 to M.C.H. and 4R00DE018400 to J.K. is gratefully acknowledged.
Footnotes
Published ahead of print on 14 August 2009.
REFERENCES
- 1.Allesen-Holm, M., K. B. Barken, L. Yang, M. Klausen, J. S. Webb, S. Kjelleberg, S. Molin, M. Givskov, and T. Tolker-Nielsen. 2006. A characterization of DNA release in Pseudomonas aeruginosa cultures and biofilms. Mol. Microbiol. 59:1114-1128. [DOI] [PubMed] [Google Scholar]
- 2.Amann, R. I., B. J. Binder, R. J. Olson, S. W. Chisholm, R. Devereux, and D. A. Stahl. 1990. Combination of 16S rRNA-targeted oligonucleotide probes with flow cytometry for analyzing mixed microbial populations. Appl. Environ. Microbiol. 56:1919-1925. [DOI] [PMC free article] [PubMed] [Google Scholar]
- 3.Baldeck, J. D., and R. E. Marquis. 2008. Targets for hydrogen-peroxide-induced damage to suspension and biofilm cells of Streptococcus mutans. Can. J. Microbiol. 54:868-875. [DOI] [PubMed] [Google Scholar]
- 4.Bayles, K. W. 2007. The biological role of death and lysis in biofilm development. Nat. Rev. Microbiol. 5:721-726. [DOI] [PubMed] [Google Scholar]
- 5.Berthet, N., A. K. Reinhardt, I. Leclercq, S. van Ooyen, C. Batejat, P. Dickinson, R. Stamboliyska, I. G. Old, K. A. Kong, L. Dacheux, H. Bourhy, G. C. Kennedy, C. Korfhage, S. T. Cole, and J. C. Manuguerra. 2008. Phi29 polymerase based random amplification of viral RNA as an alternative to random RT-PCR. BMC Mol. Biol. 9:77. [DOI] [PMC free article] [PubMed] [Google Scholar]
- 6.Bockelmann, U., A. Janke, R. Kuhn, T. R. Neu, J. Wecke, J. R. Lawrence, and U. Szewzyk. 2006. Bacterial extracellular DNA forming a defined network-like structure. FEMS Microbiol. Lett. 262:31-38. [DOI] [PubMed] [Google Scholar]
- 7.Bollet, C., M. J. Gevaudan, X. de Lamballerie, C. Zandotti, and P. de Micco. 1991. A simple method for the isolation of chromosomal DNA from gram positive or acid-fast bacteria. Nucleic Acids Res. 19:1955. [DOI] [PMC free article] [PubMed] [Google Scholar]
- 8.Boulos, L., M. Prevost, B. Barbeau, J. Coallier, and R. Desjardins. 1999. LIVE/DEAD BacLight: application of a new rapid staining method for direct enumeration of viable and total bacteria in drinking water. J. Microbiol. Methods 37:77-86. [DOI] [PubMed] [Google Scholar]
- 9.Carlsson, J., and M. B. Edlund. 1987. Pyruvate oxidase in Streptococcus sanguis under various growth conditions. Oral Microbiol. Immunol. 2:10-14. [DOI] [PubMed] [Google Scholar]
- 10.Carlsson, J., M. B. Edlund, and S. K. Lundmark. 1987. Characteristics of a hydrogen peroxide-forming pyruvate oxidase from Streptococcus sanguis. Oral Microbiol. Immunol. 2:15-20. [DOI] [PubMed] [Google Scholar]
- 11.Catlin, B. W. 1960. Transformation of Neisseria meningitidis by deoxyribonucleates from cells and from culture slime. J. Bacteriol. 79:579-590. [DOI] [PMC free article] [PubMed] [Google Scholar]
- 12.Crabb, W. D., U. N. Streips, and R. J. Doyle. 1977. Selective enrichment for genetic markers in DNA released by competent cultures of Bacillus subtilis. Mol. Gen. Genet. 155:179-183. [DOI] [PubMed] [Google Scholar]
- 13.Dillard, J. P., and H. S. Seifert. 2001. A variable genetic island specific for Neisseria gonorrhoeae is involved in providing DNA for natural transformation and is found more often in disseminated infection isolates. Mol. Microbiol. 41:263-277. [DOI] [PubMed] [Google Scholar]
- 14.Draghi, J. A., and P. E. Turner. 2006. DNA secretion and gene-level selection in bacteria. Microbiology 152:2683-2688. [DOI] [PubMed] [Google Scholar]
- 15.Freese, H. M., U. Karsten, and R. Schumann. 2006. Bacterial abundance, activity, and viability in the eutrophic River Warnow, northeast Germany. Microb. Ecol. 51:117-127. [DOI] [PubMed] [Google Scholar]
- 16.Horne, D., and A. Tomasz. 1985. Competence-specific autolysis in Streptococcus sanguis. J. Gen. Microbiol. 131:533-541. [DOI] [PubMed] [Google Scholar]
- 17.Horne, D., and A. Tomasz. 1977. Tolerant response of Streptococcus sanguis to beta-lactams and other cell wall inhibitors. Antimicrob. Agents Chemother. 11:888-896. [DOI] [PMC free article] [PubMed] [Google Scholar]
- 18.Jacob, A. E., and S. J. Hobbs. 1974. Conjugal transfer of plasmid-borne multiple antibiotic resistance in Streptococcus faecalis var. zymogenes. J. Bacteriol. 117:360-372. [DOI] [PMC free article] [PubMed] [Google Scholar]
- 19.Johnsborg, O., V. Eldholm, M. L. Bjornstad, and L. S. Havarstein. 2008. A predatory mechanism dramatically increases the efficiency of lateral gene transfer in Streptococcus pneumoniae and related commensal species. Mol. Microbiol. 69:245-253. [DOI] [PubMed] [Google Scholar]
- 20.Kolenbrander, P. E. 2000. Oral microbial communities: biofilms, interactions, and genetic systems. Annu. Rev. Microbiol. 54:413-437. [DOI] [PubMed] [Google Scholar]
- 21.Kreth, J., J. Merritt, W. Shi, and F. Qi. 2005. Co-ordinated bacteriocin production and competence development: a possible mechanism for taking up DNA from neighbouring species. Mol. Microbiol. 57:392-404. [DOI] [PMC free article] [PubMed] [Google Scholar]
- 22.Kreth, J., J. Merritt, W. Shi, and F. Qi. 2005. Competition and coexistence between Streptococcus mutans and Streptococcus sanguinis in the dental biofilm. J. Bacteriol. 187:7193-7203. [DOI] [PMC free article] [PubMed] [Google Scholar]
- 23.Kreth, J., Y. Zhang, and M. C. Herzberg. 2008. Streptococcal antagonism in oral biofilms: Streptococcus sanguinis and Streptococcus gordonii interference with Streptococcus mutans. J. Bacteriol. 190:4632-4640. [DOI] [PMC free article] [PubMed] [Google Scholar]
- 24.Lorenz, M. G., D. Gerjets, and W. Wackernagel. 1991. Release of transforming plasmid and chromosomal DNA from two cultured soil bacteria. Arch. Microbiol. 156:319-326. [DOI] [PubMed] [Google Scholar]
- 25.Mai-Prochnow, A., F. Evans, D. Dalisay-Saludes, S. Stelzer, S. Egan, S. James, J. S. Webb, and S. Kjelleberg. 2004. Biofilm development and cell death in the marine bacterium Pseudoalteromonas tunicata. Appl. Environ. Microbiol. 70:3232-3238. [DOI] [PMC free article] [PubMed] [Google Scholar]
- 26.Mai-Prochnow, A., J. S. Webb, B. C. Ferrari, and S. Kjelleberg. 2006. Ecological advantages of autolysis during the development and dispersal of Pseudoalteromonas tunicata biofilms. Appl. Environ. Microbiol. 72:5414-5420. [DOI] [PMC free article] [PubMed] [Google Scholar]
- 27.Mak, Y. M., and K. K. Ho. 1992. An improved method for the isolation of chromosomal DNA from various bacteria and cyanobacteria. Nucleic Acids Res. 20:4101-4102. [DOI] [PMC free article] [PubMed] [Google Scholar]
- 28.Maloy, R. M. 1989. Experimental techniques in bacterial genetics. Jones and Bartlett Publishers, Boston, MA.
- 29.Marquis, R. E. 1995. Oxygen metabolism, oxidative stress and acid-base physiology of dental plaque biofilms. J. Ind. Microbiol. 15:198-207. [DOI] [PubMed] [Google Scholar]
- 30.Moscoso, M., and J. P. Claverys. 2004. Release of DNA into the medium by competent Streptococcus pneumoniae: kinetics, mechanism and stability of the liberated DNA. Mol. Microbiol. 54:783-794. [DOI] [PubMed] [Google Scholar]
- 31.Nyvad, B., and M. Kilian. 1987. Microbiology of the early colonization of human enamel and root surfaces in vivo. Scand. J. Dent. Res. 95:369-380. [DOI] [PubMed] [Google Scholar]
- 32.Pakula, R., and W. Walczak. 1963. On the nature of competence of transformable streptococci. J. Gen. Microbiol. 31:125-133. [DOI] [PubMed] [Google Scholar]
- 33.Patton, T. G., K. C. Rice, M. K. Foster, and K. W. Bayles. 2005. The Staphylococcus aureus cidC gene encodes a pyruvate oxidase that affects acetate metabolism and cell death in stationary phase. Mol. Microbiol. 56:1664-1674. [DOI] [PubMed] [Google Scholar]
- 34.Petersen, F. C., L. Tao, and A. A. Scheie. 2005. DNA binding-uptake system: a link between cell-to-cell communication and biofilm formation. J. Bacteriol. 187:4392-4400. [DOI] [PMC free article] [PubMed] [Google Scholar]
- 35.Qin, Z., Y. Ou, L. Yang, Y. Zhu, T. Tolker-Nielsen, S. Molin, and D. Qu. 2007. Role of autolysin-mediated DNA release in biofilm formation of Staphylococcus epidermidis. Microbiology 153:2083-2092. [DOI] [PubMed] [Google Scholar]
- 36.Rice, K. C., and K. W. Bayles. 2008. Molecular control of bacterial death and lysis. Microbiol. Mol. Biol. Rev. 72:85-109. [DOI] [PMC free article] [PubMed] [Google Scholar]
- 37.Rice, K. C., E. E. Mann, J. L. Endres, E. C. Weiss, J. E. Cassat, M. S. Smeltzer, and K. W. Bayles. 2007. The cidA murein hydrolase regulator contributes to DNA release and biofilm development in Staphylococcus aureus. Proc. Natl. Acad. Sci. USA 104:8113-8118. [DOI] [PMC free article] [PubMed] [Google Scholar]
- 38.Ronda, C., J. L. Garcia, E. Garcia, J. M. Sanchez-Puelles, and R. Lopez. 1987. Biological role of the pneumococcal amidase. Cloning of the lytA gene in Streptococcus pneumoniae. Eur. J. Biochem. 164:621-624. [DOI] [PubMed] [Google Scholar]
- 39.Rosan, B., and R. J. Lamont. 2000. Dental plaque formation. Microbes Infect. 2:1599-1607. [DOI] [PubMed] [Google Scholar]
- 40.Smithies, W. R., and N. E. Gibbons. 1955. The deoxyribose nucleic acid slime layer of some halophilic bacteria. Can. J. Microbiol. 1:614-621. [DOI] [PubMed] [Google Scholar]
- 41.Steinberger, R. E., and P. A. Holden. 2005. Extracellular DNA in single- and multiple-species unsaturated biofilms. Appl. Environ. Microbiol. 71:5404-5410. [DOI] [PMC free article] [PubMed] [Google Scholar]
- 42.Steinmoen, H., E. Knutsen, and L. S. Havarstein. 2002. Induction of natural competence in Streptococcus pneumoniae triggers lysis and DNA release from a subfraction of the cell population. Proc. Natl. Acad. Sci. USA 99:7681-7686. [DOI] [PMC free article] [PubMed] [Google Scholar]
- 43.Stewart, P. S., and M. J. Franklin. 2008. Physiological heterogeneity in biofilms. Nat. Rev. Microbiol. 6:199-210. [DOI] [PubMed] [Google Scholar]
- 44.Thomas, V. C., L. R. Thurlow, D. Boyle, and L. E. Hancock. 2008. Regulation of autolysis-dependent extracellular DNA release by Enterococcus faecalis extracellular proteases influences biofilm development. J. Bacteriol. 190:5690-5698. [DOI] [PMC free article] [PubMed] [Google Scholar]
- 45.Valat, C., D. Champiat, T. T. N′Guyen, G. Loiseau, M. Raimbault, and D. Montet. 2003. Use of ATP bioluminescence to determine the bacterial sensitivity threshold to a bacteriocin. Luminescence 18:254-258. [DOI] [PubMed] [Google Scholar]
- 46.Vollmer, W., B. Joris, P. Charlier, and S. Foster. 2008. Bacterial peptidoglycan (murein) hydrolases. FEMS Microbiol. Rev. 32:259-286. [DOI] [PubMed] [Google Scholar]
- 47.Weerkamp, A. H., H. M. Uyen, and H. J. Busscher. 1988. Effect of zeta potential and surface energy on bacterial adhesion to uncoated and saliva-coated human enamel and dentin. J. Dent. Res. 67:1483-1487. [DOI] [PubMed] [Google Scholar]
- 48.Xu, P., J. M. Alves, T. Kitten, A. Brown, Z. Chen, L. S. Ozaki, P. Manque, X. Ge, M. G. Serrano, D. Puiu, S. Hendricks, Y. Wang, M. D. Chaplin, D. Akan, S. Paik, D. L. Peterson, F. L. Macrina, and G. A. Buck. 2007. Genome of the opportunistic pathogen Streptococcus sanguinis. J. Bacteriol. 189:3166-3175. [DOI] [PMC free article] [PubMed] [Google Scholar]
- 49.Xu, Y., K. V. Singh, X. Qin, B. E. Murray, and G. M. Weinstock. 2000. Analysis of a gene cluster of Enterococcus faecalis involved in polysaccharide biosynthesis. Infect. Immun. 68:815-823. [DOI] [PMC free article] [PubMed] [Google Scholar]
- 50.Zhang, Y., Y. Lei, A. Nobbs, A. Khammanivong, and M. C. Herzberg. 2005. Inactivation of Streptococcus gordonii SspAB alters expression of multiple adhesin genes. Infect. Immun. 73:3351-3357. [DOI] [PMC free article] [PubMed] [Google Scholar]
- 51.Zinkevich, V., and I. Beech. 2000. Isolation of intact high molecular weight chromosomal DNA from Desulfovibrio spp. Mol. Biol. Today 1:29-33. [Google Scholar]


