

Abstract
Stimulus-evoked oscillatory synchronization of neurons has been observed in a wide range of species. Here, we combined genetic strategies with paired intracellular and local field potential (LFP) recordings from the intact brain of Drosophila to study mechanisms of odor-evoked neural oscillations. We found common food odors at natural concentrations elicited oscillations in LFP recordings made from the mushroom body (MB), a site of sensory integration and analogous to the vertebrate piriform cortex. The oscillations were reversibly abolished by application of the GABAa blocker picrotoxin. Intracellular recordings from local and projection neurons within the antennal lobe (AL) (analogous to the olfactory bulb) revealed odor-elicited spikes and subthreshold membrane potential oscillations that were tightly phase locked to LFP oscillations recorded downstream in the MBs. These results suggested that, as in locusts, odors may elicit the oscillatory synchronization of AL neurons by means of GABAergic inhibition from local neurons (LNs). An analysis of the morphologies of genetically distinguished LNs revealed two populations of GABAergic neurons in the AL. One population of LNs innervated parts of glomeruli lacking terminals of receptor neurons, whereas the other branched more widely, innervating throughout the glomeruli, suggesting that the two populations might participate in different neural circuits. To test the functional roles of these LNs, we used the temperature-sensitive dynamin mutant gene shibire to conditionally and reversibly block chemical transmission from each or both of these populations of LNs. We found only the more widely branching population of LNs is necessary for generating odor-elicited oscillations.
Introduction
Olfactory systems perform complex information processing tasks that provide animals with descriptions of the environment, the ability to locate food and mates, and the chance to assign arbitrary meanings to odors through associative learning. To a great extent, invertebrates and vertebrates share similar mechanisms for odor detection (Hildebrand and Shepherd, 1997; Bargmann, 2006; Kay and Stopfer, 2006). Odorant molecules bind to olfactory receptors on the dendrites of olfactory receptor neurons (ORNs). ORNs send projections, sorted by receptor type, to discrete spherical synaptic structures, the glomeruli of the antennal lobe (AL) (in insects) or olfactory bulb (in vertebrates). Output from the glomeruli is carried to downstream olfactory areas by projection neurons (PNs) (in insects; mitral and tufted cells in vertebrates), most of which are excitatory. Glomeruli are also interlinked by local neurons (LNs) (inhibitory and excitatory LNs in insects; inhibitory granule and periglomerular cells in vertebrates) (Bargmann, 2006; Kay and Stopfer, 2006; Shang et al., 2007). In vertebrates and in insects, PNs and LNs form excitatory/inhibitory reciprocal synapses that are thought to coordinate the transient oscillatory synchronization of spikes in groups of PNs during odor stimulation (Laurent, 1999).
In insects, PNs convey information about odors to downstream olfactory areas including the mushroom body (MB) calyx and the lateral horn (Stocker et al., 1990; Tanaka et al., 2008). In locusts, Kenyon cells in the MB, which receive output from the PNs, also show oscillatory synchronized spikes phase locked to the local field potential (LFP) oscillations (Perez-Orive et al., 2002). The oscillatory synchronization of spiking in groups of PNs has been shown to be necessary for fine odor discrimination (Stopfer et al., 1997), and yet important questions about mechanisms underlying the generation of oscillations, and the functions served by oscillations, still remain unanswered.
Drosophila offers a great and growing variety of genetic tools to permit the labeling and functional manipulation of specific classes of neurons, providing many advantages for an analysis of the structure and functions of olfactory circuitry. Because of these advantages, Drosophila has become an important species for the study of olfaction. To date, however, it remains unclear whether odors elicit neural oscillations in Drosophila (Wang, 2000; Wilson et al., 2004; Turner et al., 2008); recent evidence suggesting that Drosophila uses no such mechanism (Wilson et al., 2004; Turner et al., 2008) raises questions about the pervasiveness, necessity, and circuitry underlying the oscillatory synchronization of olfactory neurons.
Here, we used simultaneous LFP recordings and intracellular recordings from genetically labeled neurons in the brains of intact Drosophila to determine whether and how this species generates odor-evoked neural oscillatory synchronization. We found that common odorants at natural concentrations indeed elicit oscillations in Drosophila. These oscillations synchronize groups of PNs and require the participation of a specific population of inhibitory, widely branching LNs in the AL. The oscillations are transmitted to the MB in which they can be recorded as LFPs.
Materials and Methods
Fly strains and preparation.
We used Canton-S as a wild type (gift from Chi-Hon Lee, National Institutes of Health, Bethesda, MD). Four GAL4 strains [Or83b–GAL4 in which the Or83b–GAL4 gene is inserted on the second chromosome (gift from Leslie Vosshall, Rockefeller University, New York, NY) (Larsson et al., 2004), NP225 in which the GAL4 gene is inserted on the second chromosome (Yoshihara and Ito, 2000; Tanaka et al., 2004), GAL4–LN1 (NP1227) in which the GAL4 gene is inserted on the second chromosome, and GAL4–LN2 (NP2426) in which the GAL4 gene is inserted on the X chromosome (Yoshihara and Ito, 2000; Sachse et al., 2007; Okada et al., 2009)] were used to drive the expression of upstream activating sequence (UAS)–shibirets1 (shi) UAS–green fluorescent protein (GFP), and UAS–synapto-pHluorin (UAS-spH). The line UAS–shibirets1 has its insertion on the third chromosome (gift from Toshihiro Kitamoto, University of Iowa, Iowa City, IA) (Kitamoto, 2001), UAS–GFP S65T on the second chromosome (T2 strain; gift from Barry Dickson, Research Institute of Molecular Pathology, Vienna, Austria), and UAS–spH on the second chromosome (gift from Chun-Yuan Ting and Chi-Hon Lee, National Institutes of Health, Bethesda, MD) (Ng et al., 2002). The GAL4 and all these UAS genes were heterozygous in subjects for all the experiments.
Flies were reared on Jazz-mix Drosophila food (Thermo Fisher Scientific) in an enclosure whose temperature was maintained at 23°C and humidity at >50%. Female flies, 2–10 d after eclosion, were used for experiments. For recordings, flies were anesthetized by putting them in vials on ice for <1 min and were then restrained in a custom-made plastic recording dish (supplemental Fig. 1, available at www.jneurosci.org as supplemental material). Wax was used on appendages to fix flies to the dish. The proboscis was extended as much as possible and fixed with wax to a bar set in the dish. The tops of antennae were covered with aluminum foil. Epoxy was used to seal the space between the fly body and the dish. Then, saline was applied over the top of the fly body and the dish, and a window was opened on the top of the head. Fat, air sacs, digestive system, and muscles causing brain movement were removed. Finally, the perineural sheathes between the pars intercerebralis and mushroom body (for LFP recordings) and dorsolateral to the antennal lobe (for the intracellular recordings) were gently removed. The areas desheathed were chosen to avoid damaging bodies of Kenyon cells, antennal lobe neurons, or fibers of olfactory receptor neurons. All dissection steps were performed with forceps. Saline was composed of the following (in mm): 103 NaCl, 3 KCl, 5 TES [N-tris(hydroxymethyl)methyl-2-aminoethanesulfonic acid], 10 trehalose, 10 glucose, 7 sucrose, 26 NaHCO3, 1 NaH2PO4, 1.5 CaCl2, and 4 MgCl2 (adjusted to 280 mOsm with sucrose and pH 7.25 with HCl or by bubbling 95% O2/5% CO2) (Wilson et al., 2004).
Odorant stimulation.
Ten milliliters of each odorant chemical (purified >99%; Sigma-Aldrich or Fluka) was placed, undiluted or diluted 10-fold to 1000-fold v/v in mineral oil (Mallinckrodt Baker), in a glass vial fitted with a silicone stopper. For yeast odor, we dissolved dry yeast (Red Star) in distilled water in 5% w/v. For banana odor, we pressed a piece of a ripe banana into a glass vial. Flies were placed into a constant stream of air (0.1–0.4 L/min, unless otherwise noted) that had been bubbled through distilled water after passing through a silica gel desiccator and a charcoal filter. Triggered by a pulse from a timer (Master-8; A.M.P.I.), puffs of air from a pneumatic picopump (PV 820; World Precision Instruments) pushed odorized air (0.1 L/min) from the headspace in an odor vial into the constant air flow, past the antenna, and then into a large vacuum funnel. Odorized and constant air streams mixed for a distance of 16 cm in a Teflon tube (diameter, 4 mm) placed 0.8 cm from the antenna. Odor pulses lasted 1 s unless otherwise noted and were presented at 12 s intervals.
Electrophysiology.
Intracellular and local field potential recordings were obtained with chlorided silver wire electrodes in capillary glass tubing (G100F-4; Warner Instruments) pulled with a Sutter Instruments P97 horizontal puller. For intracellular recordings, we used sharp glass electrodes filled with 2% Neurobiotin (Vector Laboratories) in 0.5 m potassium acetate (∼150 MΩ). For LFP recordings, we used glass electrodes with the tip broken and polished with a microforge (MF-830; Narishige) and filled with Drosophila saline (10–80 MΩ; the internal diameter of tips was ∼2 μm). LFP electrodes were guided through a desheathed area near the pars intercerebralis toward the mushroom body calyx with a micromanipulator (MP-285; Sutter Instruments) under a Carl Zeiss Axioskop 2 Plus microscope equipped with a water-immersion IR-Achroplan objective (40×/0.80) (Carl Zeiss). To record from GFP-positive cells, we excited GFP through filter sets (41001; Chroma Technology) with a mercury lamp (HBO 103 W/2; Osram) controlled by a FluoArc (Carl Zeiss) and directed sharp glass electrodes to the cell body. Before starting recordings, the emission light was always turned off. For other intracellular recordings, we inserted sharp glass electrodes into the AL without a specific target. In all cases, we injected Neurobiotin into cells with 1 nA rectangular current pulses of 150 ms duration at 3.3 Hz for 3–5 min so we could later histologically characterize the neurons we had recorded. Although we suspect that most of our untargeted recordings were made from neural processes rather than somata (processes fill much of the space of the AL; spikes we recorded typically rose very sharply), most of the time we could not be certain which part of a cell we had impaled. All recordings testing for odor-elicited oscillations began after we had delivered 10 or more pulses of the odor.
Recordings were made at room temperature (23°C), unless otherwise noted. Bath temperature was controlled by regulating saline perfusion with an in-line heater (SH-27B) connected to a TC-324B controller (Warner Instruments). Saline temperature was measured near the brain with a bead thermistor (TS-70B; Warner Instruments) connected to the TC-324B controller. In one experiment, we perfused the brain with saline containing 0.5 mm picrotoxin (Sigma) (Rohrbough and Broadie, 2002) for 6–8 min and then washed with saline for ∼10 min. Saline was exchanged at 1.8 ml/min by a peristaltic pump (RP-1; Rainin). Pulses of odors were applied continuously throughout experiments.
Recordings were amplified by an AxoClamp-2B (Molecular Devices). The LFP was further amplified by an instrumentation amplifier (model 440; Brownlee Precision). Data were acquired digitally at a sampling rate of 5 kHz (Labview software; National Instruments) and were stored on the hard drive of a personal computer.
Optical imaging.
Fluorescence of synapto-pHluorin protein was excited by a laser at 488 nm and imaged with a Carl Zeiss LSM 510 Meta confocal microscope. For each measurement, a series of 20 frames was taken at 2 Hz. Two frames of the mean fluorescent intensities of whole antennal lobes were averaged every second. During imaging trials, the brain-bathing saline was shifted from room temperature (23°C) to one restricting synaptic vesicle recycling (29°C) in genetically targeted neurons and back. For each test temperature, we measured odor responses five times and averaged them. Mean fluorescence was calculated by dividing the fluorescence intensity by that of the first 1 s of recording, 3 s before odor stimulation. Odors were delivered as with electrophysiological experiments except that odor pulses were delivered once each minute during recording, with a pause of 10 min after the bath was shifted from the restrictive to the permissive temperature.
Data analyses.
Except as noted, all analyses were performed using custom programs in MATLAB (MathWorks). Oscillatory power shown is the maximal spectral LFP power detected between 5 and 45 Hz; deflection amplitude was obtained by low-pass filtering the LFP at 5 Hz. To analyze the phase relationships of spikes in AL neurons with respect to the LFP, we included spikes recorded during periods when the LFP showed robust oscillations. To compare the power of oscillations recorded at different temperatures in flies with different genetic backgrounds, we used repeated measure multivariate ANOVAs (MANOVAs) on log-transformed data using SAS/STAT (SAS Institute).
Histology.
We dissected fly brains in Drosophila saline and fixed them in 4% paraformaldehyde/Sorenson's buffer (0.2 m, pH 7.2) for 35 min. All recorded neurons were imaged as follows: brains were washed with 0.2% Triton X-100/Sorenson's buffer, incubated with Alexa Fluor 568-conjugated streptavidin (S-11226; 1 mg/L diluted in 0.2% Triton X-100/Sorenson's buffer; Invitrogen) and with mouse monoclonal nc82 antibody (diluted at 1:10 in 10% goat serum/0.2% Triton X-100/Sorenson's buffer) and then with goat anti-mouse IgG conjugated with Alexa Fluor 633 (A21050; diluted at 1:200 in 10% goat serum/0.2% Triton X-100/Sorenson's buffer; Invitrogen). Each step was performed at 4°C overnight. Brains were finally washed with Sorenson's buffer and mounted in 50% glycerol/Sorenson's buffer.
To identify GABAergic and cholinergic neurons, we used rabbit anti-GABA antibody (624G; diluted at 1:200; Incstar) and mouse monoclonal anti-choline acetyltransferase antibody (diluted at 1:200; gift from Paul Salvaterra, Beckman Research Institute of the City of Hope, Duarte, CA and the Developmental Studies Hybridoma Bank of the University of Iowa, Iowa City, IA) was used as a primary antibody, respectively. As secondary antibodies, we used goat anti-rabbit IgG conjugated with cyanine 3 (81-6115; Zymed Laboratories) or anti-mouse IgG conjugated with Alexa Fluor 633.
To visualize the terminals of the ORNs in the AL, we cut the tip of the third antennal segments and maxillary palps and placed there crystals of dextran conjugated with tetramethylrhodamine and biotin (D-7162; Invitrogen). Two hours later, we dissected the brains and processed as noted above.
Confocal serial optical frontal sections of whole-mount brain samples were taken at 0.7–1.4 μm intervals with a Carl Zeiss LSM 510 upright or inverted Meta microscope equipped with oil-immersion 40× Plan-Neofluar and 63× Plan-Apochromat objectives (numerical aperture 1.3 and 1.4, respectively). Three-dimensional reconstruction was done using the LSM 5 Image Browser (Carl Zeiss) or Volocity 4 (Improvision). The contrast, size, and resolution of the images were adjusted according to standard practice with Photoshop 8.0 (Adobe Systems). The names and numbers of glomeruli were as cited previously (Couto et al., 2005).
Results
Odor-evoked neural oscillations in Drosophila
We made extracellular recordings of the LFP from the calyx of the MBs, a region receiving the output of PNs. We found that oscillatory responses with an average frequency of ∼10 Hz could be elicited by an assortment of natural odorants delivered at their normal concentrations (Fig. 1), including air collected from the headspace above fly attractants such as a ripe banana (Fig. 1A) and the yeast paste that serves as a component of fly food (data not shown).
Figure 1.
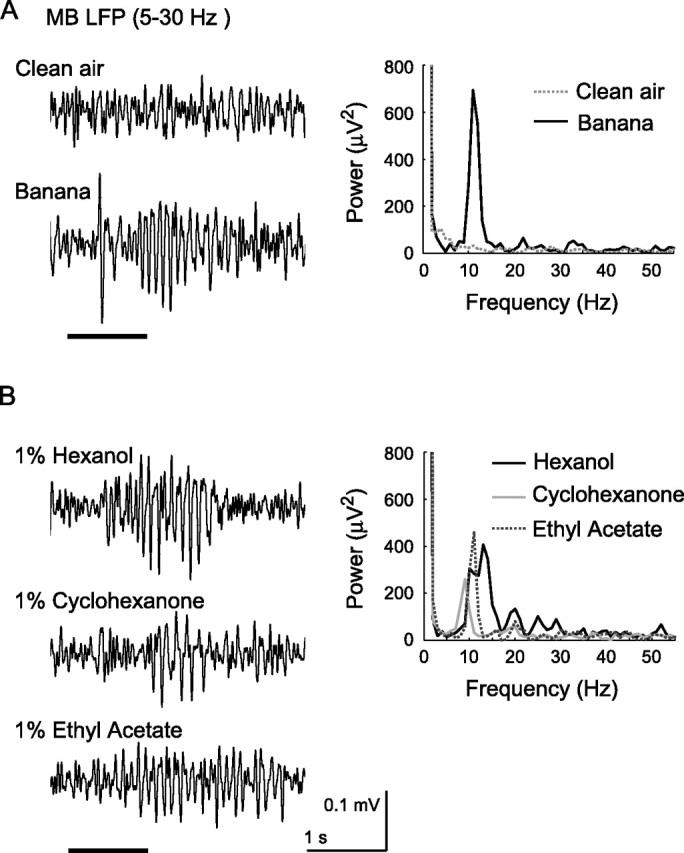
LFP oscillations recorded in the MB could be evoked by food odors (A) and by relatively low concentrations of pure chemicals (B). Left, LFP traces (5–30 Hz). Horizontal line, Pulse of clean air or odor injected into a stream of constant air. Right, Power spectrum of the LFP; average of three trials for each odorant. Calibration: 1 s, 0.1 mV (LFP).
Oscillations could also be elicited by puffs of a variety of dilute monomolecular chemicals (Fig. 1B). Puffs of clean air elicited no oscillations (Fig. 1A). In our experiments, odorants were injected into a stream of air constantly flowing over the antenna. We found that odors injected into air moving at flow rates of 0.1–0.4 L/min (air speed, 0.13–0.53 m/s) evoked robust oscillations, but odors carried by faster moving air elicited less oscillatory power (supplemental Fig. 2, available at www.jneurosci.org as supplemental material). Non-oscillatory LFP deflection amplitude varied only slightly with air flow rate, suggesting that odors borne by a broad range of air speeds elicited comparable levels of nonsynchronized spiking in PNs. Electroantennogram and electronic sensor measurements showed that the flow rate of air determined both the absolute concentration of odorant reaching the antenna and the duration over which the odor pulse extended (data not shown). To analyze these two effects, we separately varied odor concentration and duration and found that increasing either parameter increased oscillatory power (supplemental Fig. 3, available at www.jneurosci.org as supplemental material). Thus, as in other insects, increasing the concentrations of odors led to stronger oscillatory responses (Stopfer et al., 2003). We also found that, as in other insects, oscillations were typically not elicited by the first presentation of an odor but rather emerged gradually during repeated presentations (Stopfer and Laurent, 1999; Ito et al., 2006) (supplemental Fig. 4, available at www.jneurosci.org as supplemental material).
We considered that the odor-elicited oscillations we recorded in the MB might originate elsewhere, possibly within the circuitry of the AL. To test this, we made paired recordings, simultaneously monitoring the odor-elicited LFP from the MB calyx and intracellular responses from the PNs that supply the olfactory input to the MB calyx [those projecting through the inner antennocerebral tract (iACT)] (Stocker et al., 1990). For our intracellular recordings, we used sharp glass electrodes because they provide access not only to the relatively large cell bodies but also to fine neural processes physically and perhaps electrically remote from the soma. We found neurons by directing our electrodes into the AL and, after characterizing the physiological responses of a neuron, we injected Neurobiotin to permit us to subsequently confirm the type of the cell anatomically (Fig. 2A) [we also later counterstained the brains with the mouse monoclonal nc82 antibody to allow us to visualize and identify the glomeruli innervated by the neurons we had characterized (Laissue et al., 1999)]. Consistent with previous reports obtained with patch recording techniques (Wilson et al., 2004), amplitudes of spikes in PNs were <10 mV, but unlike previously reported results, our recordings revealed strong subthreshold voltage oscillations in the membrane potential. Furthermore, these oscillations were highly correlated with the LFP recorded simultaneously downstream in the MB calyx (Fig. 2B,C). We found that odor-elicited spikes in PNs were also tightly phase locked to LFP oscillations recorded in the MB (Fig. 2D) with a mean spike phase of 126 ± 46° (mean ± SD, where 0° is the peak of each cycle; 799 spikes from 4 cells). The strong correlation between the LFP oscillations recorded in the MB calyx and the membrane potential oscillations and spikes of the PNs support the idea that the oscillations were generated in the AL and were then transferred to the MB calyx by PNs. Furthermore, we could block oscillations recorded in the MB by applying picrotoxin, an antagonist of the ionotropic GABA receptors, to the bath. This treatment caused the power of LFP oscillations in the MB calyx to decrease to the basal level (Fig. 3). Thus, as in other insects shown to exhibit oscillations (MacLeod and Laurent, 1996; Stopfer et al., 1997), the generation of odor-elicited neural oscillations in Drosophila requires inhibitory output from GABAergic neurons.
Figure 2.
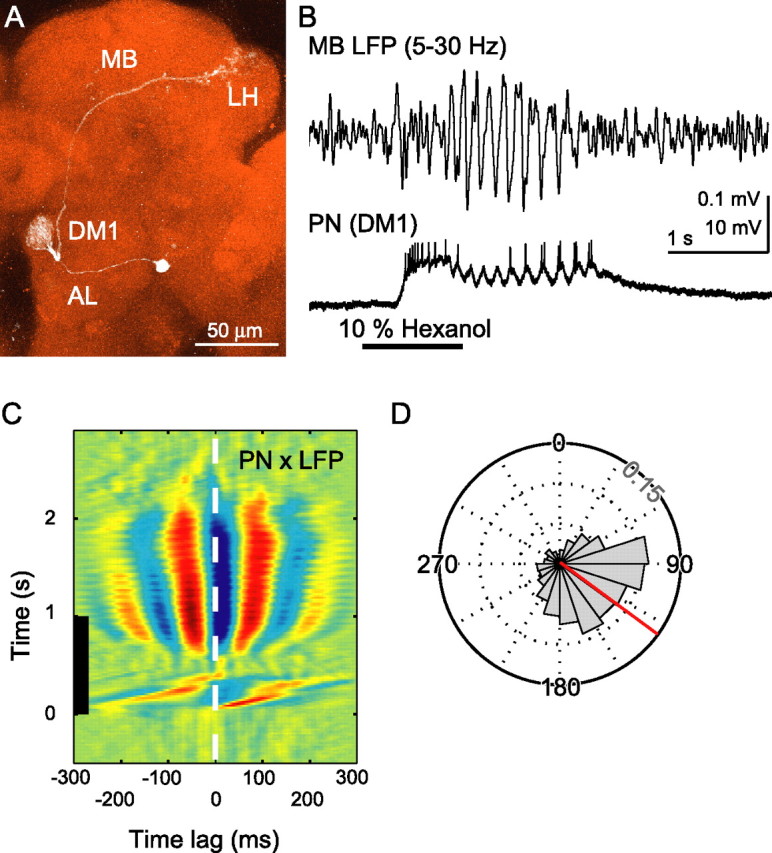
Paired intracellular and LFP recordings reveal coordinated odor-elicited oscillations. A, PN (response shown in B) innervated the DM1 glomerulus. White, Neurobiotin; red, neuropil counterstained with the mouse monoclonal nc82 antibody; LH, lateral horn. Scale bar, 50 μm. B, Paired recording of LFP from the MB (5–30 Hz bandpass; top) and membrane potential from a PN innervating the DM1 glomerulus (bottom). Calibration: 1 s, 0.1 mV (LFP) or 10 mV (PN). C, Sliding window cross-correlogram between the LFP and PN traces (average of 5 repeated odor presentations). Banding pattern indicates periods of oscillatory synchronization. Black bar, Odor presentation. D, The timing relationship between spikes in PNs and the phase of LFP oscillations (5–15 Hz bandpass) was very consistent (799 spikes from 4 cells). The LFP cycle maximum was defined as 0° and the minimum as 180°. Mean phase is shown in red. Gridlines are scaled in intervals of 0.05 (probability per bin). Odor was cyclohexanone, ethyl acetate, and hexanol.
Figure 3.

Picrotoxin reversibly blocks odor-evoked LFP oscillations. A, LFP recorded in the MB (5–30 Hz bandpass) before (top), during (middle), and after (bottom) bath application of the GABAa blocker picrotoxin. Oscillations sometimes increased during washout, as also observed in locusts. B, Maximum spectral power of LFP oscillations (5–45 Hz) recorded in the MB. Average of 10 repeated odor presentations for each of five animals was calculated. Odor was hexanol. *p < 0.05, significant difference in power between odor-evoked oscillations and basal level (n = 5; repeated measures MANOVA, Wilks' λ = 0.41; Finteraction = 4.98; p < 0.05). Error bars indicate SE.
Two morphologically distinct types of LNs in the AL
In insects, GABAergic output within the AL is known to be provided mainly by LNs (Homberg and Müller, 1999), but, as is generally true, little is known about the specific functional roles played by different classes of interneurons. Using genetic tools, we sought to distinguish types of inhibitory LNs and their roles in generating odor-elicited oscillations. We screened Drosophila for GAL4 enhancer-trap strains and identified two distinct strains that label GABAergic LNs specifically (GAL4–LN1 and GAL4–LN2) (Sachse et al., 2007; Okada et al., 2009). When crossed with UAS–GFP, the different populations of LNs could be visualized rather specifically and characterized anatomically (Fig. 4A,B). GAL4–LN1 labeled ∼18 LNs, termed LN1, whereas GAL4–LN2 visualized ∼37 LNs (LN2) (Sachse et al., 2007). In addition to the LNs in the AL, a few neurons in the ventrolateral protocerebrum (GAL4–LN1) and in the optic lobe and subesophageal ganglion (GAL4–LN2) were labeled as well (Okada et al., 2009) (Fig. 4A,B). Both populations of LNs in the AL had cell bodies close to each other at the dorsolateral side of the lobe, and, collectively, the dendrites of each population innervated all glomeruli (Fig. 4A,B). Anti-GABA antibody staining revealed that ∼95% of each population of LN was clearly GABAergic (supplemental Fig. 5, available at www.jneurosci.org as supplemental material) (Okada et al., 2009). One or two cells of each type of LN did not appear to be GABAergic; counterstaining with anti-choline acetyltransferase antibody suggested that these cells were not cholinergic, either (data not shown).
Figure 4.
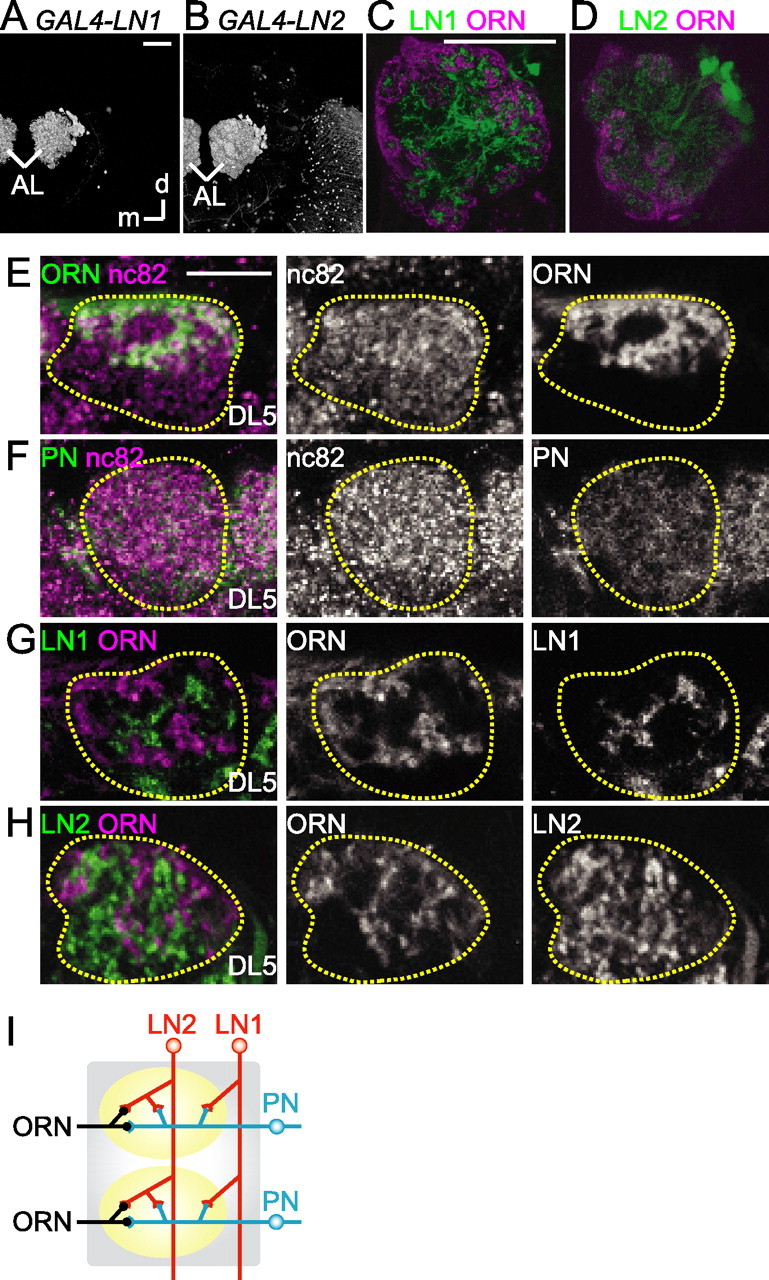
Two populations of LNs in the AL have different branching patterns. A, B, Three-dimensional reconstructed LN1 (A) and LN2 (B). C–H, Single confocal cross sections of the terminals of the LN1 (C, G), LN2 (D, H), ORN (E), and PN (F) labeled with GFP at the level of the DL5 glomerulus. Yellow dashed line, Outline of the DL5 glomerulus. Single confocal sections of the whole antennal lobe are shown in C and D, whereas only the DL5 glomerulus is shown in other figures. Green, Each population of neurons labeled with GFP by Or83b–GAL4 (E), NP225–GAL4 (F), GAL4–LN1 (C, G), and GAL4–LN2 (D, H). Magenta, Mouse monoclonal nc82 antibody staining in E and F; ORNs labeled with dextran compounds in C, D, G, and H. d, Dorsal; m, medial. Scale bars: A, C, 50 μm; E, 10 μm. I, Schematic diagram of putative connective patterns of four types of AL neurons suggested by confocal micrographs; electron microscopy is necessary to confirm the synaptic connectivity of these neurons. Possible connections between LN types are not drawn.
We found the two populations of LNs had distinct arborization patterns, particularly with respect to the arborizations of ORNs (Fig. 4C,D). Terminals of ORNs occupied the outer rind of glomeruli (Hummel and Zipursky, 2004) (Fig. 4E). Within this outer rind, some “restricted” regions were not innervated by ORNs but were rather encircled by the ORNs terminals (Fig. 4E). PNs of the iACT, however, arborized uniformly throughout the glomeruli (Fig. 4F). We found that LN1 cells arborized within the restricted areas of the glomeruli (Fig. 4C,G). In fact, arborization sites of LN1 cells and ORNs appeared to be mutually exclusive; double-stained ALs showed LN1 cells arborized in the restricted region of the outer part that lacked ORNs terminals and the inner part of the glomeruli (Fig. 4C,G) (supplemental Fig. 6, available at www.jneurosci.org as supplemental material), a result consistent with LNs labeled by GH298–GAL4, another marker for LNs (Hummel and Zipursky, 2004). Conversely, the widely branching LN2 cells innervated the entire glomeruli (Fig. 4D,H) (supplemental Fig. 6, available at www.jneurosci.org as supplemental material). Imaged with confocal microscopy, the arborization areas of these two types of LN suggest that LN2 cells had extensive synaptic contacts with both of ORNs and PNs, whereas LN1 cells had extensive contacts with PNs but very little contact with ORNs (schematized in Fig. 4I) (we are presently testing this possibility with electron microscopy).
Because the arborization patterns of the two populations of the GABAergic LNs were so distinct, we hypothesized the two classes of neuron might play different roles in generating the oscillations. To examine their functions, we first analyzed the timing of odor-elicited spikes recorded in each LN type with respect to the LFP oscillations recorded in the MB calyx. Using GAL4 drivers, we expressed GFP protein in either type of LN, which allowed us to target them with sharp electrodes; after characterizing their responses to odors, we injected Neurobiotin and later confirmed the type of neuron we had recorded by noting colocalization of GFP and Neurobiotin (Fig. 5A,B). Single-cell stainings with Neurobiotin revealed that these two populations of LNs we recorded (n = 6 for LN1 and n = 7 for LN2) had distinct branching patterns among glomeruli. Consistent with a recent single-cell analysis (Okada et al., 2009), LN1 and LN2 cells showed different connectivity patterns among the glomeruli. Of the LN1 cells in our sample, half innervated all the glomeruli; the other LN1 cells innervated all but the dorsolateral glomeruli. The number of glomeruli innervated by each LN1 ranged from 46 to 49 (47.5 ± 1.6, mean ± SD). Conversely, the LN2 cells were a more heterogeneous group. The number of glomeruli innervated by each LN2 cell ranged from 29 to 48 (42.7 ± 7.1). The spatial patterns of glomeruli lacking innervations of LN2 cells were much more variable than those of LN1 cells (data not shown).
Figure 5.

Spikes in LNs phase lock to LFP oscillations recorded in the MB. A, B, Representative odor-evoked responses in two types of LNs (bottom: LN1, A; LN2, B) and simultaneously recorded LFPs (top: 5–30 Hz bandpass). Odor-elicited periods of excitation and inhibition varied with the cell and the odor; we found no systematic differences in response patterns between LN1 and LN2 cells. Black bar, Odor pulse. Left, Neurobiotin injected to the neuron recorded (magenta) overlaps with the GFP expressed in LNs (green). Scale bar, 50 μm. Calibration: 1 s, 0.3 mV (LFP) and 10 mV (LN). C, D, Phase relationships between spikes in LN1 (C) or LN2 (D) and the LFP oscillations (5–15 Hz) are consistent (362 spikes from 4 LN1 cells and 234 spikes from 6 LN2 cells). The LFP cycle maxima defined as 0° and the minima as 180°. Mean phase is shown in red. Gridlines are scaled in intervals of 0.05 (probability per bin). Odor was cyclohexanone, ethyl acetate, and hexanol.
LNs of both types responded to odors with patterns of spiking (Fig. 5A,B) like those described previously (Wilson and Laurent, 2005); patterns varied with odor and cell, and we found no systematic differences in firing patterns between LN1 cells and LN2 cells. Furthermore, our paired, simultaneous recordings of the LFP from the MB and of LNs revealed that spikes elicited by odors in both LN1 and LN2 cells phase locked with the LFP oscillations. LNs of both types showed similar, strong phase preferences (Fig. 5C,D). For LN1, the mean spike phase was 146 ± 49° (362 spikes from 4 cells) and, for LN2, 143 ± 44° (234 spikes from 6 cells). That both populations of LNs fired at similar phases suggested that both might receive excitatory input from the same neurons, possibly PNs. Consistent with this, the mean spike phase of PNs (Fig. 2D) slightly preceded that of both types of LN.
Oscillations are caused by one specific population of LNs
We next analyzed the extent to which the two classes of LN contribute to generating odor-elicited oscillations. To regulate the output of the neurons, we expressed the shi gene in each type of LN. The shi gene encodes a temperature-sensitive dynamin mutant protein that can conditionally and reversibly block chemical synaptic transmission at a restrictive temperature (Kitamoto, 2001).
Because output of neurons expressing shi is controlled by temperature shifts, we first analyzed how temperature itself affects the LFP oscillations in wild-type Drosophila. We gradually changed the temperature of the saline bath from 23°C (our usual room temperature) to 29°C and found that the frequency of odor-elicited oscillations changed nearly in proportion to the change in temperature (Fig. 6A–C). At the highest temperature, the frequency increased to almost 1.5 times that of room temperature. Conversely, the power of the oscillation decreased somewhat with increasing temperature, although this change was not statistically significant (Fig. 6D).
Figure 6.

Temperature shifts alone affect LFP oscillation frequency and power in MB of wild-type flies. A, The LFP (5–30 Hz) at 23°C (top) and 29°C (bottom) is shown. B, Power spectrum of the LFP oscillations (average result of 10 repeated odor presentations at each temperature from this experiment). C, D, Temperature-dependent changes in frequency (C) and power (maximum of 5–45 Hz; D) of LFP oscillations. These effects were reversible. Recordings began at 23°C and then temperature was raised gradually (25–29°C); 23°C (the rightmost column) was repeated at the end to confirm that recording conditions had not changed over the course of the experiment. Average responses to 10 repeated odor presentations for each of five wild-type animals at each temperature are shown. *,**p < 0.05, significantly different from all the other temperatures (n = 5 animals; 2-way ANOVA, Ftemperature = 67.55; p < 0.0001). Odor was hexanol. Error bars indicate SE.
We next expressed the shi gene in either or both of the two populations of LNs. In these experiments, we began with the bath at the permissive temperature (23°C), raised it to the restrictive temperature (29°C), and finally returned the bath to the permissive temperature again. At each temperature, we recorded the LFP elicited by each of 20 1-s odor pulses. We found that negative control flies bearing UAS–shi, but lacking the GAL4 gene, showed LFP oscillatory power no different from that of wild-type flies at each temperature (Fig. 7A). Similarly, results from GAL4–LN1 and LN2 heterozygous flies (lacking UAS–shi) were not significantly different from wild type (data not shown). Flies expressing the shi gene in LN1 yielded results no different from wild type (Fig. 7B). However, we found that flies expressing the shi gene in either LN2 alone (Fig. 7C) or in both LN1 and LN2 showed a greater temperature-sensitive decrease in oscillatory power, significantly different from the wild type. These results are summarized in Figure 7D (solid lines). Odor-elicited oscillatory power always exceeded basal activity recorded 1 s before each odor stimulation (Fig. 7D, dotted lines). We found no significant differences in oscillatory power in flies expressing UAS–shi in LN2 and flies expressing UAS–shi in both LN1 and LN2 strains (Fig. 7D). Conversely, we did not find any synergic effects of temperature and shi expression on the frequency of oscillations (data not shown).
Figure 7.
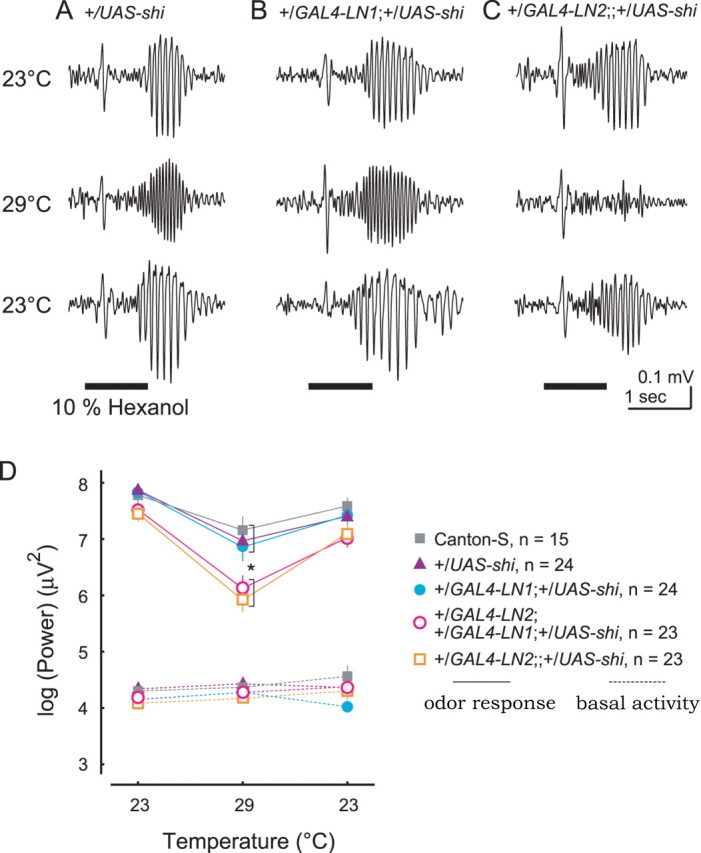
Synaptic output of a specific population of LNs is necessary to generate neural oscillations. A–C, LFP oscillations recorded in UAS–shi heterozygous flies (A) and flies with UAS–shi driven by GAL4–LN1 (B) or GAL4–LN2 (C). Temperature was shifted from 23°C (top) to 29°C (middle) and back to 23°C (bottom). D, Only LN2 is required for oscillations. Solid lines, Mean odor-evoked LFP spectral power (maximum between 5 and 45 Hz, 20 repeated odor presentations); dotted lines, mean basal spectral power 1 s before odor presentations. Mean results from 15–24 animals of each strain are plotted. Temperature was shifted from 23°C to 29°C and back to 23°C. Log-scaled values were compared among different strains so that dependent variables were normally distributed. After a MANOVA test, planned comparisons were made for each temperature. *p < 0.05, at the restrictive temperature, flies expressing UAS–shi in LN2 showed odor responses significantly different from all other strains (repeated measures MANOVA; Wilks' λ = 0.86; Fstrain × temperature = 2.03; p < 0.05). For all strains, oscillatory power was significantly elevated above basal levels by odor presentation (p < 0.0001). Odor was hexanol. Error bars indicate SE.
Because shi expression appeared to have little effect in LN1, we sought to confirm that shi protein expressed in LN1 cells effectively reduced presynaptic output at the restrictive temperature. Thus, we coexpressed spH protein, a fluorescent marker of vesicle release (Ng et al., 2002), along with the shi gene in LN1 and directly imaged synaptic output with a confocal microscope. After we exposed these flies to odorants at the restrictive temperature under the same conditions we used to make LFP recordings, we observed optically recorded odor responses of spH protein in LN1 cells expressing the shi gene that were significantly smaller than those in flies not expressing shi (supplemental Fig. 7, available at www.jneurosci.org as supplemental material). Together, these results indicate that only LN2 contributes to generating odor-elicited oscillations.
Discussion
Our results demonstrate that the olfactory system of Drosophila, like those of taxonomically distant locusts and honeybees, as well as many vertebrates, can respond with oscillatory neural synchrony when presented with odorants. The great and growing diversity of species demonstrating odor-elicited oscillations implies that this response may be of fundamental significance. Indeed, in honeybees, pharmacologically abolishing oscillations has been shown to impair fine odor discrimination (Stopfer et al., 1997). Our results show that the mechanisms underlying the oscillations are remarkably similar to those characterized in the locust: antennal afference drives neural circuitry consisting of reciprocally connected excitatory PNs and inhibitory LNs to oscillate, leading to transiently synchronized spiking in PNs that transmit regular, sinusoidal waves of excitation to the MBs. Our use of genetic techniques in Drosophila allowed us to confirm the importance of inhibition from specific LNs of the AL for generating oscillations and to characterize this mechanism with unprecedented precision.
During odor presentations, Drosophila AL neurons fired at reliable phase positions with respect to the LFP oscillations recorded in the MB, as also observed in the locust. However, the spike phase positions in Drosophila were somewhat different from those characterized in locust, likely because of species-specific differences in neural pathway length and in the firing properties of LNs in the two species. In Drosophila, in which LNs generate fast sodium spikes, PNs led LNs by ∼20° each cycle. However, in locusts, in which LNs generate slow-to-rise, graded calcium spikelets, PNs led LNs by 180° (MacLeod and Laurent, 1996). The phase relationships we observed in Drosophila are similar to those noted recently in odor-elicited oscillations in the moth Manduca sexta (Ito et al., 2006), in which both LNs and PNs generate fast sodium spikes.
Interestingly, the air speed we found most effective for eliciting robust oscillations (∼0.4 m/s) closely matches that at which flying Drosophila most effectively localize odor sources (Budick and Dickinson, 2006). In fact, the ability of Drosophila to orient toward odor sources was compromised when they encountered odors in air moving at other velocities (Budick and Dickinson, 2006) with a response profile matching our measurements of oscillatory power in the LFP (supplemental Fig. 2, available at www.jneurosci.org as supplemental material). This match between physiological and behavioral results indicates that the odor-elicited oscillations we observed occurred under conditions in which Drosophila successfully perform an olfactory task. This encourages us to speculate that mechanisms underlying LFP oscillations and flight chemotaxis may share common features. Other workers presenting brief pulses of odors to Drosophila in faster-moving air have not observed odor-elicited LFP oscillations (Wilson et al., 2004; Turner et al., 2008). Our results suggest that, as in other animals, oscillations elicited by lengthier exposures or stronger concentrations of odors are more easily detected.
We found that oscillations could begin at odorant-dependent times relative to the initial deflection in the LFP that indicates the arrival of odorant at the antenna (up to 500 ms delay in the fly compared with a typical 200 ms delay in locust). In a single fly, for example, oscillations evoked by hexanol were reliably delayed 300 ms longer than those evoked by ethyl acetate (supplemental Fig. 8, available at www.jneurosci.org as supplemental material). The relatively delayed onset suggests that oscillations might not be essential for the earliest stages of odor recognition in Drosophila. Flies can perform simple odor detection and response behaviors within 300 ms of encountering the odorants (Budick and Dickinson, 2006), a time generally before we detected the onset of oscillatory activity. It will be interesting to determine whether flies require more time to perform difficult odor discrimination tasks, as has been observed in other species (Rinberg et al., 2006). If so, information processing tasks facilitated by neural oscillations may contribute to the successful completion of challenging or prolonged olfactory tasks.
In locusts, each PN branches very widely and diffusely throughout the MB calyx, and connectivity between PNs and Kenyon cells is extensive (Jortner et al., 2007). The rhythmic shutter-like inhibition provided by odor-elicited oscillations is thought to contribute significantly in the locust to the sparsening of neural representations of odors in the Kenyon cells (Perez-Orive et al., 2002). In Drosophila, however, PNs generally branch far less broadly than they do in locusts (Wong et al., 2002). Thus, the contributions of oscillations toward the sparsening of odor representations may be less in the fly than in the locust.
Here, we demonstrated that common odors evoke neural oscillations in Drosophila and found that these oscillations originate in the AL and are transmitted to the MB. Using a genetic strategy, we identified two classes of inhibitory LNs in Drosophila. In terms of their connectivity patterns, these LNs appear similar to inhibitory neurons in the vertebrate olfactory bulb: LN2 cells appear to associate directly with both ORNs and PNs, as do periglomerular cells with ORNs and mitral cells, whereas LN1 cells appear to associate directly only with PNs, as do granule cells with mitral cells (Shepherd and Greer, 1998). Interestingly, Drosophila LN2 cells are necessary for oscillations, whereas in vertebrates granule cells are important for oscillations (Schoppa, 2006), likely because these neurons provide similar connective patterns among glomeruli. Both LN2 and granule cells have wide branching patterns, suggesting that global inhibition of glomerular activity by each neuron may be necessary to cause oscillations.
By virtue of its amenability to genetic manipulation, Drosophila has become a leading experimental model for the study of olfaction. We have shown that Drosophila shares prominent features of olfactory processing with other insects and vertebrates. Applying genetic tools will allow dissecting the mechanisms and functions of neural oscillations with unprecedented precision.
Footnotes
This work was funded by an intramural grant from the National Institutes of Health–National Institute of Child Health and Human Development (M.S.). N.K.T. was supported by the Japan Society for the Promotion of Science Research Fellowship for Japanese Biomedical and Behavioral Researchers at National Institutes of Health. We are grateful to members of the Stopfer laboratory, especially Iori Ito and Joby Joseph for assistance with programming in MATLAB and for many helpful suggestions and Baranidharan Raman for providing the electronic sensor to track effects of varying air flow rates. We thank Chi-Hon Lee, Chun-Yuan Ting, Benjamin White, Toshihiro Kitamoto, Barry Dickson, Leslie Vosshall, and the NP Consortium for providing fly strains, Phoung Chung for providing Drosophila food, Ryuichi Okada for helpful discussions, National Institute of Child Health and Human Development Microscopy and Imaging Core and National Institute of Mental Health Research Services Branch for technical assistance, members of Gilles Laurent's laboratory for sharing their experimental procedures, Geraldine Wright for statistical analyses, Susan Wray for providing anti-GABA antibody, Paul Salvaterra and the Developmental Studies Hybridoma Bank of the University of Iowa for providing anti-ChAT antibody, and Alois Hofbauer for providing nc82 antibody. We thank Leonardo Belluscio for the use of his confocal microscope, and him and Joshua Bagley for helpful advice.
References
- Bargmann CI. Comparative chemosensation from receptors to ecology. Nature. 2006;444:295–301. doi: 10.1038/nature05402. [DOI] [PubMed] [Google Scholar]
- Budick SA, Dickinson MH. Free-flight responses of Drosophila melanogaster to attractive odors. J Exp Biol. 2006;209:3001–3017. doi: 10.1242/jeb.02305. [DOI] [PubMed] [Google Scholar]
- Couto A, Alenius M, Dickson BJ. Molecular, anatomical, and functional organization of the Drosophila olfactory system. Curr Biol. 2005;15:1535–1547. doi: 10.1016/j.cub.2005.07.034. [DOI] [PubMed] [Google Scholar]
- Hildebrand JG, Shepherd GM. Mechanisms of olfactory discrimination: converging evidence for common principles across phyla. Annu Rev Neurosci. 1997;20:595–631. doi: 10.1146/annurev.neuro.20.1.595. [DOI] [PubMed] [Google Scholar]
- Homberg U, Müller U. Neuroactive substances in the antennal lobe. In: Hansson B, editor. Insect olfaction. Berlin: Springer; 1999. pp. 181–206. [Google Scholar]
- Hummel T, Zipursky SL. Afferant induction of olfactory glomeruli requires N-Cadherin. Neuron. 2004;42:77–88. doi: 10.1016/s0896-6273(04)00158-8. [DOI] [PubMed] [Google Scholar]
- Ito I, Ong RCY, Raman B, Stopfer M. Sparse odor representation and olfactory learning. Soc Neurosci Abstr. 2006;32:541–8. doi: 10.1038/nn.2192. [DOI] [PMC free article] [PubMed] [Google Scholar]
- Jortner RA, Farivar SS, Laurent G. A simple connectivity scheme for sparse coding in an olfactory system. J Neurosci. 2007;27:1659–1669. doi: 10.1523/JNEUROSCI.4171-06.2007. [DOI] [PMC free article] [PubMed] [Google Scholar]
- Kay LM, Stopfer M. Information processing in the olfactory systems of insects and vertebrates. Semin Cell Dev Biol. 2006;17:433–442. doi: 10.1016/j.semcdb.2006.04.012. [DOI] [PubMed] [Google Scholar]
- Kitamoto T. Conditional modification of behavior in Drosophila by targeted expression of a temperature-sensitive shibire allele in defined neurons. J Neurobiol. 2001;47:81–92. doi: 10.1002/neu.1018. [DOI] [PubMed] [Google Scholar]
- Laissue PP, Reiter C, Hiesinger PR, Halter S, Fischbach KF, Stocker RF. Three-dimensional reconstruction of the antennal lobe in Drosophila melanogaster. J Comp Neurol. 1999;405:543–552. [PubMed] [Google Scholar]
- Larsson MC, Domingos AI, Jones WD, Chiappe ME, Amrein H, Vosshall LB. Or83b encodes a broadly expressed odorant receptor essential for Drosophila olfaction. Neuron. 2004;43:703–714. doi: 10.1016/j.neuron.2004.08.019. [DOI] [PubMed] [Google Scholar]
- Laurent G. A systems perspective on early olfactory coding. Science. 1999;286:723–728. doi: 10.1126/science.286.5440.723. [DOI] [PubMed] [Google Scholar]
- MacLeod K, Laurent G. Distinct mechanisms for synchronization and temporal patterning of odor-encoding neural assemblies. Science. 1996;274:976–979. doi: 10.1126/science.274.5289.976. [DOI] [PubMed] [Google Scholar]
- Ng M, Roorda RD, Lima SQ, Zemelman BV, Morcillo P, Miesenböck G. Transmission of olfactory information between three populations of neurons in the antennal lobe of the fly. Neuron. 2002;36:463–474. doi: 10.1016/s0896-6273(02)00975-3. [DOI] [PubMed] [Google Scholar]
- Okada R, Awasaki T, Ito K. Gamma-aminobutyric acid (GABA)-mediated neural connections in the Drosophila antennal lobe. J Comp Neurol. 2009;514:74–91. doi: 10.1002/cne.21971. [DOI] [PubMed] [Google Scholar]
- Perez-Orive J, Mazor O, Turner GC, Cassenaer S, Wilson RI, Laurent G. Oscillations and sparsening of odor representations in the mushroom body. Science. 2002;297:359–365. doi: 10.1126/science.1070502. [DOI] [PubMed] [Google Scholar]
- Rinberg D, Koulakov A, Gelperin A. Speed-accuracy tradeoff in olfaction. Neuron. 2006;51:351–358. doi: 10.1016/j.neuron.2006.07.013. [DOI] [PubMed] [Google Scholar]
- Rohrbough J, Broadie K. Electrophysiological analysis of synaptic transmission in central neurons of Drosophila larvae. J Neurophysiol. 2002;88:847–860. doi: 10.1152/jn.2002.88.2.847. [DOI] [PubMed] [Google Scholar]
- Sachse S, Rueckert E, Keller A, Okada R, Tanaka NK, Ito K, Vosshall LB. Activity-dependent plasticity in an olfactory circuit. Neuron. 2007;56:838–850. doi: 10.1016/j.neuron.2007.10.035. [DOI] [PubMed] [Google Scholar]
- Schoppa NE. Synchronization of olfactory bulb mitral cells by precisely timed inhibitory inputs. Neuron. 2006;49:271–283. doi: 10.1016/j.neuron.2005.11.038. [DOI] [PubMed] [Google Scholar]
- Shang Y, Claridge-Chang A, Sjulson L, Pypaert M, Miesenböck G. Excitatory local circuits and their implications for olfactory processing in the fly antennal lobe. Cell. 2007;128:601–612. doi: 10.1016/j.cell.2006.12.034. [DOI] [PMC free article] [PubMed] [Google Scholar]
- Shepherd GM, Greer CA. Olfactory bulb. In: Shepherd GM, editor. The synaptic organization of the brain. Oxford: Oxford UP; 1998. pp. 159–203. [Google Scholar]
- Stocker RF, Lienhard MC, Borst A, Fischbach KF. Neuronal architecture of the antennal lobe in Drosophila melanogaster. Cell Tissue Res. 1990;262:9–34. doi: 10.1007/BF00327741. [DOI] [PubMed] [Google Scholar]
- Stopfer M, Laurent G. Short-term memory in olfactory network dynamics. Nature. 1999;402:664–668. doi: 10.1038/45244. [DOI] [PubMed] [Google Scholar]
- Stopfer M, Bhagavan S, Smith BH, Laurent G. Impaired odour discrimination on desynchronization of odour-encoding neural assemblies. Nature. 1997;390:70–74. doi: 10.1038/36335. [DOI] [PubMed] [Google Scholar]
- Stopfer M, Jayaraman V, Laurent G. Intensity versus identity coding in an olfactory system. Neuron. 2003;39:991–1004. doi: 10.1016/j.neuron.2003.08.011. [DOI] [PubMed] [Google Scholar]
- Tanaka NK, Awasaki T, Shimada T, Ito K. Integration of chemosensory pathways in the Drosophila second-order olfactory centers. Curr Biol. 2004;14:449–457. doi: 10.1016/j.cub.2004.03.006. [DOI] [PubMed] [Google Scholar]
- Tanaka NK, Tanimoto H, Ito K. Neuronal assemblies of the Drosophila mushroom body. J Comp Neurol. 2008;508:711–755. doi: 10.1002/cne.21692. [DOI] [PubMed] [Google Scholar]
- Turner GC, Bazhenov M, Laurent G. Olfactory representations by Drosophila mushroom body neurons. J Neurophysiol. 2008;99:734–746. doi: 10.1152/jn.01283.2007. [DOI] [PubMed] [Google Scholar]
- Wang JW. Odor-induced oscillatory activity in Drosophila CNS. Biol Bull. 2000;199:170–171. doi: 10.2307/1542880. [DOI] [PubMed] [Google Scholar]
- Wilson RI, Laurent G. Role of GABAergic inhibition in shaping odor-evoked spatiotemporal patterns in the Drosophila antennal lobe. J Neurosci. 2005;25:9069–9079. doi: 10.1523/JNEUROSCI.2070-05.2005. [DOI] [PMC free article] [PubMed] [Google Scholar]
- Wilson RI, Turner GC, Laurent G. Transformation of olfactory representations in the Drosophila antennal lobe. Science. 2004;303:366–370. doi: 10.1126/science.1090782. [DOI] [PubMed] [Google Scholar]
- Wong AM, Wang JW, Axel R. Spatial representation of the glomerular map in the Drosophila protocerebrum. Cell. 2002;109:229–241. doi: 10.1016/s0092-8674(02)00707-9. [DOI] [PubMed] [Google Scholar]
- Yoshihara M, Ito K. Improved Gal4 screening kit for large-scale generation of enhancer-trap strains. Drosoph Inf Serv. 2000;83:199–202. [Google Scholar]