

Abstract
We studied the neural correlates of rapid eye movement during sleep (REM) by timing REMs from video recording and using rapid event‐related functional MRI. Consistent with the hypothesis that REMs share the brain systems and mechanisms with waking eye movements and are visually‐targeted saccades, we found REM‐locked activation in the primary visual cortex, thalamic reticular nucleus (TRN), ‘visual claustrum’, retrosplenial cortex (RSC, only on the right hemisphere), fusiform gyrus, anterior cingulate cortex, and the oculomotor circuit that controls awake saccadic eye movements (and subserves awake visuospatial attention). Unexpectedly, robust activation also occurred in non‐visual sensory cortices, motor cortex, language areas, and the ascending reticular activating system, including basal forebrain, the major source of cholinergic input to the entire cortex. REM‐associated activation of these areas, especially non‐visual primary sensory cortices, TRN and claustrum, parallels findings from waking studies on the interactions between multiple sensory data, and their ‘binding’ into a unified percept, suggesting that these mechanisms are also shared in waking and dreaming and that the sharing goes beyond the expected visual scanning mechanisms. Surprisingly, REMs were associated with a decrease in signal in specific periventricular subregions, matching the distribution of the serotonergic supraependymal plexus. REMs might serve as a useful task‐free probe into major brain systems for functional brain imaging. Hum Brain Mapp 2009. © 2008 Wiley‐Liss, Inc.
Keywords: fMRI, REM, thalamic reticular nucleus, multisensory, oculomotor circuit, visual scanning
INTRODUCTION
The well‐characterized neural systems controlling saccadic eye movements during waking [for review, see Leigh and Zee, 2006; Müri, 2006] overlap with the visuospatial attentional system [Beauchamp et al., 2001; Corbetta et al., 1998; Gitelman et al., 2002; Perry and Zeki, 2000] (see Table II for list). Visual imagery during waking [Brandt and Stark, 1997; Finke, 1980; Kosslyn, 1994; Laeng and Teodorescu, 2002; O'Craven and Kanwisher, 2000; Roland and Friberg, 1985] and dreaming [Farah, 1984] shares the brain systems and mechanisms with visual perception of real objects or scenes. A prior positron emission tomography (PET) study [Hong et al., 1995] showed that cortical areas that are involved in REMs are also involved in eye movements in wakefulness, consistent with the revised scanning hypothesis proposing that REMs are visually‐guided saccades that reflexively explore dream imagery. This hypothesis is also consistent with the finding that the number of REMs correlates with the amount of visual imagery in dreams [Hong et al., 1997]. In the present study, we did not intend to test the revised scanning hypothesis (see DISCUSSION), but instead used it as a heuristic framework to organize REM‐locked activation data. We expected to find extensive overlap between REM‐locked activation and the system that controls waking eye movements and also subserves visuospatial attention. We also expected to find REM‐locked activation in the structures involved in visually‐guided scanning during wakefulness. These expectations were borne out. In addition to the predicted results, we report patterns of activation/deactivation time‐locked to REMs not previously reported.
Table II.
Brain regions activated in association with REMs
| Left | Right | |||||||
|---|---|---|---|---|---|---|---|---|
| x | y | z | t | x | y | za | t | |
| Ascending reticular activation system | ||||||||
| Thalamus | −14 | −13 | 14 | 9.7 | 4 | −6 | 6 | 10.5 |
| Thalamic reticular nucleus | −24 | −16 | −1 | 13.3 | 24 | −18 | −2 | 11.4 |
| Mesopontine tegmentum | 0 | −32 | −17 | 8.7 | ||||
| Substantia innominata | −26 | −2 | −7 | 10.8 | 22 | 0 | −8 | 13.5 |
| Primary sensory cortices | ||||||||
| Visual (BA 17) | −4 | −62 | 12 | 13.5 | 4 | −87 | 4 | 15.7 |
| Auditory | −36a | −26 | 16 | 7.6 | 50a | −21 | 12 | 7.6 |
| Somatosensory | −34 | −26 | 60 | 8.8 | 51a | −13 | 45 | 6.7 |
| Olfactory | −36a | 11 | −12 | 6.6 | 34 | 9 | −11 | 7.3 |
| Vestibular | −32 | −20 | 18 | 8.9 | 40 | −22 | 21 | 8.1 |
| Multisensory convergence zoneb | ||||||||
| Claustrum | −36 | −25 | 3 | 11.2 | 36 | −8 | 2 | 6.9 |
| Superior temporal lobe | −61 | −8 | 0 | 10.9 | 64 | −10 | −3 | 4.9 |
| Insula | −38 | −1 | −12 | 7.4 | 30 | 21 | −1 | 5.0 |
| Amygdala | −26a | −3 | −15 | 6.1 | 24a | −3 | −15 | 5.8 |
| Motor cortex | ||||||||
| Precentral gyrus | −57 | −10 | 41 | 8.8 | 50a | −7 | 45 | 6.4 |
| Language system | ||||||||
| Wernicke's area | −59 | −34 | 18 | 8.6 | ||||
| Broca's area | −46 | 10 | 1 | 8.1 | ||||
| Oculomotor circuit/visuospatial attentional system | ||||||||
| Frontal eye field | −50 | −1 | 50 | 8.4 | 50 | 8 | 44 | 6.1 |
| DLPFC | −42 | 35 | 35 | 4.3 | none | |||
| Orbital frontal cortex | −34 | 18 | −21 | 5.0 | 22 | 17 | −14 | 10.2 |
| Parietal eye field | −28 | −55 | 58 | 3.9 | none | |||
| Superior parietal lobule | −18a | −41 | 70 | 4.0 | 2 | −57 | 64 | 5.1 |
| Inferior parietal lobule | −61 | −37 | 30 | 6.7 | 55 | −35 | 35 | 5.1 |
| Supplementary eye field | −8 | −1 | 61 | 8.0 | 8 | 9 | 59 | 5.0 |
| Cingulate cortex, anterior | −8 | 41 | 3 | 6.7 | 4 | 34 | 26 | 5.1 |
| Midcingulate | −6 | −5 | 50 | 7.2 | 8 | −8 | 39 | 4.9 |
| Medial frontal cortex | −8 | 12 | 51 | 7.2 | 2 | 26 | 47 | 4.8 |
| Pulvinar | −18 | −29 | 5 | 9.8 | 14 | −27 | 7 | 8.2 |
| Caudate | −16 | 21 | −4 | 6.9 | 16 | 17 | −8 | 8.9 |
| Putamen | −30 | −15 | 10 | 10.2 | 22 | 12 | 1 | 7.7 |
| Superior colliculus | −6a | −29 | 0 | 6.4 | 6a | −29 | 0 | 5.8 |
| Substantia nigra | −12a | −22 | −6 | 7.2 | 14a | −20 | −7 | 6.9 |
| Cerebellar hemisphere | −26 | −40 | −27 | 8.4 | 20 | −44 | −25 | 9.1 |
| Cerebellar vermis | −4 | −55 | −11 | 8.9 | ||||
| Others | ||||||||
| Bed nucleus of stria terminalis | −6 | 8 | 1 | 11.2 | 8 | 6 | 3 | 7.0 |
| Retrosplenial cortex | none | 4 | −46 | 12 | 10.5 | |||
| Globus pallidus | −24a | −12 | −3 | 10.4 | 20a | −12 | −3 | 9.3 |
| Fusiform gyrus | −18 | −55 | −7 | 9.9 | 36 | −51 | −14 | 7.9 |
| Lateral geniculate body | −24a | −25 | −2 | 7.9 | 26a | −22 | −4 | 8.7 |
| Parahippocampal gyrus | −20 | −39 | −5 | 7.8 | 22 | −32 | −19 | 7.4 |
| Nucleus accumbens | −12a | 13 | −7 | 4.5 | 10 | 7 | −12 | 5.1 |
This table shows Talairach coordinates and t values of peak height voxels (more than 4 mm apart from each other, in a cluster with 5 or more contiguous voxels). t = 6.4 corresponds to P = 0.05, corrected for multiple comparison by controlling family wise error rate; t = 3.5 uncorrected P = 0.001. These are the result of the ‘random effects’ analysis of all 24 studies. For midline, unpaired structures, only one set of values is provided. “none” means no activation at uncorrected P < 0.001.
Manually chosen, thus, may not be peak height voxels.
Multisensory convergence zone also includes parietal eye field, precentral motor cortex, cingulate cortex, superior colliculus, and pulvinar [Calvert and Thesen, 2004].
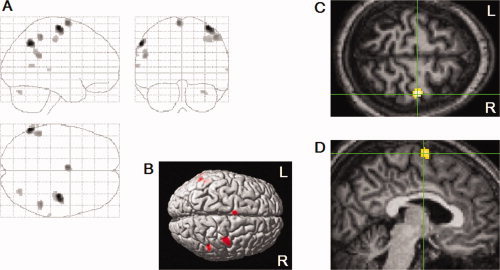
To study the neural correlates of REMs, we estimated hemodynamic changes following REMs with respect to an implicit baseline using rapid event‐related Blood Oxygenation Level Dependent (BOLD) functional MRI (fMRI) [Burock et al., 1998] (see Fig. 1). In separate experiments, we validated the timing of REMs from video recording by comparing it with the timing from electrooculogram (EOG) recording. We also confirmed that the method we used can detect signal changes related to events as frequent as REMs (up to 4 per second in this study) by performing an event‐related fMRI study of auditory‐cued finger‐tapping timed to the occurrence of REMs.
Figure 1.
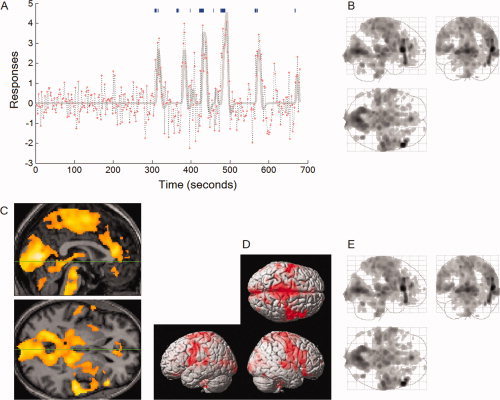
Event‐related and REM‐density‐based analyses on the same scan (3c in Table 1). In this scan we obtained fMRI data as soon as REMs were recognized by video‐monitoring, but the first 5.1 min did not have noticeable REMs. This first 5.1 min without REMs were excluded from the analyses and the remaining 6.2‐min section with REMs entered analyses. Significance was thresholded at uncorrected P < 0.001 (T = 3.1) and additionally at a spatial extent of >5 contiguous voxels. All images were spatially normalized. (A) Time‐series of the maximally significant voxel activated in association with REMs (dotted line) and the model used in the event‐related analysis (solid line). From the timing of 43 REMs (blue, vertical bars), we predicted the time course of fMRI signal (solid line), then saw which voxels match this predicted time course using the general linear model. (B–D) shows those matching voxels. (B) Areas of activation within orthogonally oriented ‘glass brain’. (C) Median sagittal and axial views (3c in Fig. 5 for the images thresholded higher at corrected P > 0.05.). Green lines show location of the other views. (D) Projected onto the surface rendering of a template brain. (E) REM‐density‐based analysis on the same scan.
MATERIALS AND METHODS
Participants
Eleven healthy participants (5 females, mean age 24, range 19–37, 9 right‐handed) (Table I) gave written informed consent and joined the study, which was approved by the Johns Hopkins Medicine IRB. Each participant slept two consecutive nights in the MRI scanner from about 11pm until they woke in the morning. One participant could not fall asleep, and withdrew. Two other participants were not included in the analysis: One had unusually large and frequent, jerky head movements during the scan; we had difficulty timing REMs in the other.
Table I.
Participant and REM characteristics
| Participant | Age | Sex | Analyzed sleep durationa | REM countb | Inter‐scan intervalc | |
|---|---|---|---|---|---|---|
| 1 | 25 | M | 20.0 | 230 | ||
| 2 | 19 | F | 27.3 | 389 | ||
| 3 | a | 28 | F | 14.6 | 174 | |
| b | 12.1 | 108 | 5 months | |||
| c | 6.2 | 43 | 17 months | |||
| d | 13.6 | 189 | 19 months | |||
| 4 | a | 37 | M | 22.1 | 105 | |
| b | 10.8 | 103 | 20.9 h | |||
| 5 | a | 20 | M | 33.3 | 192 | |
| b | 29.1 | 156 | 2.1 h | |||
| c | 17.7 | 283 | 25.5 h | |||
| d | 28.4 | 324 | 27.7 h | |||
| e | 20.5 | 334 | 6 months | |||
| 6 | a | 22 | F | 12.0 | 76 | |
| b | 11.4 | 122 | 23.4 h | |||
| c | 23.2 | 309 | 26.1 h | |||
| 7 | 24 | F | 16.6 | 236 | ||
| 8 | a | 22 | M | 22.7 | 154 | |
| b | 25.7 | 337 | 23.4 h | |||
| c | 7.8 | 70 | 25.3 h | |||
| 9 | 23 | M | 26.2 | 417 | ||
| 10 | 23 | F | 9.0 | 76 | ||
| 11 | a | 25 | M | 13.2 | 170 | |
| b | 16.4 | 223 | 2.1 h |
Data Acquisition
Several aspects of MRI scanning hinder studies of sleep: (a) MRI scanning creates a loud noise; (b) MRI disrupts measuring eye movement with EOG; (c) Head restraints suppress REM sleep. We addressed these technical problems by (a) habituating the participant by playing recorded fMRI noise throughout the night; (b) detecting REMs using a video‐camera; (c) studying each participant on two consecutive nights, as REM sleep deprivation builds ‘REM pressure’ over two nights and stimulates REM sleep. In six studies, we were able to conduct successful scans only in the second night.
Right before the subject lay on the MRI scanner bed, we gave the following instruction to each subject: “Blink your eyes a few times if you are awake for longer than one minute. If you continue to be awake blink a few times every one minute.” Video and sound monitoring was useful to determine if subjects were asleep: video monitoring showed slow drifting eye movements, which is a sign of light sleep; breathing sound and snoring could also be monitored. Video monitoring of the whole body showed twitching of facial muscles, fingers and toes, which is a characteristic sign of REM sleep.
We obtained fMRI data as soon as REMs were recognized by video‐monitoring, and for as long as they continued. MRI data were acquired at the F.M. Kirby Research Center for Functional Brain Imaging at Kennedy Krieger Institute. A 1.5 Tesla scanner was used for the earlier studies and a 3.0 Tesla scanner for the later studies. 1.5 Tesla data were acquired using a Philips Gyroscan scanner, using single‐shot gradient‐echo Echo‐Planar Imaging (EPI). The fMRI imaging parameters were TR/TE/flip angle = 2000/35/90, 20 slices (parallel to the AC‐PC line), slice thickness = 6 mm (no gap), matrix size = 64 × 64. The field of view was 240 mm, resulting in a nominal in‐plane resolution of 3.75 × 3.75 mm. For all functional runs, the signal was allowed to reach a steady state over four initial volumes that were excluded from the analysis. 3.0 Tesla data were collected on a Philips 3 T Gyroscan Intera scanner, using a multi‐element receiver coil to allow partial parallel imaging. SENSE EPI was used. Parameters were: TR/TE/flip angle = 2000/30/90; 36 slices (no gap); nominal resolution = 3.75 × 3.75 × 3.75 mm; SENSE factor = 2.0. Anatomical images were obtained using a T1‐Fast Spin Echo sequence for one participant and Magnetization Prepared Rapid Gradient Echo (MP‐RAGE) for all others.
Using the video‐recording, REMs were timed by visual inspection by one of us (CC‐HH). This was carried out three times for verification. REM timings that were within 0.5 s from other assignments were averaged and entered the analysis; if none were within the 0.5 s range REM timing data were excluded from analysis.
The fMRI time series were synchronized with the video recording as following: Beeps were introduced into the video recording at the time of acquisition of the first of the 36 slices; the beeps repeat every 2 s as TR was 2 s (Supplementary Movie). For earlier studies, the sound of the last fMRI volume acquisition recorded on the video tape was used for the synchronization.
Data Analysis
Data were analyzed using SPM2. Data were slice‐time‐corrected, realigned (after masking out the eyes), spatially normalized, and spatially smoothed using a 6 × 6 ×6‐mm full‐width half‐maximum Gaussian kernel. A high‐pass frequency filter (128 s) and a correction for temporal autocorrelation were applied to the time series. Individual events (REMs) were modeled by a standard (γ‐variate‐based) synthetic hemodynamic impulse response function, added linearly over events (Fig. 1A). We used the general linear model to generate parameter estimates of event‐related activity at each voxel for each scan. Then, we ran ‘random effects’ analysis on the results of the twenty‐four individual scans obtained from eleven participants (Table I) to generalize the results.
Three short scans (7.6, 9.2, and 9.3 min in duration) that showed little activation in areas other than occipital cortex and thalamus at corrected P < 0.05 (SPM99) were excluded from the analyses. Two additional scans (14.1 and 7.9 min in duration) that showed grossly different regional pattern of deactivation were also excluded. The first 3.5–8 min of five scans did not have noticeable REMs and were excluded from the analyses. When a large head movement occurred near the end (two scans) or the beginning (one scan), the data segment containing the movement was excluded from analysis. Data up to about 14 s after the last REM were included in the analysis.
To evaluate laterality of activations, we used a voxel‐based comparison method [Stevens et al., 2005] to assess hemispheric differences. This approach compares signals in each left‐right pair of all voxels in the whole brain, in each of the 24 scans, and then uses a one‐sample t‐test to assess overall laterality.
To compare with our event‐related analysis, we performed the REM‐density‐based analysis that was used by the other fMRI study examining the neural correlates of REMs [Wehrle et al., 2005]. We counted REMs in each consecutive 3s (TR in their study) bin, created a boxcar regressor and convolved the regressor with the hemodynamic impulse response function. Then, we used the general linear model to generate parameter estimates of REM‐density‐related activity at each voxel for each scan.
Finger Tapping Timed After Occurrence of REMs
The finger tapping study was intended to test the ability of the method we used, event‐related fMRI analysis, to discern neural correlates of behavior occurring as frequently as REMs. We obtained fMRI data of 10 min duration while a participant (number 8) conducted left‐handed finger tapping auditorilly cued and timed after occurrence of REMs (recorded previously on a healthy male). Images were acquired and analyzed in the same manner as for the sleep studies.
RESULTS
Table I gives participant characteristics, duration of sleep scan analyzed, and number of REMs for each scan. Table II reports significant findings in the group data, presenting Talairach coordinates and t values of the peak height voxels chosen by SPM2 (otherwise, marked as ‘manually chosen’). As the significant activation is so widespread, Table II concerns the local peaks.
Rapid Eye Movements During Sleep
Most rapid eye movements during sleep (REMs) appear in bursts (Figs. 1A and 2). Sixty‐four percent of intervals between REMs were less than 2 s, 37% less than 1 s and most commonly between 0.4 and 0.8 s (24%) (see Fig. 2).
Figure 2.
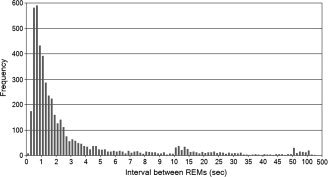
Interval between REMs. Data were pooled from all 24 scans (4,820 REMs in total).
REM‐Locked Activation Consistent With the Hypothesis That REMs are Visually Targeted Saccades
Areas activated in association with REMs overlapped extensively with the cortical and subcortical brain circuit involved in eye movements and visuospatial attention in wakefulness (Fig. 3C). We also found REM‐locked activation in TRN (Fig. 4C,E), ‘visual claustrum’ (Fig. 4C,E), RSC (only on the right hemisphere, Fig. 4G), fusiform gyrus (Fig. 3L), anterior cingulate cortex (Fig. 3C), superior colliculi (Fig. 3C) and insula (Fig. 3C).
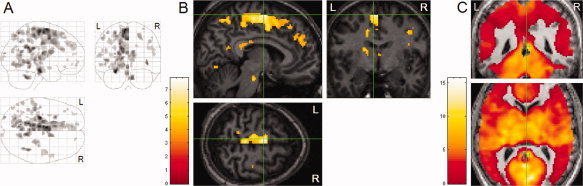
Figure 3.
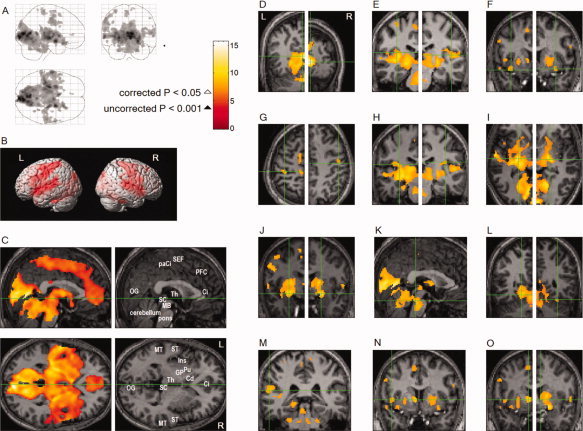
Brain regions activated in association with REMs: Random effects analysis (n = 24, one sample t‐test). All images were spatially normalized. (A; D to O) corrected P < 0.05, (corrected for multiple comparisons by controlling familywise error rate, T = 6.4, ▵); (B and C) thresholded at uncorrected P < 0.001 (T = 3.5, ▴); an additional spatial extent threshold of five contiguous voxels was applied. (A) Areas of activation within orthogonally oriented ‘glass brain’. (B) Projected onto surface rendering of a template brain. (C) Upper row shows median sagittal views, lower row axial views. Green lines show location of the other views. Ci: anterior cingulate gyrus, Cd: head of caudate nucleus, GP: globus pallidus, Ins: insula, MB: midbrain, MT: middle temporal gyrus, OG: occipital gyrus, paCi: paracingulate gyrus, PFC: medial prefrontal cortex, Pu: putamen, SC: superior colliculus, ST: superior temporal gyrus, Th: thalamus. (D to O) Coronal views unless specified otherwise; green crosshairs denote identified area: See Table II for Talairach coordinates and t values. (D) Visual cortex (right: whole brain peak). (E) Auditory cortex. (F) Olfactory (piriform) cortex. (G) Somatosensory cortex (postcentral gyrus). Axial view. (H) Vestibular cortex. (I) TRN. Axial view. (J) Basal forebrain (substantia innominata). (K) Mesopontine tegmentum. Sagittal view. (L) Fusiform gyrus. (M) Wernicke's area. (N) Broca's area. (O) Bed nucleus of stria terminalis.
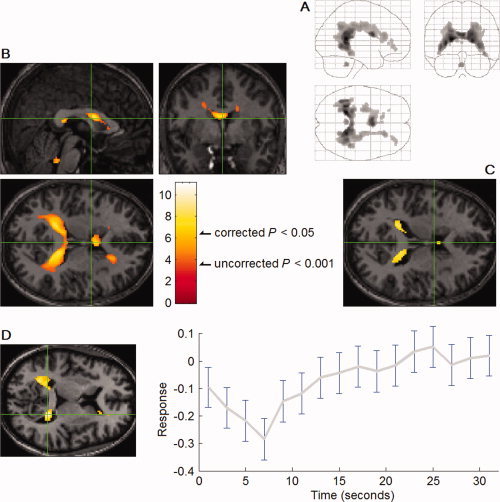
Figure 4.
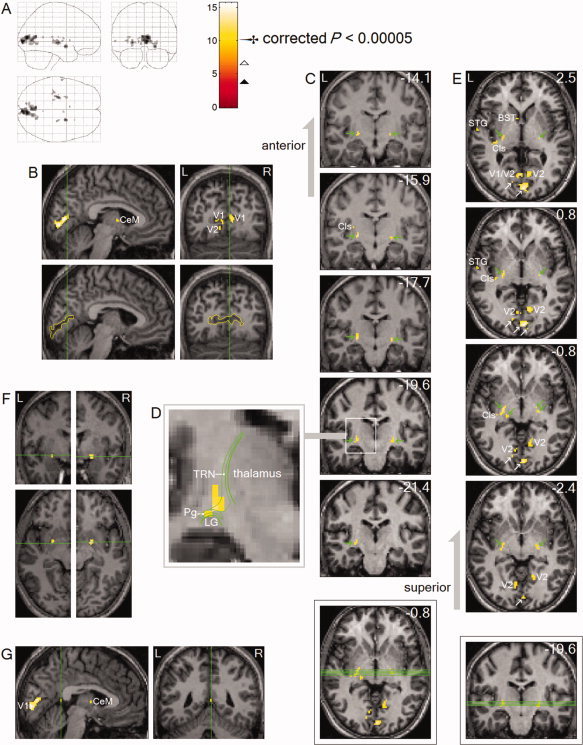
Peak REM‐locked activations (n = 24, one sample t‐test). Thresholded higher at corrected P < 0.00005 (T = 10.1,
 ) to show only peak activations. Peaks were clearly localized in striate cortex (the primary visual cortex, V1), V2, TRN, claustrum (Cls, the posterior‐ventral region, i.e., the putative visual zone), substantia inominata, superior temporal gyrus (STG), central medial thalamic nucleus (CeM, a part of intralaminar/midline group), RSC, and bed nucleus of stria terminalis (BST). Green lines on the axial and coronal views inside the boxes show locations of the serial coronal and axial views shown in C and E, respectively. Green lines in B, F and G show locations of the other views. All images were spatially normalized. (A) Areas of activation within orthogonally oriented ‘glass brain’. (B) These sagittal and coronal views clearly show the boundary of the striate cortices, traced with yellow lines. (C) Coronal views show the boundaries of thalamus and dorsal lateral geniculate nucleus (LG). Arrows indicate TRN. The numbers in mm denote distance from the AC. (D) Diagram of a magnified coronal section showing TRN, Pg and LG. TRN is a thin, disc‐shaped structure wrapping the thalamus and dorsal LG. The part wrapping dorsal LG is called peri(or pre‐)geniculate nucleus (Pg) and also known as ‘visual TRN’. TRN and Pg could not be precisely identified on the MRI images. Their approximate location and shape were determined from the boundaries of thalamus and LG that were identifiable on the MRI images. (E) Axial views. White arrows indicate the striate cortex; green arrows indicate TRN. The peak activations overlap three separate visual system nuclei, the ventral TRN, Pg, ‘visual claustrum’ and possibly dorsal‐most LG. The numbers in mm denote distance from the AC‐PC plane. (F) Substantia inominata, bilaterally. These clusters overlap the cholinergic basal nucleus projecting to the posterior neocortices, including visual cortex. See Table II for Talairach coordinates and t values. (G) RSC, on the right hemisphere.
Evidence for Extensive Sensory‐Perceptual/Binding Mechanism Engagement Associated With REMs
Interestingly, robust REM‐locked activation occurred throughout the ascending reticular activating system (Fig. 3I–K; Fig. 4F), as well as postcentral somatosensory (Fig. 3B,G), auditory (Fig. 3E), olfactory (piriform) (Fig. 3F), and vestibular cortices (Fig. 3H). REM‐locked activation also occurred in claustrum (Fig. 4C,E), precentral motor cortex (Fig. 3B), and language system (Fig. 3M,N).
Within‐Subject Analysis on Individual Scans
Within‐subject analysis on each of the 24 individual scans (see Fig. 5), even the shortest (6.2 min with only 43 REMs, 3c in Table I) (see Fig. 1), clearly identified activation in almost all regions of interest listed in Table II. All of the 24 scans show similar regional pattern of REM‐locked activation and remarkable consistency in the location of local peaks (see Fig. 5). For some scans, the threshold was lowered to reveal the similar regional activation pattern. For example, the image with a higher threshold in 3c of Figure 5 shows the local peaks only, but the image with a lower‐threshold in Figure 1 B,C reveals the similar regional pattern of activation.
Figure 5.
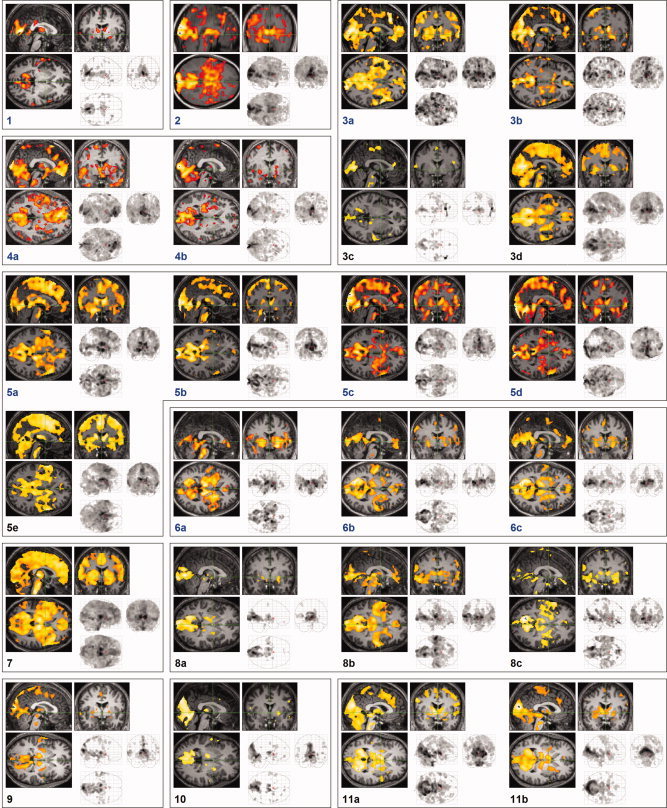
Activation in association with REMs in all 24 scans. Labels same as shown in Table 1; Some participants had more than one scan (scans labeled chronologically in alphabet as in Table 1). 3.0 T scans were thresholded at corrected P > 0.05 and 1.5 T scans (scan numbers shown in blue) were thresholded lower at uncorrected P > 0.05 to display that the regional pattern of the REM‐locked activation is similar in all scans. All scans were thresholded additionally at a spatial extent of <5 contiguous voxels for all scans.
Hemispheric Differences in REM‐Locked Activation
Four thousand nine hundred and seventy five left/right voxel pairs showed a hemispheric difference (P < 0.001): 4,190 had greater signal in the left hemisphere and 785 greater in the right (see Fig. 6). The largest cluster, with 2,011 voxels, was in the left medial frontal cortex and paracentral lobule (peak heights in left supplementary eye field (SEF) at Talairach coordinate [−6, −3, 61], t = 7.9, and in the posterior part of motor cortex at [−8, −16, 58], t = 7.4). The whole brain peak [−6, −3, 61] was located in the upper part of the paracentral sulcus, the sulcal landmark of the human SEF [Müri, 2006]. The second largest cluster, with 828 voxels, was around the left subiculum (peak height at [−26, −20, −16], t = 7.6). The robust REM‐locked activation in the RSC on the right hemisphere (t = 10.5) contrasted dramatically with the adjacent pocket of no activity corresponding to the RSC on the left hemisphere (Fig. 6C).
Figure 6.
Hemispheric differences in REM‐locked activation (n = 24, one sample t‐test). (A, B) Voxels with greater REM‐locked activity compared to its pair in the other hemisphere are shown. All images are thresholded at uncorrected P < 0.001 (T = 3.5) and additionally at a spatial extent of >5 contiguous voxels. Top part of the brain was excluded from analysis, as we failed to obtain fMRI data from there in some of the 24 scans. (A) Orthogonally oriented ‘glass brain’ views. (B) Whole brain peak (supplementary eye field in the left hemisphere). Green lines show location of the other views. (C) RSC. Threshold was reduced to uncorrected P < 0.5 (t = 0) to show the pocket of no activity that corresponds with the RSC on the left hemisphere, which dramatically contrasts with the adjacent robust activation on the right hemisphere (t = 10.5, indicated by the crosshair). Upper panel shows coronal view, lower axial view. Lines indicate the midsagittal plane.
REM‐Locked Periventricular Signal Decreases
Surprisingly, BOLD signal decreases, time‐locked to REMs, occurred around the lateral (t = 11.1 at the peak on the left, 9.4 on the right), the third (t = 2.7 at the peak), and the fourth ventricles (t = 5.7 at the peak) (in 24, 7, and 17 of 24 studies at corrected P < 0.05, respectively) (Figs. 7 and 8).
Figure 7.
fMRI signal decreases in association with REMs (n = 24). (A) Orthogonally oriented ‘glass brain’ views. (B, C) Green lines show location of the other views. All images were spatially normalized. In A and B, significance was thresholded at uncorrected P < 0.001 (T = 3.5) and additionally at a spatial extent of >5 contiguous voxels; C, Thresholded higher at P < 0.05 (T = 6.4) to show that the deactivation centers around walls of the lateral ventricle. Because of the partial volume effect and the applied smoothing there is spillover into ventricular CSF and white matter: the extent of the spillover approximates the size of the voxel (3.75mm) and the 6 mm smoothing kernel. (D) The averaged time course of the signal change in relation to the occurrence of REMs at the location shown on the left. Participant 3, the 4th scan. It clearly shows the delay to the trough.
Figure 8.
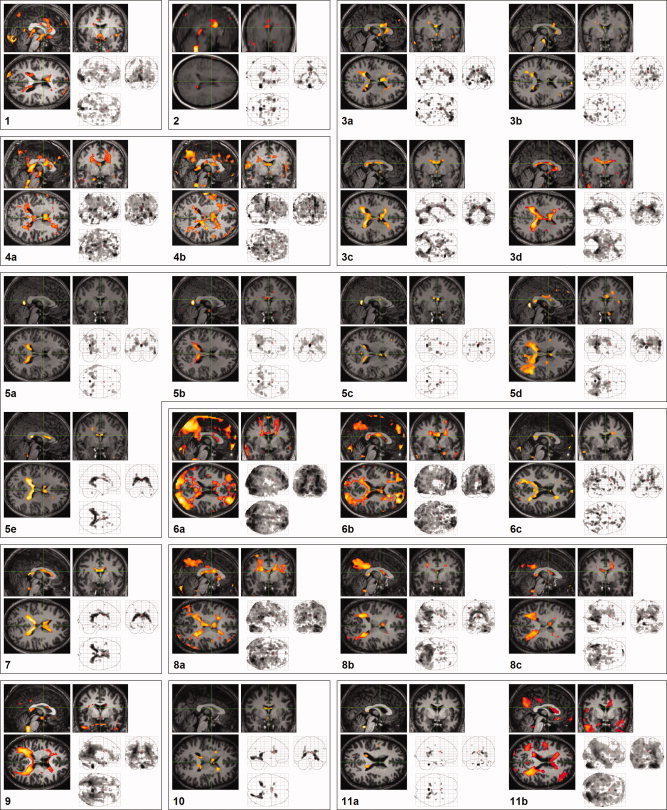
Periventricular signal decreases in association with REMs in all 24 scans. Labels same as shown in Table 1; Some participants had more than one scan (a, b, c, d, e labeled chronologically). Thresholded at uncorrected P > 0.05 and additionally at a spatial extent of >5 contiguous voxels.
Comparison of the Event‐Related Analysis With the REM‐Density‐Based Analysis
The results of our event‐related analysis (Fig. 1B) was almost identical with the results of the REM‐density‐based analysis (Fig. 1E). REM‐locked signal decreases assessed by this different analysis were also almost identical.
Video Recording Versus EOG
Separate out‐of‐magnet studies confirmed that each of five subjects was in REM sleep defined by EEG, EMG, and EOG, whenever REMs were identified by video monitoring. In one of those studies, we compared REM timings derived from EOG and video recording, which were in excellent agreement (see Fig. 9).
Figure 9.
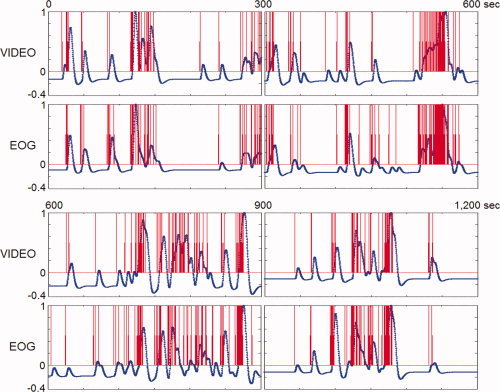
Timing of REMs using video‐recording versus EOG. Eye movements were timed from video‐recording and EOG that were obtained simultaneously in an out‐of‐magnet study (shown in red), then convolved with hemodynamic function (shown in blue). The hemodynamic impulse response had a six‐second latency. There are five data points in one second. Regardless of the method of timing eye movements (video‐recording, EOG, or other), the step right before correlation with fMRI data is to convolve with hemodynamic function. Therefore, these common end products (the curve derived from video‐recording and the curve from EOG‐recording, both shown in blue) were used in comparing video and EOG methods. Correlation between those two curves was highly significant (r s = 0.84; P < 0.00005).
Finger Tapping Timed After Occurrence of REMs
Contralateral precentral motor cortex and ipsilateral supplementary motor area were clearly localized (see Fig. 10).
Figure 10.
fMRI of left‐handed finger tapping auditorilly cued and timed after occurrence of REMs (up to 5/s). Significance was thresholded at P < 0.05 (corrected for multiple comparisons by controlling familywise error rate) and additionally at a spatial extent of >5 contiguous voxels. (A) Areas of activation within orthogonally oriented ‘glass brain’. (B) Projected onto the surface rendering of a template brain. (C) Contralateral precentral motor cortex (Talairach coordinate 38, −12, 61, t = 9.0). Axial view. (D) Ipsilateral supplementary motor area (Talairach coordinate −4, −1, 66, t = 7.2). Sagittal view. All images were spatially normalized.
DISCUSSION
We employed a new method to detect and time REMs and report novel findings about the neural correlates of REMs. Although many of the areas of activation that we found were generally consistent with previous PET, magnetoencephalography (MEG), or fMRI studies of the neural correlates of REMs [Hong et al., 1995; Ioannides et al., 2004; Peigneux et al., 2001; Wehrle et al., 2005], new areas of activation were discovered including TRN, claustrum, non‐visual sensory cortices, motor cortex, language system, basal forebrain, superior temporal gyrus, RSC, and fusiform gyrus. The present and previous studies found REM‐associated activations in visual cortex [Hong et al., 1995; Ioannides et al., 2004; Peigneux et al., 2001; Wehrle et al., 2005], frontal eye field [Hong et al., 1995; Ioannides et al., 2004], SEF [Ioannides et al., 2004; Peigneux et al., 2001], dorsolateral prefrontal cortex (DLPFC) [Hong et al., 1995], superior parietal lobule [Hong et al., 1995], anterior cingulate cortex [Hong et al., 1995; Peigneux et al., 2001], orbitofrontal cortex [Hong et al., 1995; Ioannides et al., 2004], thalamus [Peigneux et al., 2001; Wehrle et al., 2005], putamen [Wehrle et al., 2005], amygdala [Ioannides et al., 2004], midbrain [Peigneux et al., 2001; Wehrle et al., 2005], pons, [Ioannides et al., 2004] and lateral geniculate nucleus [Peigneux et al., 2001]. Compared to the previous fMRI REM study [Wehrle et al., 2005] we found more robust and distributed REM‐locked activations, probably because of the following differences in methodology. They used EOG followed by filtering out MRI scanner artefacts to detect REMs, whereas, we used video monitoring; REM counts differed, 2.9/min in their study versus 11.0/min in this study (we detected approximately four times as many REMs). Their fMRI data acquisition sampling period was 3 s (vs. 2 s here). They also applied intermittent sound stimuli that were found to suppress REMs [Wehrle et al., 2005], which could confound any conclusions about the neural correlates of REMs.
As the REM‐locked activation is so widespread, our discussion focuses on the local peaks (Table II, Figs. 3 and 4). Distributed activation is a significant and specific characteristic of the REM‐locked fMRI signals: (a) The same methodology highly selectively and accurately identified the neural structures involved in finger tapping (see Fig. 10). (b) The overall pattern of REM‐locked activation and the locations of peaks were consistent across all scans. (c) A PET study also revealed REM‐associated diffuse activation [Hong et al., 1995]. Widespread activation has also been observed using multivariate exploratory analyses during rest ('default mode') [Greicius et al., 2003; Raichle et al., 2001] and during movie watching [Bartels and Zeki, 2004], but it is unique that our study found such widespread activations using univariate inferential analysis.
REMs May Be Visually Targeted Saccades
REM‐locked activation in the oculomotor/attentional circuit, TRN, ‘visual claustrum’, RSC, fusiform gyrus, anterior cingulate, and superior colliculus is consistent with the hypothesis that REMs may be visually targeted saccades. TRN may control the “attentional search light” during visual scanning [Crick, 1984; McAlonan et al., 2006]. Visual TRN neurons are topographically organized, with fast (25 ms latency) and brief (66 ms duration) responses [McAlonan et al., 2006], suitable for attentional and other processing that is associated with scanning eye movements that occur as frequently as 4 per second. Robust REM‐locked activation occurred in the postero‐ventral region of the claustrum, known to be connected to visual cortex [for review, see Crick and Koch, 2005]. RSC is responsive to scene layout [Epstein and Higgins, 2007] and involved in spatial navigation [for review, see Maguire, 2001; Harker and Whishaw, 2004]. fMRI study showed activation in fusiform gyrus during viewing of faces and objects [Haxby et al., 2001]. REM‐locked activation in the RSC and fusiform gyrus suggests that they are involved in viewing scenes, faces, and objects in dreaming as well as in waking imagery [O'Craven and Kanwisher, 2000] and perception. REM‐locked activation occurred in both ‘affective’ and ‘cognitive’ divisions of the anterior cingulate cortex [Bush et al., 2000], involved in selecting information for action on the basis of a pre‐existing plan [Pardo et al., 1990; Posner et al., 1988]. The anterior cingulate may play a similar role in dreaming, selecting visual targets for scanning under affective and cognitive influence. REM‐associated activation of the superior colliculi suggests that REMs are visually targeted [Leigh and Zee, 2006]. The insula was activated during non‐targeted [Petit et al., 1996] and targeted [Perry and Zeki, 2000] waking saccades.
These findings are consistent with the revised scanning hypothesis which implies that REMs are visually targeted saccades and proposes that REMs scan what we ‘see’ when dreaming [Hong et al., 1995]. The original scanning hypothesis concerns a correspondence between the direction of REM and gaze linked to movements of objects or the dreamer in dreaming, e.g., upward REMs corresponding to glancing up at every step while walking up the steps in dreaming [Herman et al., 1984; Roffwarg et al., 1962]. The revised scanning hypothesis [Hong et al., 1995] adds scanning of stationary objects and proposes that as in waking [Yarbus, 1967], the scanning is a fast (3–4 eye movements per second) process that is typically performed automatically and not associated with awareness of gaze direction. This typical unawareness of gaze direction would cause difficulty with determining gaze direction from dream reports, thus difficulty with confirming the directional correspondence between REMs and dream contents that was proposed by the original scanning hypothesis [Hong et al., 1997]. The revised scanning hypothesis would be impossible to confirm using dream reports, as such verbal reports cannot provide pictorial dream images of sufficient detail and accuracy to be compared with REM scanpaths. There is inherent difficulty with testing the directional or the scanpath correspondence between REMs and dream content. Thus, we did not intend to test the scanning hypothesis.
We also note that correspondence between REMs and dream content does not necessarily indicate that REMs are scans of the dream scene. Waking imagery studies [Brandt and Stark, 1997; Laeng and Teodorescu, 2002] showed that the scanpaths (repetitive sequences of fixations and saccades) during visual perception are highly correlated to those during visual imagery of the same visual object; they presented evidence that oculomotor information is stored together with the visual representation and is used as a spatial index for the proper arrangement of parts of an image during image generation. Likewise, in dreaming REMs may reenact the scanpath eye movements in waking visual perception of the same object or scene and retrieve the visual representation encoded together with the scanpath. Review of numerous reports of patients with loss of dreaming after brain damage showed a consistent trend in lesion site and implicated the posterior left hemisphere as critical for the image generation component of dream imagery [Farah, 1984]. REM‐locked activation was greater in the posterior left hemisphere in our study (see Fig. 6). This finding is consistent with the hypothesis that REMs may play a role in dream image generation.
Hemispheric Differences
The greatest hemispheric difference in REM‐associated activation occurred in the SEF (left greater than right). Dominance of the left hemisphere in the SEF activation was observed during sequential saccades in wakefulness whether they are self‐paced [Grosbras et al., 1999], visually‐guided [Grosbras et al., 2001], or memory‐guided [Gaymard et al., 1993], but not in single memory‐guided saccades [Gaymard et al., 1993]. These findings indicate that the left SEF plays a greater role in sequencing saccade programming during visual scanning in wakefulness. Dramatic hemispheric difference in REM‐locked activation occurred in the RSC: robust activation on the right contrasting with adjacent pocket of no activation on the left. This finding attests to the superb capacity of our method to localize REM‐locked activation. Most lesion studies showed that the RSC on the right hemisphere is involved in topographic orientation or spatial navigation, but most brain imaging studies showed bilateral activation [for review, see Maguire, 2001], which may be seen as failure to detect the lateralization. RSC is relatively small and the right and the left RSCs border each other.
Shared Sensori‐Perceptual/Binding Mechanisms
Parallels between our findings and those from waking studies suggest that waking and dreaming sensory‐perceptual mechanisms are extensively shared. REM‐locked activation occurred in multisensory convergence zones identified in waking studies [Calvert and Thesen, 2004]. REM‐locked fMRI signal increase overlaps spatially and temporally with the 40 Hz or gamma oscillations observed using other methods: gamma activity is higher during REM sleep with eye movements than REM sleep without eye movements [Gross and Gotman, 1999; Jouny et al., 2000]. REM‐locked activation overlaps with the brain systems displaying or potentiating gamma oscillations, i.e., the thalamocortical sensory system [Llinas and Ribary, 1993], mesopontine tegmentum [Steriade et al., 1991] and basal forebrain [Mesulam, 2004; Perry and Perry, 2004; Szymusiak, 1995]. Combined fMRI and intra‐cranial electrophysiological recordings in animals [Logothetis et al., 2001; Niessing et al., 2005] and humans [Lachaux et al., 2007] revealed spatio‐temporally tight coupling between synchronized gamma oscillations and BOLD signals. Gamma oscillations are reported to be induced or reset by all forms of external sensory stimuli during wakefulness [Engel and Singer, 2001; Gross and Gotman, 1999; Llinas and Ribary, 1993; Tallon‐Baudry and Bertrand, 1999]; while in REM sleep they are induced by only internal stimuli [Llinas and Ribary, 1993]. Spatially distributed, synchronous gamma oscillations have been proposed to mediate ‘binding’ of multiple sensory data into a unified object representation both in wakefulness [Engel and Singer, 2001] and dreaming [Llinas and Ribary, 1993]. Anatomy and organization of TRN and claustrum led Crick and Koch to choose those as candidate neural structures critical to binding information distributed within and across different sensory and motor modalities [Crick, 1984; Crick and Koch, 2005]. The robust REM‐locked activation overlapping both TRN and claustrum lends further credence to our proposal that REMs are associated with recruitment of the binding mechanism.
Activation in non‐visual primary sensory cortices time‐locked to REMs, presumed visual events, also parallels waking study findings that indicate ‘priming’ of the primary visual cortex by non‐visual sensory stimuli [Calvert and Thesen, 2004]. ‘Priming’ of the non‐visual cortices by visual stimuli is also plausible. We speculate that the REM‐locked activation in non‐visual primary sensory cortices reflect priming preceding perception, as the early ‘evoked’ gamma response following a sensory stimulus in wakefulness [Tallon‐Baudry and Bertrand, 1999]. Like this early gamma response, REM‐locked BOLD signal increases in the olfactory or somatosensory cortex does not correspond to concurrent perceptual experience; people rarely smell [Zadra et al., 1998] or feel touch [McCarley and Hobson, 1979] in dreaming.
REM‐locked activation was the most (and extraordinarily) robust at the primary visual cortex and TRN. We speculate that TRN plays a key role in the ‘priming’ (preparation in anticipation) of non‐visual sensory and motor cortices induced by internal or external visual stimuli, linked to REMs in dreaming or to scanning eye movements in waking, perhaps for faster detection and response. All axons passing between thalamus and cortex traverse TRN where many give off collaterals; TRN has distinct sectors (visual, auditory, somatosensory, motor); TRN consists largely of neurons whose dendrites spread extensively within the plane of the nucleus, in contrast with most thalamic nuclei [Crick, 1984; Guillery et al., 1998]. Activation of the non‐visual sensory sectors in TRN responding to visual stimuli is a testable hypothesis. To our knowledge, activation in non‐visual sensory cortex and TRN associated with eye movements or visual stimuli has never been observed in waking brain activation studies (except auditory cortex activation associated with waking eye movements observed in a MEG study [Ioannides et al., 2004]), probably because the thalamocortical sensory system is frequently interrupted by external sensory stimuli [Engel and Singer, 2001; Gross and Gotman, 1999; Llinas and Ribary, 1993; Tallon‐Baudry and Bertrand, 1999] irrelevant to the aim of the study. REM sleep may be an ideal state to study internal sensory mechanisms because much of the external sensory input to the brain is blocked in REM sleep.
An H2 15O PET study [Braun et al., 1998] reported REM‐associated deactivation in the striate cortex, but a MEG [Ioannides et al., 2004] study reported activation in the striate cortex time‐locked to REMs. fMRI [Wehrle et al., 2005] and 18Fluorodeoxyglucose PET [Hong et al., 1995] studies also reported REM‐associated activation in the occipital cortex that appeared to include the striate cortex. Our group analysis showed clear localization of extremely robust activation in the striate cortex time‐locked to REMs. Furthermore, whereas the O15‐PET study result was based on one correlational analysis across subjects, our within‐subject analyses on 24 independent scans showed robust activation of the striate cortex in each of the 24. Our findings resolve the controversy and confirm the REM‐locked activation in the striate cortices.
Robust REM‐locked activation occurred in the substantia innominata, a heterogeneous area of the basal forebrain containing the cholinergic basal nucleus, profoundly affected in some dementia syndromes [Mesulam, 2004; Perry and Perry, 2004; Szymusiak, 1995]. The basal forebrain cholinergic system can induce 40‐Hz synchronization and regional enhancement of cortical sensory processing [Mesulam, 2004; Perry and Perry, 2004; Szymusiak, 1995]; its neurons increase firing in REM sleep, especially during REM bursts [Szymusiak, 1995].
Finally, REM‐associated activation in the language areas is consistent with the proposal from waking studies [Tallon‐Baudry and Bertrand, 1999] that oscillatory gamma activity that underlies the bottom‐up sensory integration is also used to construct object representations driven by internal, top‐down processes.
REM‐locked activation in the pons, lateral geniculate nucleus, and occipital cortex is consistent with a process similar to the ponto‐geniculo‐occipital (PGO) wave [Callaway et al., 1987] reported in animal models.
Periventricular Signal Decreases
REM‐associated periventricular signal decreases occurred only in specific subregions matching the distribution of the serotonergic supraependymal plexus [Paspalas et al., 1994; Richards et al., 1981] on the ventricular wall; during REM sleep, firing of serotonergic neurons [Hobson et al., 1983] and serotonin release into CSF are reduced [Zeitzer et al., 2002]. The REM‐locked periventricular signal decrease merits further study, as it may provide a fMRI window into the serotonergic system.
While motion artefacts are sometimes seen around ventricles in fMRI studies, these REM‐associated decreases in fMRI signals are likely real: (a) Latency of decreases was approximately equal to latency of occipital cortical activation (r s = 0.78, P < 0.02, n = 12); no delays are associated with motion artefacts. (b) Decreases occurred only around ventricular walls, and in the lateral ventricle only on the dorsal part (see Fig. 7); motion artefacts would occur both on the cortical surface and on the ventral part of the lateral ventricle as well. (c) Around the dorsal wall of the lateral ventricle, no REM‐associated signal increases were found (Fig. 6C); motion artefacts cause both increases and decreases. (d) Periventricular decreases were found in all participants and all scans (see Fig. 8); motion artefacts would not show such consistency. (e) No head movements associated with REMs were revealed by video‐monitoring (see Supplementary movie).
Tight coupling between the fMRI BOLD signal decreases and neuronal activity decreases has been reported [Shmuel et al., 2006]. We propose that REM‐locked fMRI signal decreases are coupled with serotonergic deactivation. However, there are alternative hypotheses: (a) Ventricular compression might cause periventricular signal decreases, as CSF signals were higher than those from brain tissue. (b) Increased intraventricular pressure associated with REMs [Pierre‐Kahn et al., 1978] may decrease periventricular perfusion and blood volume, thus decrease signal. (c) Increased CSF flow associated with REMs [Kadowaki et al., 1995] may decrease signal inside ventricles and cerebral aqueducts. (d) pCO2 correlates closely with cerebral blood flow [Klingelhöfer et al., 1995]. Periventricular fMRI signal decrease may be explained by hemodynamic changes linked to pCO2, but it is unlikely that such changes are time‐locked to REMs and localized to periventricular areas. (e) Firing rates of serotonergic neurons plunge in REM sleep (0–1 per second in raphe) [Hobson et al., 1983], allowing little room for phasic decreases associated with REMs. However, some serotonergic cells, e.g., in mesopontine reticular formation [Hobson et al., 1983], maintain firing rates in REM sleep; The number of firing cells may also affect fMRI signal and be reduced in association with REMs.
Methodological Issues
The capacity of our method to localize the REM‐locked activation was obviously superb as shown in Fig. 4B. The peak of the REM‐locked activation was clearly localized to the striate cortex. The sensitivity and specificity of our method at the individual scan level is demonstrated by our shortest scan that identified within‐subject activation in all regions reported as activated in the group data. Among previous studies, only the MEG study [Ioannides et al., 2004] reported within‐subject findings.
We timed REMs from visual inspection of video recording. The object of measurement, eye movement, is fundamentally the same for video‐monitoring and EOG, the most commonly used method for monitoring eye movements; Whereas, video‐monitoring enables direct measurement of eye movements, EOG measures current induced when the positively‐charged anterior pole of the eye moves toward or away from the EOG electrode. As rapidly changing magnetic fields during MRI jumble the EOG signal, MRI data collection must be halted intermittently for EOG data collection. Otherwise, EOG requires a filter to remove MRI scanner artefacts [Wehrle et al., 2005], reducing the number of eye movements detected; small amplitude eye movements are especially affected. Video monitoring reveals even small eye movements (under the closed eye lids), important as small and large eye movements may have almost the same effect on fMRI signal [Kimmig et al., 2001]. Video‐recording is a less expensive, more convenient, and less intrusive tool for use in fMRI studies.
Polysomnograph (electroencephalograph, electromyograph and EOG), the standard procedure to define REM sleep episode, is unnecessary for our study, as we intend to study the neural correlates of REMs, not of REM sleep episode. Identification of REMs alone, either by EOG or video monitoring, establishes REM sleep at the time of the occurrence of REMs.
Most REMs occur in bursts and have very short interval between them. If events occur at shorter, fixed intervals in event‐related fMRI, hemodynamic response overlap across events can diminish the ability to detect signal changes. It was demonstrated, however, that randomization of intervals between events can largely overcome this limitation and allows extremely rapid presentation rates for event‐related fMRI experiments [Burock et al., 1998]. In our study, intervals between events (REMs) are not fixed, but randomized naturally (not artificially). Indeed, finger tapping timed after occurrence of REMs clearly identified the controlling neural systems. Furthermore, it should be noted that REM‐density‐based analysis produced results almost identical to those of our randomized, rapid event‐related analysis (Fig. 1B,E).
Future Studies
REMs may serve as a natural, task‐free probe to enable simultaneous assessment of major brain systems, even in persons with movement disorders (as muscle tone is greatly reduced in REM sleep, reducing head motion which can create fMRI artefacts) and in persons who cannot participate in conventional waking brain imaging studies, including cognitively impaired persons and infants. Our approach allows within‐subject analysis, i.e., study of the neural correlates of REMs and its correlation with other variables measured within an individual. Thus, our approach may make possible detection of image‐based biomarkers of a brain disease and longitudinal studies. Longitudinal studies on children from right after their birth may provide valuable neurodevelopmental data. To fulfil these expectations, standardization of the current approach is required.
CONCLUSION
We used BOLD fMRI and video monitoring of the eyes to reveal neural correlates of REMs including the oculomotor circuit, thalamocortical sensory system, language system, cholinergic, and possibly serotonergic system. For fMRI studies, timing of REMs by direct visual inspection is superior to timing by EOG. To our knowledge, these are the first reports of REM‐associated activation in TRN, non‐visual sensory cortices, motor cortex, language system, basal forebrain, claustrum, superior temporal gyrus, RSC, and fusiform gyrus and of REM‐associated signal decreases in periventricular areas matching the distribution of the serotonergic supraependymal plexus. Our findings resolve the controversy and confirm the REM‐locked activation in the striate cortices. Our findings suggest that the sharing in waking and dreaming goes beyond the expected visual scanning mechanism; it extends to the distributed sensory‐perceptual processing of the visual information obtained by the scanning. Studies on the neural correlates of REM may provide insight on waking sensori‐perceptual mechanisms.
Supporting information
Additional Supporting Information may be found in the online version of this article.
Supporting Information Movie 1
Acknowledgements
The authors thank N. Perry, K. Kahl, and T. Brawner for scanning; R. Abi‐Raad for the out‐of‐magnet polysomnographic studies; H. Lu for discussions; J. Hong and A. Lasker for statistical analysis; and D. Hong for comments on the manuscript and preparation of a figure. P.C.M. van Zijl is a paid lecturer for Philips Medical Systems. This arrangement has been approved by Johns Hopkins University in accordance with its conflict of interest policies.
REFERENCES
- Bartels A,Zeki S ( 2004): The chronoarchitecture of the human brain–natural viewing conditions reveal a time‐based anatomy of the brain. Neuroimage 22: 419–433. [DOI] [PubMed] [Google Scholar]
- Beauchamp MS,Petit L,Ellmore TM,Ingeholm J,Haxby JV ( 2001): A parametric fMRI study of overt and covert shifts of visuospatial attention. Neuroimage 14: 310–321. [DOI] [PubMed] [Google Scholar]
- Brandt SA,Stark LW ( 1997): Spontaneous eye movements during visual imagery reflect the content of the visual scene. J Cogn Neurosci 9: 27–38. [DOI] [PubMed] [Google Scholar]
- Braun AR,Balkin TJ,Wesensten NJ,Gwadry F,Carson RE,Varga M,Baldwin P,Belenky G,Hescovitch P ( 1998): Dissociated pattern of activity in visual cortices and their projections during human rapid eye movement sleep. Science 279: 91–95. [DOI] [PubMed] [Google Scholar]
- Burock MA,Buckner RL,Woldorff MG,Rosen BR,Dale AM ( 1998): Randomized event‐related experimental designs allow for extremely rapid presentation rates using functional MRI. NeuroReport 9: 3735–3739. [DOI] [PubMed] [Google Scholar]
- Bush G,Luu P,Posner MI ( 2000): Cognitive and emotional influences in anterior cingulate cortex. Trends Cogn Sci 4: 215–222. [DOI] [PubMed] [Google Scholar]
- Callaway CW,Lydic R,Baghdoyan HA,Hobson JA ( 1987): Pontogeniculooccipital waves: Spontaneous visual system activity during rapid eye movement sleep. Cell Mol Neurobiol 7: 105–149. [DOI] [PubMed] [Google Scholar]
- Calvert GA,Thesen T ( 2004): Multisensory integration: Methodological approaches and emerging principles in the human brain. J Physiol Paris 98: 191–205. [DOI] [PubMed] [Google Scholar]
- Corbetta M,Akbudak E,Conturo TE,Snyder AZ,Ollinger JM,Drury HA,Linenweber MR,Petersen SE,Raichle ME,Van Essen DC,Shulman GL ( 1998): A common network of functional areas for attention and eye movements. Neuron 21: 761–773. [DOI] [PubMed] [Google Scholar]
- Crick F ( 1984): Function of the thalamic reticular complex: The searchlight hypothesis. Proc Natl Acad Sci USA 81: 4586–4590. [DOI] [PMC free article] [PubMed] [Google Scholar]
- Crick FC,Koch C ( 2005): What is the function of the claustrum? Philos Trans R Soc B Bio Sci 360: 1271–1279. [DOI] [PMC free article] [PubMed] [Google Scholar]
- Engel AK,Singer W ( 2001): Temporal binding and the neural correlates of sensory awareness. Trends Cogn Sci 5: 16–25. [DOI] [PubMed] [Google Scholar]
- Epstein RA,Higgins JS ( 2007): Differential parahippocampal and retrosplenial involvement in three types of visual scene recognition. Cereb Cortex 17: 1680–1693. [DOI] [PubMed] [Google Scholar]
- Farah MJ ( 1984): The neurological basis of mental imagery: A componential analysis. Cognition 18: 245–272. [DOI] [PubMed] [Google Scholar]
- Finke RA ( 1980): Levels of equivalence in imagery and perception. Psychol Rev 87: 113–132. [PubMed] [Google Scholar]
- Gaymard B,Rivaud S,Pierrot‐Deseilligny C ( 1993): Role of the left and right supplementary motor areas in memory‐guided saccade sequences. Ann Neurol 34: 404–406. [DOI] [PubMed] [Google Scholar]
- Gitelman DR,Parrish TB,Friston KJ,Mesulam M‐M ( 2002): Functional anatomy of visual search: Regional segregations within the frontal eye fields and effective connectivity of the superior colliculus. Neuroimage 15: 970–982. [DOI] [PubMed] [Google Scholar]
- Greicius MD,Krasnow B,Reiss AL,Menon V ( 2003): Functional connectivity in the resting brain: A network analysis of the default mode hypothesis. Proc Natl Acad Sci USA 100: 253–258. [DOI] [PMC free article] [PubMed] [Google Scholar]
- Grosbras MH,Lobel E,van de Moortele PF,LeBihan D,Berthoz A ( 1999): An anatomical landmark for the supplementary eye fields in human revealed with functional magnetic resonance imaging. Cereb Cortex 9: 705–711. [DOI] [PubMed] [Google Scholar]
- Grosbras MH,Leonards U,Lobel E,Poline J‐B,LeBihan D,Berthoz A ( 2001): Human cortical networks for new and familiar sequences of saccades. Cereb Cortex 11: 936–945. [DOI] [PubMed] [Google Scholar]
- Gross DW,Gotman J ( 1999): Correlation of high‐frequency oscillations with the sleep‐wake cycle and cognitive activity in humans. Neuroscience 94: 1005–1018. [DOI] [PubMed] [Google Scholar]
- Guillery RW,Feig SL,Lozsádi DA ( 1998): Paying attention to the thalamic reticular nucleus. Trends Neurosci 21: 28–32. [DOI] [PubMed] [Google Scholar]
- Harker KT,Whishaw IQ ( 2004): A reaffirmation of the retrosplenial contribution to rodent navigation: Reviewing the influences of lesion, strain and task. Neurosci Biobehav Rev 28: 485–496. [DOI] [PubMed] [Google Scholar]
- Haxby JV,Gobbini MI,Furey ML,Ishai A,Schouten JL,Pietrini P ( 2001): Distributed and overlapping representations of faces and objects in ventral temporal cortex. Science 293: 2425–2430. [DOI] [PubMed] [Google Scholar]
- Herman JH,Erman M,Boys R,Peiser L,Taylor ME,Roffwarg HP ( 1984): Evidence for a directional correspondence between eye movements and dream imagery in REM sleep. Sleep 7: 52–63. [DOI] [PubMed] [Google Scholar]
- Hobson JA,McCarley RW,Nelson JP ( 1983): Location and spike‐train characteristics of cells in anterodorsal pons having selective decreases in firing rate during desynchronized sleep. J Neurophysiol 50: 770–783. [DOI] [PubMed] [Google Scholar]
- Hong CCH,Gillin JC,Dow BM,Wu J,Buchsbaum MS ( 1995): Localized and lateralized cerebral glucose metabolism associated with eye movements during REM sleep and wakefulness: A positron emission tomography (PET) study. Sleep 18: 570–580. [DOI] [PubMed] [Google Scholar]
- Hong CCH,Potkin SG,Antrobus JS,Dow BM,Callaghan GM,Gillin JC ( 1997): REM sleep eye movement counts correlate with visual imagery in dreaming: A pilot study. Psychophysiology 34: 377–381. [DOI] [PubMed] [Google Scholar]
- Ioannides AA,Corsi‐Cabrera M,Fenwick PBC,Rio Portilla Y,Laskaris NA,Khurshudyan A,Theofilou D,Shibata T,Uchida S,Nakabayashi T,Kostopoulos GK ( 2004): MEG tomography of human cortex and brainstem activity in waking and REM sleep saccades. Cereb Cortex 14: 56–72. [DOI] [PubMed] [Google Scholar]
- Jouny C,Chapotot F,Merica H ( 2000): EEG spectral activity during paradoxical sleep: Further evidence for cognitive processing. NeuroReport 11: 3667–3671. [DOI] [PubMed] [Google Scholar]
- Kadowaki C,Hara M,Numoto M,Takeuchi K,Saito I ( 1995): CSF shunt physics: Factors influencing inshunt CSF flow. Childs Nerv Syst 11: 203–206. [DOI] [PubMed] [Google Scholar]
- Kimmig H,Greenlee MW,Gondan M,Schira M,Kassubek J,Mergner T ( 2001): Relationship between saccadic eye movements and cortical activity as measured by fMRI: Quantitative and qualitative aspects. Exp Brain Res 141: 184–194. [DOI] [PubMed] [Google Scholar]
- Klingelhöfer J,Hajak G,Matzander G,Schulz‐Varszegi M,Sander D,Rüther E,Conrad B ( 1995): Dynamics of cerebral blood flow velocities during normal human sleep. Clin Neurol Neurosurg 97: 142–148. [DOI] [PubMed] [Google Scholar]
- Kosslyn SM ( 1994): Image and Brain: The Resolution of The Imagery Debates. Cambridge: MIT Press. [Google Scholar]
- Lachaux J‐P,Fonlupt P,Kahane P,Minotti L,Hoffmann D,Bertrand O,Baciu M ( 2007): Relationship between task‐related gamma oscillations and BOLD signal: New insights from combined fMRI and intracranial EEG. Hum Brain Mapp 28: 1368–1375. [DOI] [PMC free article] [PubMed] [Google Scholar]
- Laeng B,Teodorescu D‐S ( 2002): Eye scanpaths during visual imagery reenact those of perception of the same visual scene. Cogn Sci 26: 207–231. [Google Scholar]
- Leigh RJ,Zee DS ( 2006): The saccadic system; synthesis of the command for conjugate eye movements In: Leigh RJ,Zee DS, editors. The Neurology of Eye Movements. Oxford: Oxford University Press; pp 108–187,261–314. [Google Scholar]
- Llinás R,Ribary U ( 1993): Coherent 40‐Hz oscillation characterizes dream state in humans. Proc Natl Acad Sci USA 90: 2078–2081. [DOI] [PMC free article] [PubMed] [Google Scholar]
- Logothetis NK,Pauls J,Augath M,Trinath T,Oeltermann A ( 2001): Neurophysiological investigation of the basis of the fMRI signal. Nature 412: 150–157. [DOI] [PubMed] [Google Scholar]
- Maguire EA ( 2001): The retrosplenial contribution to human navigation: A review of lesion and neuroimaging findings. Scand J Psychol: 42: 225–238. [DOI] [PubMed] [Google Scholar]
- McAlonan K,Cavanaugh J,Wurtz RH ( 2006): Attentional modulation of thalamic reticular neurons. J Neurosci 26: 4444–4450. [DOI] [PMC free article] [PubMed] [Google Scholar]
- McCarley RW,Hobson JA ( 1979): The form of dreams and the biology of sleep In: Wolman BB, editor. Handbook of Dreams: Research, Theories and Applications. New York: Van Nostrand Reinhold Company; pp 76–130. [Google Scholar]
- Mesulam M‐M ( 2004): The cholinergic innervation of the human cerebral cortex. Prog Brain Res 145: 67–78. [DOI] [PubMed] [Google Scholar]
- Müri RM ( 2006): MRI and fMRI analysis of oculomotor function. Prog Brain Res 151: 503–526. [DOI] [PubMed] [Google Scholar]
- Niessing J,Ebisch B,Schmidt KE,Niessing M,Singer W,Galuske RAW ( 2005): Hemodynamic signals correlate tightly with synchronized gamma oscillations. Science 309: 948–951. [DOI] [PubMed] [Google Scholar]
- O'Craven KM,Kanwisher N ( 2000): Mental imagery of faces and places activates corresponding stimulus‐specific brain regions. J Cogn Neurosci 12: 1013–1023. [DOI] [PubMed] [Google Scholar]
- Pardo JV,Pardo PJ,Janer KW,Raichle ME ( 1990): The anterior cingulate cortex mediates processing selection in the Stroop attentional conflict paradigm. Proc Natl Acad Sci USA 87: 256–259. [DOI] [PMC free article] [PubMed] [Google Scholar]
- Paspalas CD,Papadopoulos GC,Michaloudi H ( 1994): Serotonergic supraependymal plexus in the ventricular system of the hedgehog: organization principles and functional implications. J Brain Res 35: 333–342. [PubMed] [Google Scholar]
- Peigneux P,Laureys S,Fuchs S,Delbeuck X,Degueldre C,Aerts J,Delfiore G,Luxen A,Maquet P ( 2001): Generation of rapid eye movements during paradoxical sleep in humans. Neuroimage 14: 701–708. [DOI] [PubMed] [Google Scholar]
- Perry EK,Perry RH ( 2004): Neurochemistry of consciousness: Cholinergic pathologies in the human brain. Prog Brain Res 145: 287–299. [DOI] [PubMed] [Google Scholar]
- Perry RJ,Zeki S ( 2000): The neurology of saccades and covert shifts in spatial attention: An event‐related fMRI study. Brain 123: 2273–2288. [DOI] [PubMed] [Google Scholar]
- Petit L,Orssaud C,Tzourio N,Crivello F,Berthoz A,Mazoyer B ( 1996): Functional anatomy of a prelearned sequence of horizontal saccades in humans. J Neurosci 16: 3714–3726. [DOI] [PMC free article] [PubMed] [Google Scholar]
- Pierre‐Kahn A,Hirsch JC,Renier D,Hirsch JF ( 1978): Étude des relations de la pression intra‐cranienne et du sommeil paradoxal chez le chat (Study of the relationship between intracranial pressure and paradoxical sleep in the cat). Neurochirugie 24: 251–255. [PubMed] [Google Scholar]
- Posner MI,Petersen SE,Fox PT,Raichle ME ( 1988): Localization of cognitive operations in the human brain. Science 240: 1627–1631. [DOI] [PubMed] [Google Scholar]
- Raichle ME,MacLeod AM,Snyder AZ,Powers WJ,Gusnard DA,Shulman GL ( 2001): Inaugural Article: A default mode of brain function. Proc Natl Acad Sci USA 98: 676–682. [DOI] [PMC free article] [PubMed] [Google Scholar]
- Richards JG,Lopez HP,Colombo VE,Guggenheim R,Kiss D,Wu JY ( 1981): Demonstration of supra‐ependymal 5‐HT nerve fibres in human brain and their immunohistochemical identification in rat brain. J Physiol Paris 77: 219–224. [PubMed] [Google Scholar]
- Roffwarg HP,Dement WC,Muzio JN,Fisher C ( 1962): Dream imagery: relationship to rapid eye movements of sleep. Arch Gen Psychiatry 7: 235–258. [DOI] [PubMed] [Google Scholar]
- Roland PE,Friberg L ( 1985): Localization of cortical areas activated by thinking. J Neurophysiol 53: 1219–1243. [DOI] [PubMed] [Google Scholar]
- Shmuel A,Augath M,Oeltermann A,Logothetis NK ( 2006): Negative functional MRI response correlates with decreases in neuronal activity in monkey visual area V1. Nat Neurosci 9: 569–577. [DOI] [PubMed] [Google Scholar]
- Steriade M,Dossi RC,Paré D,Oakson G ( 1991): Fast oscillations (20‐40 Hz) in thalamocortical systems and their potentiation by mesopontine cholinergic nuclei in the cat. Proc Natl Acad Sci USA 88: 4396–4400. [DOI] [PMC free article] [PubMed] [Google Scholar]
- Stevens MC,Calhoun VD,Kiehl KA ( 2005): Hemispheric differences in hemodynamics elicited by auditory oddball stimuli. Neuroimage 26: 782–792. [DOI] [PMC free article] [PubMed] [Google Scholar]
- Szymusiak R ( 1995): Magnocellular nuclei of the basal forebrain: Substrates of sleep and arousal regulation. Sleep 18: 478–500. [DOI] [PubMed] [Google Scholar]
- Tallon‐Baudry C,Bertrand O ( 1999): Oscillatory gamma activity in humans and its role in object representation. Trends Cogn Sci 3: 151–162. [DOI] [PubMed] [Google Scholar]
- Wehrle R,Czisch M,Kaufmann C,Wetter TC,Holsboer F,Auer DP,Pollmächer T ( 2005): Rapid eye movement‐related brain activation in human sleep: A functional magnetic resonance imaging study. NeuroReport 16: 853–857. [DOI] [PubMed] [Google Scholar]
- Yarbus AL. 1967. Eye movements and vision. New York: Plenum Press. [Google Scholar]
- Zadra AL,Nielsen TA,Donderi DC ( 1998): Prevalence of auditory, olfactory, and gustatory experiences in home dreams. Percept Mot Skills 87: 819–826. [DOI] [PubMed] [Google Scholar]
- Zeitzer JM,Maidment NT,Behnke EJ,Ackerson LC,Fried I,Engel J Jr,Wilson CL ( 2002): Ultradian sleep‐cycle variation of serotonin in the human lateral ventricle. Neurology 59: 1272–1274. [DOI] [PubMed] [Google Scholar]
Associated Data
This section collects any data citations, data availability statements, or supplementary materials included in this article.
Supplementary Materials
Additional Supporting Information may be found in the online version of this article.
Supporting Information Movie 1