

Abstract
The first detection of breast cancer micrometastases in lymph nodes by infrared spectral imaging and methods of multivariate analysis is reported. Micrometastases are indicators of early spread of cancer from the organ originally affected by disease, and their detection is of prime importance for the staging and treatment of cancer. Infrared spectral imaging, at a spatial resolution of ca. 10–12 μm, can detect small metastases down to the level of a few cancerous cells. The results presented here add to a rapidly growing database of infrared spectral imaging results for cancer diagnostics.
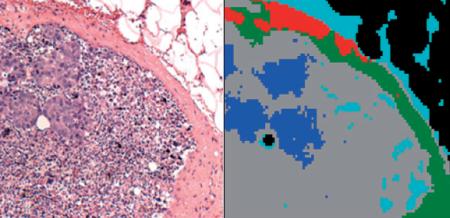
Microscopic image of a stained lymph node section, and a 5-cluster pseudo-color infrared image obtained from same section. The blue areas co-localize with the micro-metastases apparent in left Panel.
Keywords: Infrared Spectral Imaging, breast cancer micro-metastases, multivariate analysis, hierarchical cluster analysis, spectral diagnosis
1. Introduction
Many epithelial cancers that have breached the basement membrane of the epithelium and have reached an invasive stage of disease will metastasize to other organs within the body. In this process, individual cancer cells break free of the primary tumor and invade the rest of the body via the blood or lymphatic system. When such cells settle in other organs, such as the lymph nodes, they continue to divide rapidly and start to re-create their original tissue, albeit diseased, to the point where the architecture of the cancerous growth may resemble the original tissue structure. For example, breast cancer metastases in lymph nodes may exhibit the lobular structures of the original breast tissue.
The detection of early metastases, known as micro-metastases and measuring between 0.2 and 2 mm in size, or small clusters of cancerous cells in lymph nodes via standard histo-pathology is a formidable task owing to the small size and lack of distinguishing features of the abnormality within the tissue of a lymph node. Yet, the detection of these micro-metastases is of prime importance to stage the spread of disease: if a lymph node is found to be free of metastatic cells, it is thought that the spread of cancer has been contained. On the other hand, a false negative diagnosis, i.e., a missed micro-metastasis in a lymph node, presents too optimistic a diagnosis, and a more aggressive treatment should have been indicated.
The primary method for the detection of micro-metastases to date has been standard histo-pathology. Excised lymph node tissue, typically from the sentinel lymph node (the lymph node closest to the tumor), is either flash-frozen, cryo-sectioned and analyzed histo-pathologically, or dehydrated, paraffin-embedded, sectioned and analyzed histo-pathologically. Histo-pathology is carried out by staining the tissue section, typically with H&E (hematoxylin/eosin) stain, and inspecting it microscopically with 10 × to 40 × magnification, and comparing the observed images against visual databases in the pathologists memory. If micro-metastases are suspected, adjacent tissue sections may be stained with an immuno-histochemical agent/counter stain such as cytokeratin-specific stains [1]. Such methods increase the sensitivity of histo-pathology enormously, since normal lymph node tissue does not respond to these stains. Thus, the contrast between unaffected and diseased tissue can be enhanced. However, this procedure is more time consuming and costly, and still relies on the human eye for eventual detection.
We have developed methods, known as spectral histo-pathology (SHP), for the detection of abnormalities in lymph nodes and other tissues [2-4]. SHP represents a totally different approach to the analysis of tissue, as compared to classical (visual) histo-pathology. Whereas standard microscopic analysis of tissues utilizes visible light, a microscope and the human eye to detect morphological changes in tissues and cellular features, SHP uses spectroscopic methods to monitor changes in the biochemical composition of tissue caused by a variety of conditions and diseases. In particular, we utilize infrared micro-spectroscopy (IR-MSP) and suitable methods of multivariate analysis, to pinpoint micro-metastases and individual metastatic cells in lymph nodes. We found that IR-MSP is a particularly useful technique for medical diagnoses for the following reasons: spectra data can be acquired rapidly with excellent spectral quality, and the method is extremely sensitive to detect small compositional changes in tissue. Furthermore, the spatial resolution achievable is comparable to the size of a human cell, and commercial instruments incorporating large infrared array detectors exist that can collect ten thousand of pixel spectra in a few minutes’ time.
SHP can be implemented in a fully automated, machine based approach that does not require human intervention, and will exhibit the following advantages:
It relies on physical, instrument-based measurements that are objective, reproducible and amenable to mathematical/statistical analysis.
The diagnosis can be presented as a quantitative result, for example, a pseudo-color map highlighting tissue cancers, a match index to a known cancer standard, or a level of cell proliferation.
Computer/spectrometer-based diagnostic methods will eliminate problems due to operator fatigue or lack of training.
The impact of SHP will be particularly pronounced in the diagnosis, treatment and prognosis of breast cancer. This cancer frequently remains undetected until metastases have formed; therefore, axillary lymph nodes are excised routinely during lumpectomies and mastectomies to aid cancer identification and to stage the spread of disease. Thus, the analysis of lymph nodes is an area of utmost importance, since the degree to which they harbor cancerous cells determines the further surgical and radiation/chemotherapeutical treatment.
The aim of this paper is to demonstrate that SHP can easily detect micro-metastases, and, more importantly, can detect small clusters of metastatic cancer cells as small as a few individual cells.
2. Methods
2.1 Tissue Selection
Paraffin embedded tissue blocks of sentinel lymph nodes were obtained from the archival tissue depository at Tufts Medical Center (formerly New England Medical Center). The selected tissue blocks were known to have harbored micro-metastases, but it was not known a priori whether or not any of the tissue sections cut from a block would actually contain metastases, since even adjacent tissue sections may differ greatly in the amount of metastatic tissue.
Since cancerous cells migrate to the lymph nodes via lymphatic drainage of the primary tumor, they tend to first gain hold in the sub-capsular sinus, and sometimes in the capsule itself. Thus, micro-metastases are most likely found in the periphery of the lymph node. Consequently, the periphery of ca. 10 lymph nodes suspected of harboring micro-metastases was scanned as consecutive 1 × 1 mm images (see below). In total, over 30 images for a total number of spectra exceeding of a million of spectra were collected, and in two of the lymph nodes, metastases were found spectrally and confirmed histo-pathologically.
2.2 Tissue Preparation
Tissue sections for spectral data acquisition were cut at a thickness of ca. 5 μm and mounted on low-e microscope slides (Ag-coated glass slides that are transparent in the visible spectral range, but totally reflecting in the infrared). The sections were de-paraffinized and dried unstained. Stained histo-pathological slides from the original diagnosis were used to localize tissue anatomical features. Subsequent to infrared data acquisition, the tissue sections were stained, coverslipped, imaged and subject to histopathological analysis.
2.3 Data Acquisition
Infrared spectral maps were collected in transflection (transmission/reflection) mode using one of two Perkin Elmer (Shelton, CT) Spectrum 1/Spotlight 400 instruments that incorporate an 8 × 2 element focal plane array (FPA) detector system. Each of the photoconductive HgCdTe (MCT) detector elements in the array measures 25 × 25 μm in size, and operates at liquid nitrogen temperature. Images are collected by moving the sample in a raster pattern through the focal point of the infrared microscope. The sample motion is synchronized to the scan speed of the interferometer, which operates at 12.5 Hz. Thus, up to 200 individual pixel spectra can be measured per second. The area sampled by the microscope is de-magnified by a factor of 4 such that nominal coverage of a detector element corresponds to a tissue area of 6.25 × 6.25 μm, and the microscope stage is moved in increments of 6.25 μm. Each 1 × 1 mm infrared image therefore consists of 160 × 160 or 25,600 spectra. The spatial resolution of the microscope was calibrated using a special air force resolution target deposited on a low-e slide over a layer of polystyrene, and was found to be 12 μm at 1600 cm-1 [5].
To improve the signal-to-noise ratio of the spectra, 8 interferograms, collected at 4 cm-1 spectral resolution, were co-added before apodization and Fourier transformation. Total data acquisition time for each 1 mm2 image was about 40 minutes.
The entire instrument, as well as the microscope sample chamber, was continuously purged with dry air, keeping the relative humidity constant and below 5%, to eliminate water vapor contribution to the observed spectra.
2.4 Data Processing and Analysis
The raw hyperspectral imaging data sets consisted of 25,600 spectra, each containing 1650 spectral intensity points between 700 and 4000 cm-1. These data sets, occupying ca. 400 MByte each, were imported into and processed using the CytoSpec software package [6]. Data preprocessing included restriction of the wavenumber range to 800–1800 cm-1, imposition of a minimum intensity criterion for the integrated amide I band to eliminate pixels with no tissue coverage, vector normalization and conversion of the spectral vectors to second derivatives. Subsequently, data sets were subject individually to hierarchical cluster analysis (HCA), using the Euclidean distance [7] to define spectral similarity, and Ward’s algorithm [8] for clustering. Pixel cluster membership was converted to pseudo-color images which reproduce stained images very well, indeed (see below). Further analysis of spectral data, pre-sorted by HCA, to obtain a diagnostic algorithm (such as an artificial neural net (ANN) trained against classical histo-pathology) has been reported before [2, 9] for the detection of metastases in lymph nodes, but was not applied in the feasibility studies reported here.
3. Results
The difficulties associated with classical histo-pathological detection of micro-meta-stases can be gauged by inspection of Figure 1. Figure 1A depicts a photograph of a standard microscope slide with two stained and coverslipped sections of a lymph node. The left section has at its lower left corner a small, torn-off piece of tissue with a green mark next to it. Figure 1B shows a magnified view, and Figure 1C a microscopic view (at 10 ×magnification) of this tissue fragment, which measures about 1.8 mm in its largest dimension. The light pink areas of this fragment are due to the capsule, which is between 0.05 and 0.2 mm thick. This small piece contains several small micro-metastases, each measuring about 0.1 to 0.15 mm in the largest dimension. The rest of the tissue section is thought to be free of metastatic cancer.
Figure 1.

(online colour at: www.biophotonics-journal.org) A: Photograph of a standard microscope slide with two stained and coverslipped sections of a lymph node. B: Magnified view of left-most tissue piece, marked by a circle in (A). C: Microscopic view (at 10× magnification) of tissue fragment shown in (B)
A microscopic image of the right upper quadrant of this tissue section is shown in Figure 2A. The sponge-like appearance of the upper right of this figure is due to residual adipose tissue that was dissolved and more or less destroyed in the paraffination/de-paraffination process. The density of this portion of the tissue section is very low; consequently, it is eliminated from the data set in the data pre-processing step, and therefore, appears mostly as black areas in the HCA maps shown in Figures 2B—D and Figures 4B—D. These figures represent a series of spectral images obtained from the same spectral dataset, vector normalized in the 900–1800 cm-1 region, using different spectral ranges and cluster endpoints. The choice of spectral range used for analysis is particularly interesting. Conceptually, the “fingerprint” infrared spectral region between 900 and 1800 cm-1 can be further divided into a “protein region” between 1700 and 1450 cm-1, which is dominated by the amide I and amide II vibrational bands of the peptide linkages of proteins. This region is highly sensitive to different protein secondary and tertiary structure, and can be used to stage certain events in cell biology that depend on the abundance of different proteins [10, 11].
Figure 2.

(online colour at: www.biophotonics-journal.org) A: Microscopic image of the right upper quadrant of the tissue section shown in Figure 1C. B: 3-cluster spectral image, constructed via HCA in the 900–1350 cm-1 spectral range, of the unstained tissue section shown in (A). C: 5-cluster image obtained from same dataset. The blue areas co-localize with the micro-metastases apparent in (A). D: 9-cluster image obtained from same dataset.
Figure 4.

(online colour at: www.biophotonics-journal.org) A: Microscopic image of the right upper quadrant of the tissue section shown in Figure 1C. B: 3-cluster spectral image, constructed via HCA in the 900–1800 cm-1 spectral range, of the unstained tissue section shown in (A). C: 5-cluster image obtained from same dataset. The blue areas co-localize with the micro-metastases apparent in (A). D: 9-cluster image obtained from same dataset.
The lower wavenumber range, from 900 to 1350 cm-1 (the “phosphate region”), contains several vibrations of the phosphodiester linkage found in phospholipids, as well as DNA and RNA [12]. The intensities of these vibrations also are diagnostic for cellular event, and appear to vary between normal and cancerous states of cells and tissue. We have found that the analysis of the two spectral regions separately gives complimentary results [13], indicating that changes in the “phosphate region”, possibly caused by increased DNA and RNA abundance in a cell, are accompanied by concomitant changes in the protein composition, as indicated in the “protein region”. Here, we show HCA results obtained for the full fingerprint range (900–1800 cm-1), as well as for the phosphate region separately.
Figure 2 shows the HCA results obtained from the “phosphate region” (900 to 1350 cm-1) for various cluster endpoints. Figure 2B shows a spectral image obtained for a three cluster endpoint. The three tissue types being distinguished at this point are: adipose (blue), capsule (green) and lymphocytes/metastatic cancer (red). The shape of the green areas in this figure agree very well with the shape of the capsule shown as pink regions in Figure 2A. Since the remaining adipose tissue presents extremely weak spectra, they will not be discussed any further; suffice it to say that in native adipose tissue, very strong bands due to lipids and phospholipids are observed.
The mean spectra of the green and red tissue classes, corresponding to capsule and lymphocytes/metastatic cancer, respectively, are displayed in Figure 3. This Figure displays the entire fingerprint range; but for the cluster images shown in Figure 2, only the 900–1350 cm-1 range was used. In Figure 3, traces (A) show the (vector normalized) absorbance spectra in arbitrary intensity units, whereas traces (B) show the corresponding second derivative spectra. The capsule exhibits a triad of peaks in the amide III region (indicated by vertical black lines) characteristic of pure collagen, reflecting the main biochemical constituent found in the capsule. The cellular interior of the lymph nodes, i.e., the B lymphocytes in the primary and secondary lymphoid follicles, T lymphocytes in the paracortex centers and the breast cancer cells in the metastases are lumped together into one spectrum, and are not yet distinguished. The mean cluster spectra of capsule and the interior of the lymph node differ in the low frequency shoulders of the amide I and II vibrations (ca. 1620 and 1500 cm-1) and many smaller features in the phosphate region. These differences are particularly obvious in the second derivative spectra, shown in traces (B) of Figure 3.
Figure 3.
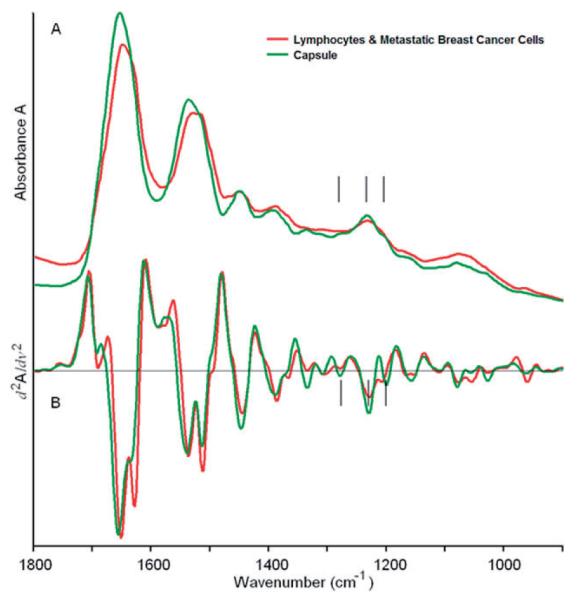
(online colour at: www.biophotonics-journal.org) Mean cluster spectra corresponding to the green (capsule) and red (lymphocytes/metastases) regions of Figure 2B. The spectra shown cover the entire 900 to 1800 cm-1 range, although only certain portions may have been used for analysis.
A: Mean absorption spectra, B: Mean second derivative spectra.
Figure 2C depicts a spectral image obtained for a 5-cluster endpoint. (Note that the colors assigned to clusters are not related to those of Figure 2B). In this image, the capsule and adipose tissue have remained unchanged and are still described by single clusters. However, the cellular interior of the lymph node is described by three separate clusters; the grey and green regions depict lymphocytes, and the micro-metastases are differentiated as blue.
More details on the interior of the lymph node can be obtained by increasing the clustering endpoint to 9 (Figure 2D). The shape of the micro-metastases does not change between Figures 2C and 2D, indicating that the spectral differences between cancerous and normal tissue are larger than the spectral differences that appear in the normal areas of the lymph node at 9 clusters. The salmon-, gray- and light green colored regions in Figure 2D are about 25 to 40 μm in size, and correspond to the heterogeneity of the sub-capsular sinus and cortex of the lymph node detectable in the visual image (Figure 2A). These structures are most likely due to lymphoid follicles and cortex, with further details in the areas of the follicles.
Figure 4 shows HCA results from the same spectral dataset, using the entire fingerprint spectral region (900–1800 cm-1). As before, at 3 clusters, the interior of the node, the capsule, and weak spectra of the remaining adipose tissue are distinguished (Figure 4B). At 5 clusters (Figure 4C), the micro-metastases are distinguished, but the sub-capsular sinus does not show any differentiation. As before (Figure 2C and D), the shape of the metastases stays the same for 5 and 9 clusters (Figure 4D). At 5 clusters, the interior of the lymph node is still homogeneous, but at 9 clusters, more detail in the normal areas of the lymph node is detected.
A comparison of the full range image and the “phosphate region only” image (Figures 4C and 2C, respectively) reveals that the overall shapes of the micro-metastases are similar, although the diseased areas are somewhat larger and more diffuse in the “phosphate-only” image. Furthermore, the image produced from the entire spectral range distinguishes a new component in the capsule (red area in Figure 4C), but shows less detail in the interior of the lymph node. Thus, it appears that the use of the entire spectral region detects variations in the protein components more readily, whereas the 900–1350 cm-1 region is more sensitive to cell differentiation, and onset of disease.
Figure 5 shows the spectral differences between the metastases and the normal areas of the lymph node at the level where the metastases are first detected (5 clusters, Figure 4C). These spectra differ mainly in the intensity of the 1620 cm-1 shoulder, visible in the second derivative spectra, and details in the phosphate region. Thus, it is not surprising that distinction between normal and cancerous sections is possible using the entire or the truncated spectral range. Although a biochemical interpretation of the results is not possible at this point, the multivariate analysis of the data sets produces pseudo-color images that match the histo-pathology, indicating that the morphological changes observed are accompanied by compositional changes of the cells that are detected by infrared spectral imaging.
Figure 5.
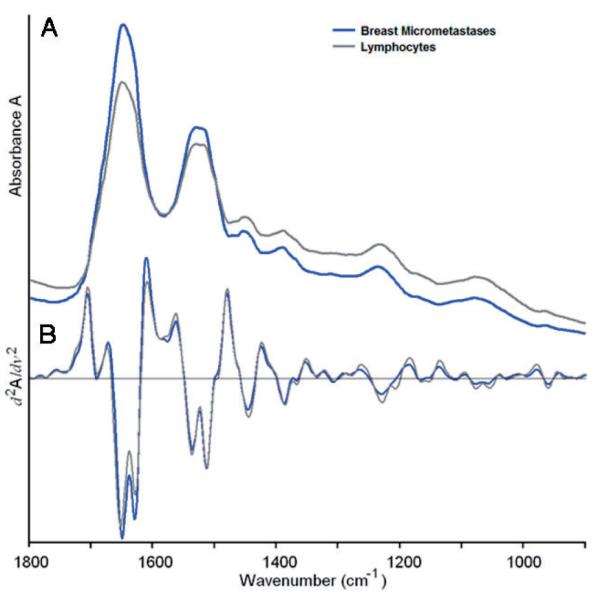
(online colour at: www.biophotonics-journal.org) Mean cluster spectra corresponding to the blue (micro-metastases) and gray/green (lymphocytes) regions of Figure 2C. The spectra shown cover the entire 900 to 1800 cm-1 range, although only certain portions may have been used for analysis.
A: Mean absorption spectra, B: Mean second derivative spectra.
Figure 6 shows an image from another 1 × 1 μm tissue section from a different lymph node. Figure A is the visual image (10× magnification) of the stained tissue. Figure B shows a semi-transparent overlay of the area that was identified by SHP to contain abnormal tissue. This overlay co-localizes extremely well with the changes in cell morphology detectable by visual inspection. Furthermore, the spectral image reveals very small clusters of cells, indicated by the white circle, which display the morphology of cancer cells, and were diagnoses as being cancerous by one of the co-authors, a trained histo-pathologist. In addition, immunohistochemical cytokeratin-specific stains were used for other tissue sections to aid in the positive identification of cancerous cells.
Figure 6.

(online colour at: www.biophotonics-journal.org) A: Visual image (10× magnification) of a stained tissue section of another lymph node harboring micro-metastases. B: Semi-transparent overlay of the area that was identified by SHP to contain abnormal tissue. The overlay co-localizes extremely well with the changes in cell morphology detectable by visual inspection. The spectral image reveals very small clusters of cells, indicated by the white circle, which display cancer cell morphology.
Finally, Figure 7 presents a comparison of the mean cluster spectra, vector normalized in the 900 to 1800 cm-1 region, from the micro-metastases shown in Figures 2 and 6. These spectra are very similar in the “phosphate region”, even in the amide II region up to about 1500 cm-1, but show significant differences at the high frequency shoulder of the amide I band. These changes are barely detectable in the original absorption spectra, but quite evident in the second derivative. Interestingly, such differences in the amide I band were not observed when lymph node sections still embedded in paraffin were analyzed [14], and we are lead to believe that these changes may result from the re-hydration procedure. This aspect needs to be considered when constructing diagnostic algorithms: the example shown here indicates that the wavenumber region below 1500 cm-1 are diagnostic for metastatic cells. However, large training databases are required before a reliable diagnostic algorithm can be established.
Figure 7.
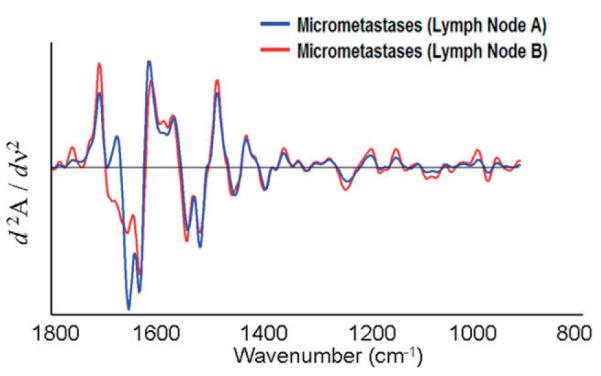
(online colour at: www.biophotonics-journal.org) Mean second derivative cluster spectra of the micro-metastases shown in Figures 2 and 7. The spectra shown cover the entire 900 to 1800 cm-1 range, although only certain portions may have been used for analysis.
4. Discussion
4.1 Supervised vs. unsupervised methods of data analysis
In Section 3, we present spectral imaging data sets analyzed by an unsupervised methods of multivariate statistics, hierarchical cluster analysis (HCA). “Unsupervised”, in this context, refers to methods of analysis that do not utilize reference, or “basis” spectral vectors obtained from areas of known histo-pathology. Instead, the differentiation of different tissue types, and metastatic cells from normal lymphocytes, is carried out strictly by establishing spectral similarities in one dataset, and displaying these similarities via a pseudo-color map. In principle, results from one tissue section are not transferable to another tissue section.
The effect of selecting the clustering end point is demonstrated in Figures 2 and 4. This step, at present, requires operator input, but the decision of the number of clusters to be used is not particularly stringent (see below). The fact that operator input is required for the selection of the clustering endpoint does not detract from the fact that the method is unsupervised (however, it still required operator interaction).
However, the results in Figure 7 demonstrate that the cancerous regions detected by HCA exhibit very similar spectral patterns in the “phosphate region”. This has been demonstrated before for colon adeno-carcinomas and breast cancer metastases [2, 9]. The similarity of the spectral patterns of cancerous regions from different patients, as well as the near-identical spectral patterns observed for the different normal lymph node tissue structures from different patients, suggest that the data may be processed by “supervised” methods of analysis. Various methods of supervised analysis exist [7]. In the past, we have used trained artificial neural nets (ANNs) to analyze spectral data. To this end, we have used spectra from the cancerous areas from several patients, as well as spectra from other recognizable regions (e.g., the capsule), identifies by HCA, as inputs into the ANN, along with the histo-pathological diagnoses associated with the regions from which the spectra were collected. ANNs trained on sufficiently large data-sets have performed with very high success in the analysis of spectral data.
4.2 Comparison of SHP-results for macro- and micro-metastases
The results presented in Section 3 are, to our knowledge, the first reports of spectral detection of micro-metastases. We recently reported SHP results from large breast cancer metastases in lymph nodes, both for deparaffinized and flash-frozen tissue sections. The corresponding data sets were acquired at 25 μm spatial resolution, which permitted us to image entire lymph node sections, measuring up to 10 mm in size. In this study, we actually took the analysis one step further and trained ANNs (see above) to discriminate breast cancer metastases and the rest of the lymph node separately for both the frozen and de-paraffinized tissues [2]. Subsequently, the ANNs were tested with unknown imaging data sets, and recognized and depicted the metastatic areas accurately.
When this paper was submitted for publication, the reviewers/editors actually suggested to extend these studies to micro-metastases, which we were assured to pose a much more serious diagnostic problem than the large (several millimeter diameter) metastases we reported originally.
Consequently, we concentrated our efforts on the detection of microscopic metastases. Aside from changing the pixel resolution from 25 μm (in the original study) to 6.25 μm for the present study, all data collection and manipulation procedures were left unchanged. Although the data acquisition time increases significantly between the 25 and 6.25 μm data acquisition modes, and although the size of the resulting data blocks presents some problems, we believe that the better spatial resolution actually helps the spectral identification since the pixel spectra are a mixture of different tissue types to a smaller degree. The results on micro-metastases reported here have not yet been incorporated into a trained, diagnostic ANN, but serve to demonstrate that at the high spatial resolution obtainable with modern instrumentation, clusters of a few meta-static cancer cells can be detected in lymph node tissue.
4.3 Outlook
The problems of long data acquisition times can eventually be overcome by using more massive parallel detection via large FPAs, which should reduce the acquisition times significantly. The problem with data processing can actually be overcome relatively easily once trained ANNs are available for micro-metastases. Presently, most processing time (4 hours per data set) is spent on the HCA presorting of spectra into classes or clusters that subsequently are correlated with histo-pathological classes. This information is required for the training of the ANN; however, once trained and validated, a diagnostic ANN or other algorithm can analyze a 25 000 spectrum data set in less than a minute. Thus, a real-time imaging system with dedicated on-line processing is visualized that can analyze one image while the next one is being acquired.
5. Conclusions
In this report, we present the first SHP-based detection methods for micro-metastases in lymph nodes. Given the frequency of sentinel lymph node resections, and the problems associated with detecting micro-metastases in them, the spectral method offers an enormous advantage for histo-pathologists for the reliable detection and identification of metastatic cells. Present instrumentation may not yet have the required speed of data acquisition; however, we demonstrated in this report that mathematical methods of analysis have the sensitivity and specificity to detect micro-metastases and very small clusters of cancer cells in normal lymph node tissue.
Acknowledgement
Funding of this research from CA-111330 (to MD) is gratefully acknowledged.
Biography
Benjamin Bird received his bachelor degree in chemistry from the University of Hertfordshire in 2002. He then worked under the direction of Prof. Mike Chesters and Prof. Mike George at the University of Nottingham where he received his Ph.D. in 2006. His thesis title was “FTIR imaging: A Route Toward Automated Histopathology” and documented his work that investigated the feasibility of using infrared imaging as a tool to characterize and classify both exfoliated and biopsied clinical samples of lymph nodes and the cervix. Since 2006 he has been working as a postdoctoral fellow in the research laboratory of Prof. Max Diem where he works in close collaboration with the Pathology Department of Tufts Medical Center. Currently he is involved in several projects focused toward the automation of spectral cytology and spectral histopathology.
Melissa Romeo received her Bachelor of Science with Honours at Monash University, Australia in 1996 before joining the laboratory of Dr Don McNaughton at Monash University to complete her Ph.D. She worked in the laboratory of Prof. Mike Adams at RMIT University (Melbourne, Australia) as a post-doc between 2001 and 2003 before joining the laboratory of Prof. Max Diem at Hunter College (CUNY, NY, USA) in 2003. In 2006 she moved with Prof. Max Diem to Northeastern University in Boston, where she was promoted to Research Assistant Professor. She is the author and co-author of about 25 papers and 5 book chapters.
Nora Laver, MD, received her medical education at the University of Buenos Aires School of Medicine, Argentina. Dr. Laver first specialized in Ophthalmology in Argentina. She then moved to the US and received further training in Anatomic Surgical Pathology (residency) and Cytopathology (fellowship) at Georgetown University Medical Center between 1992 and 1995. In addition, she did further fellowship training at the Armed Forces Institute of Pathology in Washington D.C in the areas of ocular and head and neck pathology. She has been a Medical Staff Pathologist at Tufts University Medical Center since 1998 (formerly New England Medical Center) in Boston, and an Associate Clinical Professor of Pathology and Ophthalmology (since 2007), the Director of the Ocular Pathology Laboratory, the Director of Residency Training in Pathology, and the Director of the Cytopathology Laboratory (since 2007). She has published over 30 full-length papers in medical journals on a wide variety of topics.
Max Diem received his Vordiplom in Chemistry at the Universität Karlsruhe, Germany in 1970, and his Ph.D. in Physical Chemistry in 1976 at the University of Toledo, OH, USA. He worked in the laboratory of Prof. Laurence Nafie at Syracuse University (Syracuse, NU, USA) as a postdoc between 1976 and 1978. He then joined the faculty of the Chemistry Department of the City University of New York, Hunter College, were he was promoted to Professor of Chemistry in 1987. In 2005, he moved his research group to the Department of Chemistry and Chemical Biology at Northeastern University in Boston. Prof. Diem’s research interests during the first two decades of his academic career dealt mostly with the emerging field of vibrational optical activity (infrared circular dichroism and Raman optical activity). Later, he started to focus his attention on the application of vibrational spectroscopy for medical diagnosis. He is the author or co-author of about two books, ten book chapters, and 150 papers.


References
- [1].Schreiber RH, Pendas S, Ku NN, Reintgen DS, Shons AR, Berman C, Boulware D, Cox CE. Microstaging of breast cancer patients using cytokeratin staining of the sentinel lymph node. Annals of Surgical Oncology. 1999;Vol 6(1):95–101. doi: 10.1007/s10434-999-0095-3. [DOI] [PubMed] [Google Scholar]
- [2].Bird B, Miljković M, Romeo MJ, Smith J, Stone N, George MW, Diem M. “Infrared Micro-Spectral Imaging: Automatic Distinction of Tissue Types in Axillary Lymph Node Histology”. BMC Clinical Pathology. 2008;8:8. doi: 10.1186/1472-6890-8-8. (doi: 10.1186/1472-6890-8-8) [DOI] [PMC free article] [PubMed] [Google Scholar]
- [3].Romeo MJ, Dukor RK, Diem M. Introduction to Spectral Imaging: Applications to the Diagnosis of Lymph Nodes. In: Diem M, Griffiths PR, Chalmers JM, editors. Vibrational Spectroscopy for Medical Diagnosis. J. Wiley-Interscience; Chichester: 2008. pp. 1–25. [Google Scholar]
- [4].Romeo MJ, Diem M. Infrared spectral imaging of lymph nodes: Strategies for analysis and artifact reduction. Vibrational Spectrosc. 2005;38:115–119. doi: 10.1016/j.vibspec.2005.03.009. [DOI] [PMC free article] [PubMed] [Google Scholar]
- [5].Romeo M. Spectral Diagnosis Wiki. 2008 www.spectral-diagnosis.wikispaces.com.
- [6].Lasch P. Cytospec. www.cytospec.com.
- [7].Adams MJ. Chemometrics in Analytical Spectroscopy. In: Barnett NW, editor. RSC Analytical Spectroscopy Monographs. 2nd ed Royal Society of Chemistry; Cambridge: 2004. [Google Scholar]
- [8].Ward JH. Hierarchical grouping to optimize an objective function. J. Amer. Stat. Assoc. 1963;58(301):236–244. [Google Scholar]
- [9].Lasch P, Diem M, Hänsch W, Naumann D. Artificial Neural Networks as Supervised Techniques for FT-IR Microspectroscopic Imaging. J. Chemometrics. 2007;20(5):209–220. doi: 10.1002/cem.993. [DOI] [PMC free article] [PubMed] [Google Scholar]
- [10].Boydston-White S, Chernenko T, Regina A, Miljkovic M, Matthaeus C, Diem M. Microspectroscopy of single proliferating HeLa cells. Vibrational Spectroscopy. 2005;38(1–2):169–177. [Google Scholar]
- [11].Boydston-White S, Romeo MJ, Chernenko T, Regina A, Miljkovic M, Diem M. Cell-cycle-dependent variations in FTIR micro-spectra of single proliferating HeLa cells: Principal component and artificial neural network analysis. Biochim Biophys Acta. 2006;1758(7):908–914. doi: 10.1016/j.bbamem.2006.04.018. [DOI] [PMC free article] [PubMed] [Google Scholar]
- [12].Romeo MJ, Bird B, Boydston-White S, Matthaüs C, Miljković M, Chernenko T, Diem M. “Infrared and Raman Micro-spectroscopic Studies of Individual Human Cells”. In: Diem M, Griffiths P, Chalmers J, editors. “Vibrational Spectroscopy for Medical Diagnosis”. J. Wiley-Interscience; 2008. pp. 27–70. [Google Scholar]
- [13].Wood BR, Chiriboga L, Yee H, Quinn MA, McNaughton D, Diem M. Fourier transform infra-red (FTIR) spectral mapping of the cervical transformation zone, and dysplastic squamous epithelium. Gynecol. Oncology. 2004;93(1):59–68. doi: 10.1016/j.ygyno.2003.12.028. [DOI] [PMC free article] [PubMed] [Google Scholar]
- [14].Bird B, et al. Detection of Breast Micro-Metastases in Axillary Lymph Nodes by Infrared Micro-Spectral Imaging. The Analyst. 2008 doi: 10.1039/b821166c. submitted. [DOI] [PMC free article] [PubMed] [Google Scholar]