Abstract
When rats are fed ethanol intragastrically at a constant rate for 1 month, the urinary alcohol level (UAL) cycles over 7–9 day intervals. At the peak UAL, the liver is hypoxic shifting from a redox state to a reduced rate. Microarray analysis done on livers at the UAL peaks shows changes in ~1300 gene expression compared to the pair-fed controls. To determine the mechanism of the gene expression changes, histone acetylation regulation was investigated in liver nuclear extracts at the peaks and troughs of the UAL and their pair-fed controls. No change occurred in SirT-1. P300, a histone acetyltransferase (HAT), which acetylates histone H3 on lysine 9, was increased at the peaks. Histone 3 acetylated at lysine 9 was also increased at the peaks. This indicates that the up regulated genes at the UAL peaks resulted from an increase in p300 transcription regulation, epigenetically. P300 activates transcription of numerous genes in response to signal transcription factors such as H1F 1α, increased in the nucleus at UAL peaks. Signal transduction pathways, such as NFκB, AP-1, ERK, JNK, and p38 were not increased at the peaks. β-catenin was increased in the nuclear extract at the UAL peaks and troughs, where increased gene expression was absent. The increase in gene expression at the peaks was due, in part, to increased acetylation of histone 3 at lysine 9.
Keywords: histone 3, histone acetyltransferase, microarrays, alcohol, liver
INTRODUCTION
When rats are fed ethanol at a constant rate by intragastric tube for 1 month, the blood and urinary alcohol level (UAL) cycles up and down from >100 mg% at the trough and ~500 mg% at the peaks (Tsukamoto et al., 1985; Li et al, 2000). Microarray analysis of the livers of these rats shows that gene expression changes are numerous at the peaks, compared to the pair-fed control rats (Bardag-Gorce et al., 2006; French et al., 2005; Tsukamoto et al., 1985). When the peak values were compared to the pair-fed controls, one thousand three hundred genes were changed. The question then was: what is the mechanism for this large number of gene expression changes? It was postulated that the mechanism was epigenetic in nature, where gene silencing by DNA methylation or histone deacetyla tion had reversed to produce gene expression (Bardag-Gorce et al, 2006). To test this hypothesis, acetylation of histones using nuclear extracts from livers of rats fed-ethanol and their pairfed controls, was measured.
One reason for focusing on histone acetylation in this model was that when histone acetyltransferase activity is increased and histone H3 acetylation at lysine 9 is increased when rat liver cells are exposed to an acute dose of ethanol in vitro (100 mM) or in vivo by administrating a 6 g dose of alcohol orally (Park et al., 2005; Park et al., 2003). As predicted, when histone H3 acetylated at lysine 9 was measured by Western blot in nuclear extracts from the livers of rats at the peaks and troughs of the UAL cycle, it was increased at the peaks, but not at the troughs. Likewise, p300, an histone acetyltransferase, was found to be increased at the peaks. P300 is an integrator of many signaling pathways (~10 different signaling pathways) linking transcription factors and co-activators to the basal transcription machinery (Rahnman et al., 2004; Turnell and Mymryk, 2006). The elevations of H1F1α and 1β at the peaks of the UAL (Li et al 2004) were the only positive correlates found with the increase in H3 K9 acetylation and p300 at the peaks.
MATERIALS AND METHODS
Animal Model of alcoholic liver disease
Male Wistar rats from Harleco (Hollister, CA) weighing 250 and 300 g were used. Liver tissue from these rats was derived from previously reported studies (Bardag-Gorce et al., 2006; French et al., 2005; Li et al., 2004; Bardag-Gorce et al., 2002). The rats were fed a liquid diet intragastrically containing ethanol (13 g/kg/day at a constant rate for 1 month (Li et al., 2000) (Alcohol-fed group). Pair-fed controls were fed dextrose isocaloric to ethanol (pair-fed control group). The ethanol fed rats were killed at either the peaks or troughs of the urinary alcohol cycle (UAL) as determined by measuring the daily 24 h urinary alcohol levels. The urine was collected under toluene using metabolic cages, one rat/cage. The urinary alcohol level was measured using a kit (QED Saliva Alcohol test kit A 150, STC Technologies, Bethlehem, PA). At sacrifice under isofluorane anesthesia, the liver was removed and weighed. A portion of the livers were quick frozen and stored in isopentane in liquid nitrogen followed by storage at −80ºC.
The rats were maintained according to the Guidelines of Animal Care, as described by the National Academy of Sciences and published by the National Institute of Health (1996).
Cell Fraction Preparation
Homogenate and subcellular fractions were prepared as follows: frozen liver samples were homogenized using an ultraturrax T25 homogenizer in 50 μmol/L Tris (pH8), 10% glycerol, 5 mm/L EDTA. 1 mmol/LEGTA, 50 μmol/L E64, 1 mm/L phenylmethylsulfonyl fluoride and 2.5 μmol/L pepstatin A. The homogenate was centrifuged for 1 h at 100,000 g. The supernatant was the cytosolic fraction. The nuclear extracts were prepared according to the protocol reported by Li et al., (2004). Protein concentrations for Western blots were measured using the Bradford method (1976). Bovine serum albumin was used as the protein standard.
Western blots
Five micrograms of protein from liver homogenates, cytosol or nuclear extracts was used in SDS-Page electrophoresis using either a 7% or 12% separation gel depending on the size of the protein molecular weight (Laemmli, 1970). Proteins were transferred to polyvinylidene difluoride membrane (Bio-Rad, Hercules, CA) for 1 h and 2.5 mm/L Tris-HCI (pH8.3), 192 mmol/L glycine and 20% methanol. An immunologic stain was performed using an enhanced chemiluminescence kit (Amersham, Piscataway, NJ) or an alkaline phosphatase kit (BioRad). The membranes were then scraped and stained with a second antibody to α actin to correct for protein loading differences. Antibodies and sources used are listed in Table I.
TABLE 1.
Antibodies Used
| FoxO1 | Sigma, St Louis MI |
| SirT 1 | Nuvus Biologicals, Littleton, CO |
| p300 | Santa Cruz Biotech, Santa Cruz, CA |
| CBP | Upstate, Lake Placid, NY |
| NFκB/p65 | Rockland Immunochemicals, Inc, Gilbertsville, PA |
| pERK1/ERK2 | Cell Signaling Technology, Danvers, MA |
| ERK1/ERK2 | Cell Signaling Technology, Danvers, MA |
| P-JNK1 | Cell Signaling Technology, Danvers, MA |
| SAPK/JNK | CALBIOCHEM Inc, La Jolla, CA |
| β-catenin | BD Transduction Lab. Rockville, MD |
| c-Jun | Epitomics, Burlingame, CA. |
| p38 MAPK | Cell Signaling Technology, Danvers, MA |
| AcH3K9 | Cell Signaling Technology, Danvers, MA |
| p-AKT | Rockland Immunochemicals, Inc, Gilbertsville, PA |
Results
It is postulated here that the SirT/FoxO1 pathway (Gan et al., 2005) responsible for histone 3 deacetylation, would be reduced at the UAL peaks because of the shift of the NADH/NAD+ ratio to the reduced state, which occurs at the peak (Bardag-Gorce et al., 2002, Gastroenterology). SirT1 activity is rate-limited by the concentration of NAD+. To support this concept, both SirT and Fox O levels were not increased (Figs. 1 and 2). This was the case in both the whole homogenate and nuclear extracts.
Fig 1.
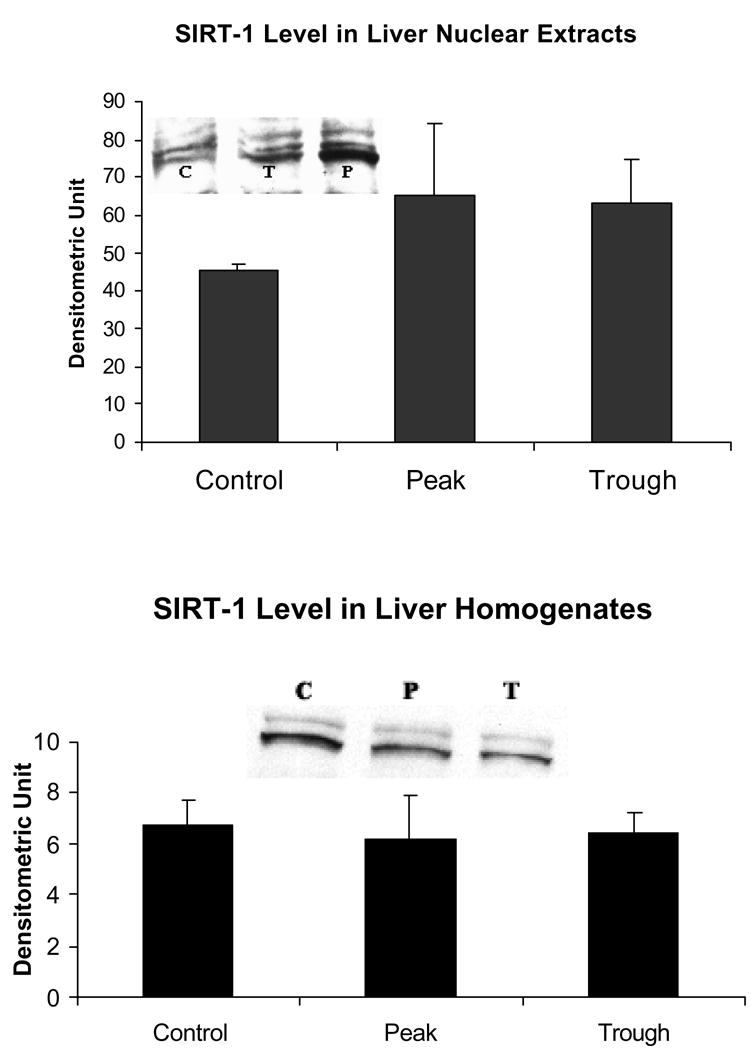
There was no change in SirT1 in the nuclear extracts or the whole homogenates in either the peaks or troughs of the UAL cycle (mean ± SEM, n = 3, p = 0.53 in the nuclear extract).
Fig 2.
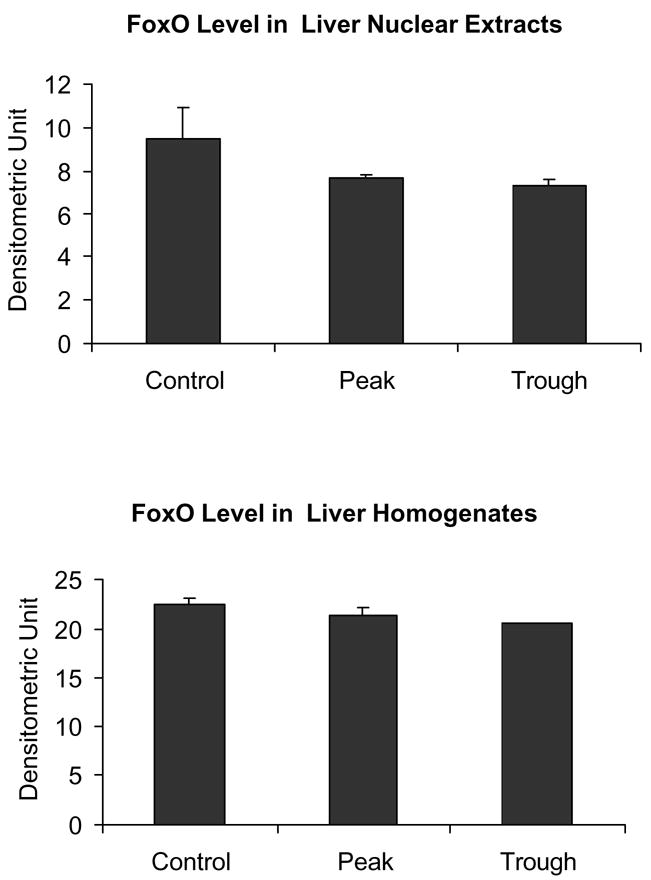
There was no change in FoxO1 in the liver homogenates or nuclear extracts at the peaks and troughs of the UAL cycle (mean ± SEM, n = 3, p = 0.22 in the nuclear extract).
The next question is: was histone 3 lysine 9 acetylated at the peaks of the UAL cycle?
Figure 3 shows that there was an increase in histone 3 lysine 9 acetylation at the peaks of the UAL cycle after chronic ethanol feeding. It was previously reported that there was an increase in histone 3 lysine 9 acetylation in acute ethanol exposure experiments (Park et al 2003, 2005). This indicates that histone acetyltransferase (HAT) activity is increased, and that the histone acetyltransferase p300 may be responsible for this increased activity. Indeed, p300 was also found to be increased in the nuclear extracts at the UAL peak (Fig. 4). However, the level of transcription adapter CBP, a homologue of p300, was not increased in the nuclear extracts (Fig. 5).
Fig 3.
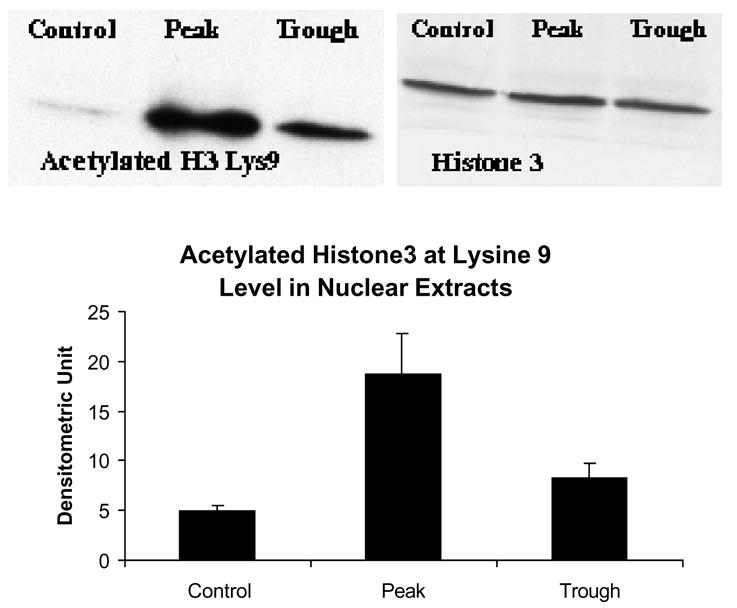
There was an increase in histone 3 lysine 9 acetylation in the nuclear extracts at the UAL peaks (mean ± SEM), (P vs C : p=0.02; P vs T : p=0.027; n=3).
Fig 4.
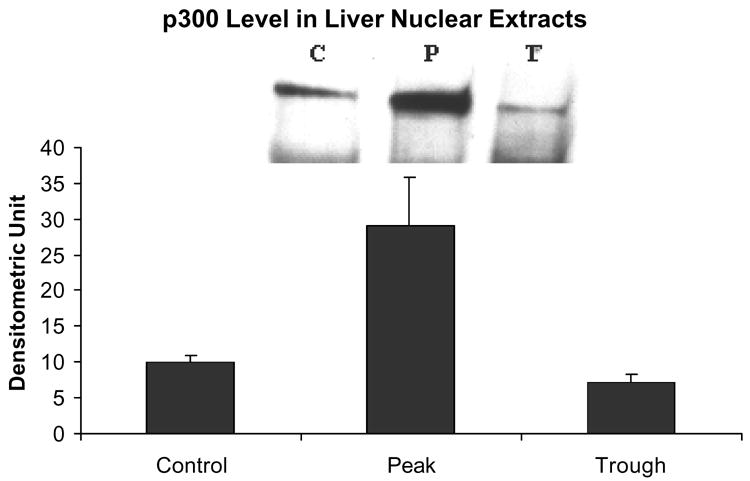
There was an increase in p300 levels in the nuclear extracts at the peaks of the UAL (mean ± SEM, P vs C : p=0.015; P vs T : p=0.019; ; n = 3).
Fig 5.
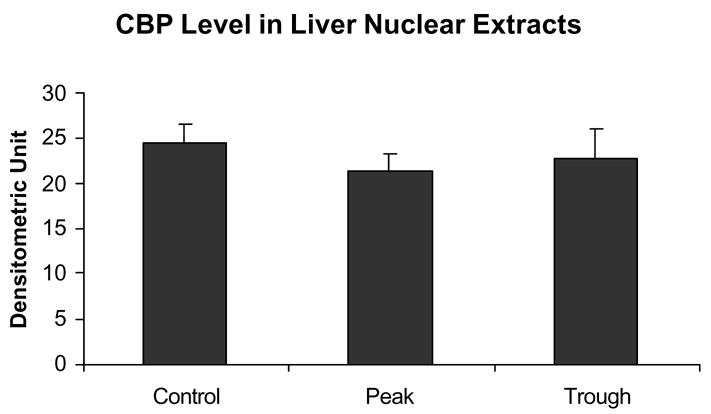
There was no change in CBP levels in the nuclear extracts at the peaks and troughs of the UAL cycle. (mean ± SEM, n = 3).
The next question is: what signal transduction pathways were activating p300?
Park et al. (2005) found that both MEK and JNK pathways’ inhibitors, but not p38, prevented the ethanol-induced increase in histone 3 lysine 9 acetylation. We therefore measured the levels of NFκB p65, p38, pJNK, p-AKT, and pErk1/pErk2 in the nuclear extracts from livers at the peaks and troughs of the UAL cycle. The NFκB pathway was not changed at the UAL peaks, as indicated by p65 quantitation in the nuclear extracts (Fig. 6).
Fig 6.
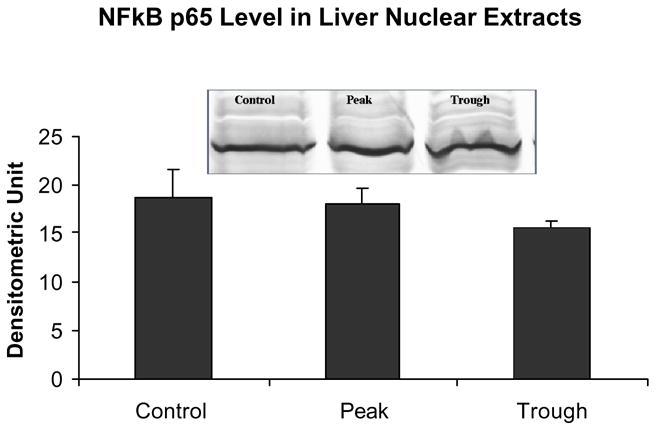
There was no change in NFκB p65 levels in the nuclear extracts at the peaks and troughs of the UAL cycle (mean ± SEM, n = 3).
Likewise, the AP-1 pathway was not changed as reflected in the measurement of phosphor c-Jun (Fig. 7). Phospho-Akt was reduced at the troughs (Fig. 8) in the nuclear extracts. pErk1/pErk2 were also measured in the nuclear extract fractions. Their levels were decreased (Fig. 9). p38 MAPK was decreased in the nuclear extracts (Fig. 10). pJNK levels were also reduced in the nuclear extracts at the peaks and troughs of the UAL cycle (Fig. 11). The only pathway that was found to be up regulated was the wnt pathway where β-catenin was increased in the nuclear extracts at both the peaks and the troughs of the UAL cycle (Fig. 12). The change in signal transduction pathways activity did not correlate with the activation of p300 and the acetylation of histone 3 lysine 9.
Fig 7.
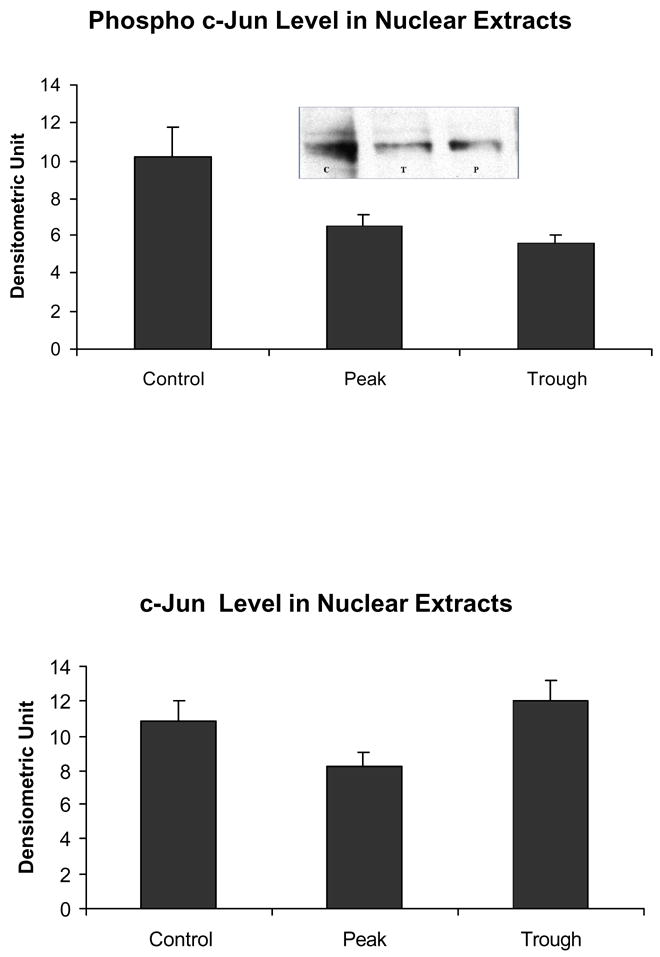
Phospho-c-Jun tended to decrease in the nuclear extracts at the peaks of the UAL cycle (C vs T p = 0.056, C vs P = 0.11, mean ± SEM, n = 3). However there was n o change in c-Jun itself.
Fig. 8.
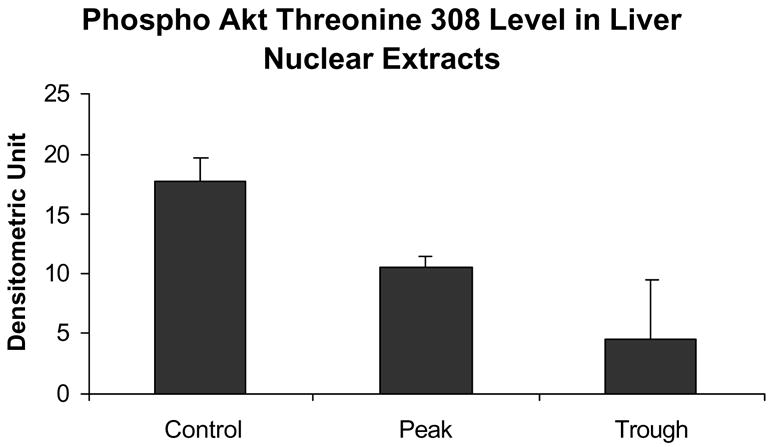
The level of phospho-Akt Th308 in the nuclear extracts was decreased at the trough compared to the controls (C vs T p = 0.013, mean ± SEM, n = 3).
Fig. 9.
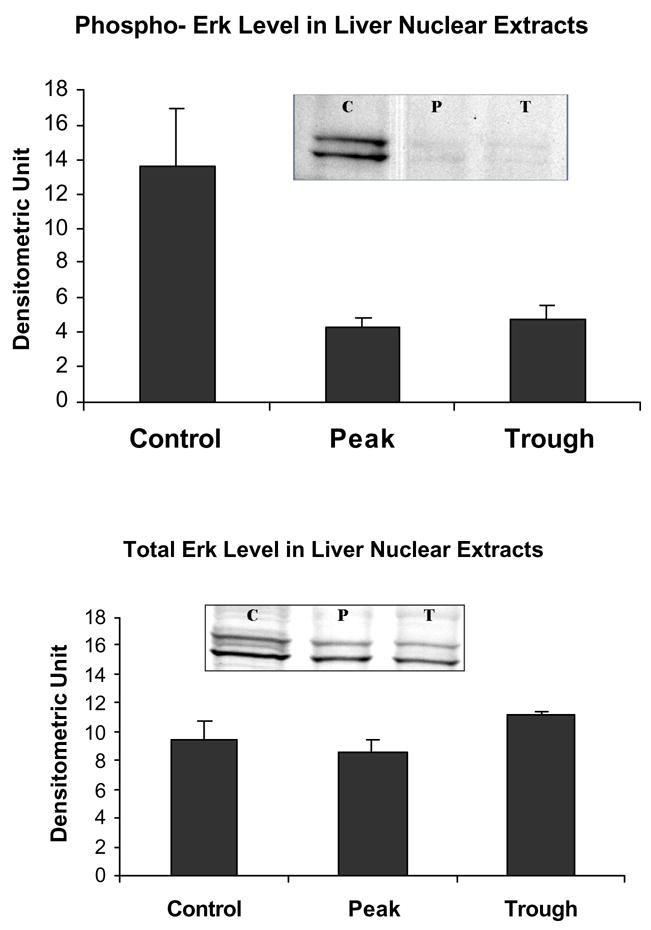
The levels of phospho ERK1/phosphoERK2 in the liver in the nuclear extracts were decreased at the peaks of the UAL (C vs P p= 0.04 C vs T p= 0.022, mean ± SEM, n=3).
Fig 10.
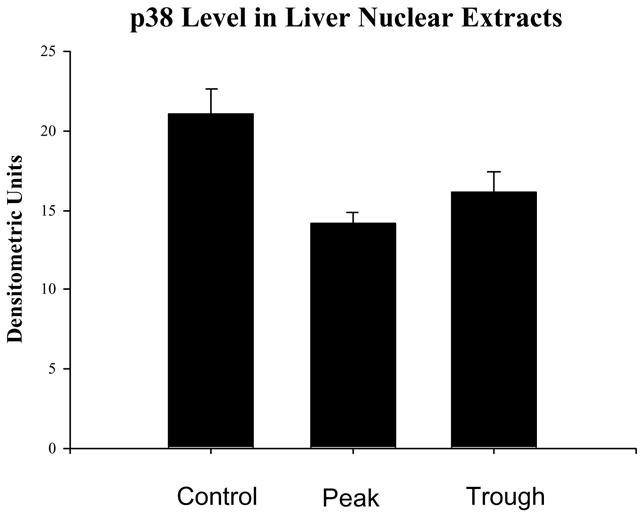
The levels of p38 MAPK were decreased in the nuclear extracts at the peaks and troughs of the UAL cycle (mean ± SEM, n = 3), p<0.02 P vs C, p<0.047 vs C).
Fig. 11.
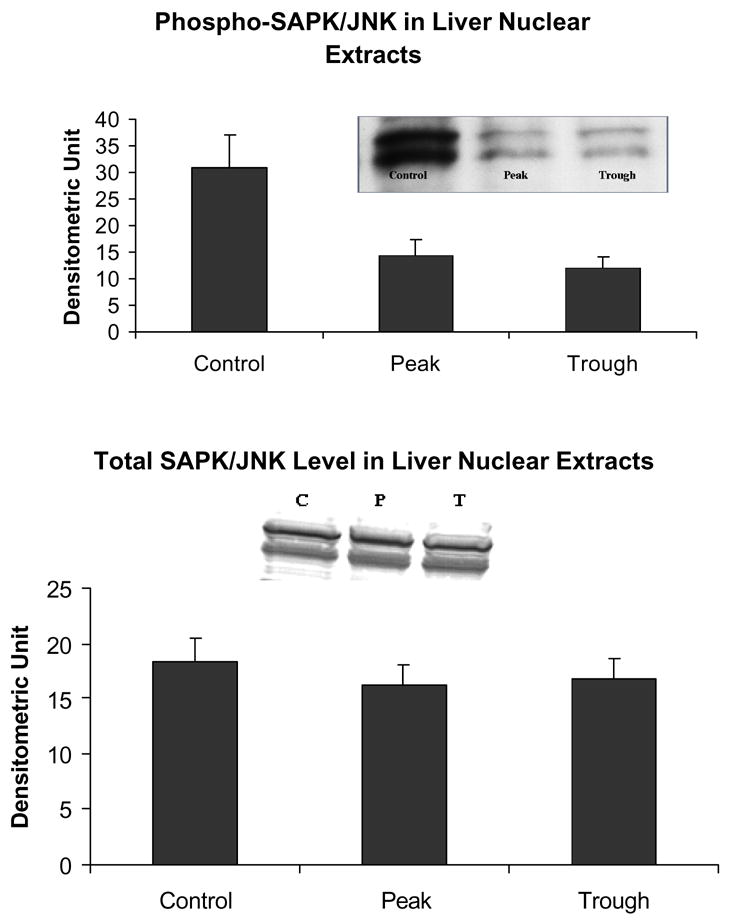
The levels of phospho-JNK was decreased in the nuclear extracts at both the peaks and troughs of the UAL cycle (C vs P p= 0.031 C vs T p=0.040, mean ± SEM, n = 3).
Fig 12.
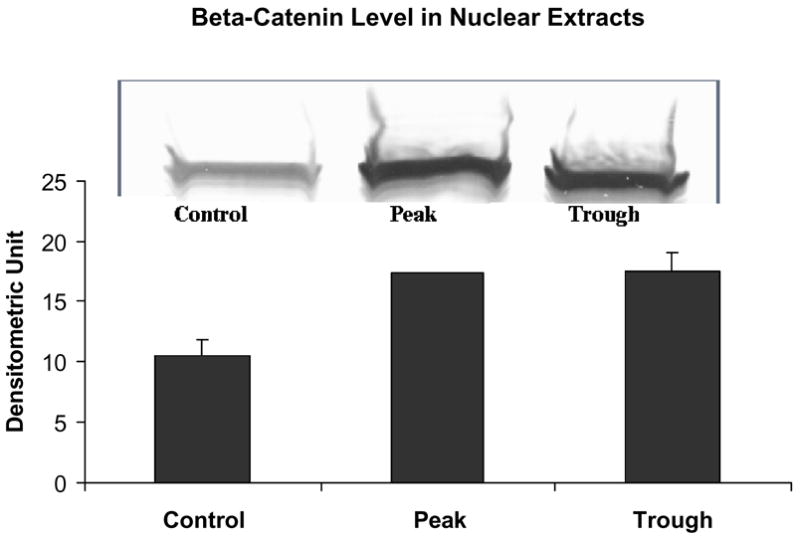
The level of β-catenin was increased in the nuclear extracts at both the peaks and troughs of the UAL cycle (C vs T p=0.013, C vs P p=0.006, mean ± SEM, n = 3).
DISCUSSION
As predicted, acetylation of histone 3 lysine 9 was increased in the nuclear extracts of livers at the peaks of the UAL cycle, and this was associated with an increase in the histone acetyl transferase p300. To our knowledge, p300 activation by high blood alcohol levels in a chronic ethanol feeding model has not been reported before.
p300 is located at transcription sites, and binds with CBP, another histone acetyltransferase. It serves as a co-transactivation protein in the regulation of the transcription of a large number of genes. The p300/CBP molecule interacts with a large number of proteins. To name a few; CREB, STAT1 and 2, SF-1, nuclear hormone receptors, TAL1, Mdm2, TBP, H1F-1, RXR, p65, cJun, C/EBPα, p73, JNK, p21, HNF-4, ATF1 and 4, SREBP, c-myb, BRCA-1, pMAD, HPV-E6, Ets-1, JunB, ERK, PKA, E1A, p53, P/CAF, MyoP, cFos, SV40/argeT, Smad 1 and 3, β catenin, SRC-1 and AFT2 (Goodman and Smolik, 2000). Of these, only HIF1α and HIF1β correlated positively at the peaks of the UAL cycle. Both HIF1α and β are increased in the nuclei only at the peak (Li et al., 2004).
The changes in p300/CBP regulated gene expression affect cell growth, transformation and development. So broad is its influence in gene expression that its interactions could account for the epigenetic proportions, and could conceivably account for the large number of changes in gene expression observed at the peaks of the UAL cycle observed in vivo (French et al, 2005; Bardag-Gorce et al., 2006). The fact that none of the signal transductio n pathways that interact with p300/CBP were not increased in the nuclear extracts at the peaks, suggests that the change in p300 mediated gene transcription is global and represents an epigenetic phenomenon.
Park et al. (2005) found an increase in HAT in the acute ethanol model. The inhibitors of MEK, and JNK but not p38, suppressed the increase in H3 acetylation. However, MEK and JNK inhibitors did not significantly affect the ethanol-induced effect on HAT. The results reported here indicate that neither ERK nor JNK are involved in the chronic model of ethanol-induced acetylation of histone 3 lysine 9, or p300/CBP activation.
CONCLUSION
This report provides evidence for two mechanisms, which could explain the epigenetic gene expression pattern noted at the peak of the UAL cycle. The increase in acetylation of histone 3 at lysine 9 in the nuclear extracts could result from an increase in nuclear HIF-1α-β at the peaks initiated by liver hypoxia. This would increase the p300 histone acetyltransferase activity. The second possibility would be the decrease in SirT1 deacetylation of histone caused by a decrease in the NAD levels seen at the peaks, since this enzyme requires NAD as a coenzyme to support its deacetylase activity. In both cases, liver hypoxia may be the trigger to increase lysine 9 acetylation-induced global gene transcription. The other signal transduction pathways tested negative as mechanisms of p300 activation. The activation of p300 acetylation of histones spread, activating the expression of a large number of genes in a nonspecific and reversible manner, thus leading to the postulation that this represents an epigenetic phenomenon (reported in part in an Abstracts: French et al., 2006; Bardag-Gorce et al., 2006)
Acknowledgments
The authors are grateful to Adriana Flores who typed the manuscript. The study was supported by a grant from NIH/NIAAA 8118 and Alcohol Center Grant P50-011999 on liver and pancreas.
Footnotes
Publisher's Disclaimer: This is a PDF file of an unedited manuscript that has been accepted for publication. As a service to our customers we are providing this early version of the manuscript. The manuscript will undergo copyediting, typesetting, and review of the resulting proof before it is published in its final citable form. Please note that during the production process errors may be discovered which could affect the content, and all legal disclaimers that apply to the journal pertain.
References
- Bardag-Gorce F, French BA, Li J, French SW. The blood alcohol level affects genes expression and transcription regulator proteins in an epigenetic manner. Hepatology. 2006:Abstract 1084. [Google Scholar]
- Bardag-Gorce F, French BA, Dedes J, Li J, French SW. Gene expression patterns of the liver in response to alcohol: In vitro and in vivo models compared. Exp Mol Pathol. 2006;80:241–251. doi: 10.1016/j.yexmp.2005.12.006. [DOI] [PubMed] [Google Scholar]
- Bardag-Gorce F, French BA, Li J, Riley NE, Yuan QX, Reitz NE, Yuan QX, Reitz R, Cai Y, Wan Y-JY, French SW. The importance of cycling of blood alcohol levels in the pathogenesis of experimental alcoholic liver disease in rats fed ethanol intragastrically. Gastroenterology. 2002;13:325–35. doi: 10.1053/gast.2002.34177. [DOI] [PubMed] [Google Scholar]
- Bradford MM. A rapid and sensitive method for the quantitation of microgram quantities protein utilizing the principle of protein-dye binding. Anal Biochem. 1976;72:248–254. doi: 10.1006/abio.1976.9999. [DOI] [PubMed] [Google Scholar]
- French BA, Dedes J, Bardag-Gorce F, Li J, Wilson L, Fu P, Nan L, French SW. Microarray analysis of gene expression in the liver during the urinary ethanol cycle in rats fed ethanol intragastrically at a constant rate. Exp Mol Pathol. 2005;79:87–94. doi: 10.1016/j.yexmp.2005.06.006. [DOI] [PubMed] [Google Scholar]
- French SW, French BA, Bardag-Gorce F, Dedes J. The role of the redox state in gene expression regulation by the liver at high blood alcohol levels. Alcoholism: Clin Exp Res. 2006;34(Suppl):Abst 333. [Google Scholar]
- Gan L, Han Y, Bastianetto S, Dumont Y, Onterman TG, Ouirion R. FoxO-dependent and- independent mechanisms mediate SirT effects on IGFBP-1 gene expression. Biochem Biopohys Res Commun. 2005;2005;332:1092–1096. doi: 10.1016/j.bbrc.2005.09.169. [DOI] [PubMed] [Google Scholar]
- Laemmli UK. Cleavage of structural proteins during the assembly of the head of bacteriophage T4. Nature. 1970;227:680. doi: 10.1038/227680a0. [DOI] [PubMed] [Google Scholar]
- Li J, French BA, Wu Y, Vankatesh R, Montgomery R, Bardag-Gorce F, Kitto J, French SW. Liver hypoxia and lack of recovery after reperfusion at high blood alcohol levels in the intragastric fe eding model of alcoholic liver disease. Exp Mol Pathol. 2004;77:184–192. doi: 10.1016/j.yexmp.2004.08.002. [DOI] [PubMed] [Google Scholar]
- Li J, Nguyen V, French BA, Parlow AF, Su GL, Fu P, Yuan QX, French SW. Mechanism of the cyclic pattern in urinary ethanol levels in rats fed ethanol. The role of the hypothalamic-pituitary-thyroid axis. Am J Physiol Gastrointest Liver Physiol. 2000;279:G118–G125. doi: 10.1152/ajpgi.2000.279.1.G118. [DOI] [PubMed] [Google Scholar]
- Park P-H, Lim RW, Shukla SD. Involvement of histone acetyltransferase (HAT) in ethanol-induced acetylation of histone H3 in hepatocytes: potential mechanism for gene expression. Am J Physiol Gastrointest Liver Physiol. 2005;289:1124–1136. doi: 10.1152/ajpgi.00091.2005. [DOI] [PubMed] [Google Scholar]
- Park P-H, Miller R, Shukla SD. Acetylation of histone H3 at lysine 9 by ethanol in rat hepatocytes. Biochem Biophys Res Commun. 2003;306:501–504. doi: 10.1016/s0006-291x(03)01040-4. [DOI] [PubMed] [Google Scholar]
- Rahman I, Marwick J, Kirkham P. Redox modulation of chromatin remodeling: impact on histone acetylation and deacetylation, NF-κB and pro-inflammatory gene expression. Biochem Pharmacol. 2004;68:1255–1267. doi: 10.1016/j.bcp.2004.05.042. [DOI] [PubMed] [Google Scholar]
- Tsukamoto H, French SW, Reidelberger RD, Largman C. Cyclic pattern of blood alcohol levels during continuous intragastric ethyl infusion in rats. Alcohol Clin Exp Res. 1985;9:31–37. doi: 10.1111/j.1530-0277.1985.tb05046.x. [DOI] [PubMed] [Google Scholar]
- Turnell AS, Mymryk JS. Roles for the coactivators CBP and p300 and the APC/CE3 ubiquitin ligase in E1A-dependent cell transformation. Brit J Cancer (published on line) 2006 doi: 10.1038/sj.bjc.6603304. [DOI] [PMC free article] [PubMed] [Google Scholar]


