Introduction
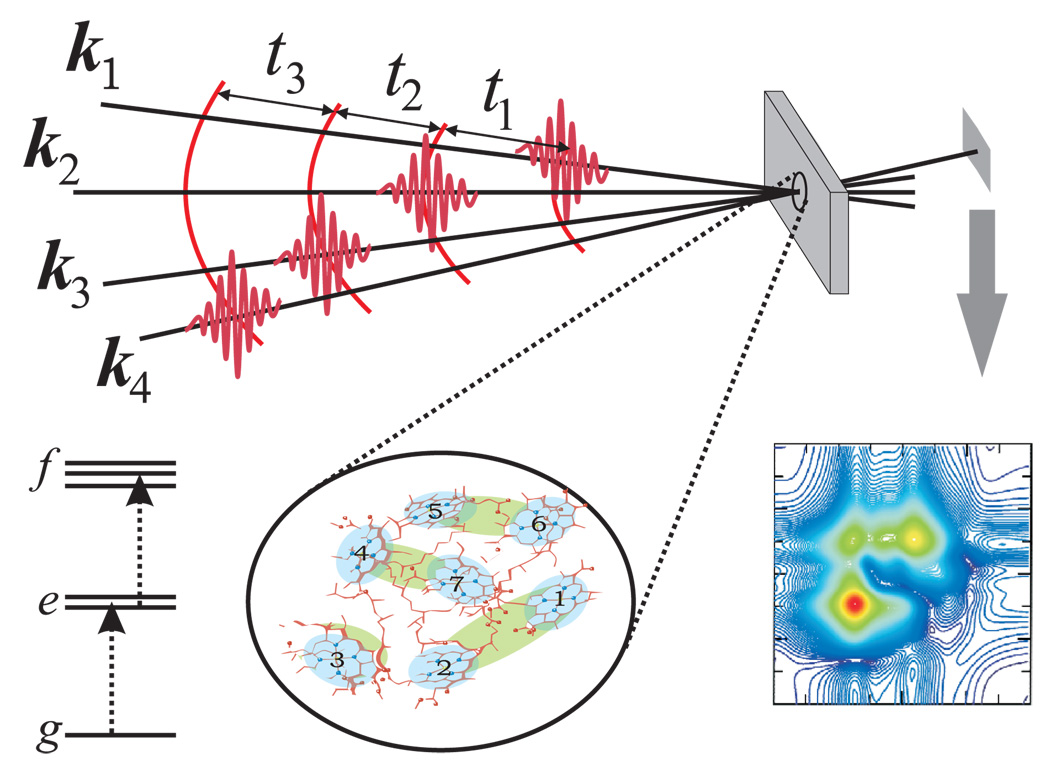
Linear-spectroscopy is one-dimensional (1D); the absorption spectrum provides information about excitation energies and transition dipoles as projected into a single frequency axis. In contrast, multidimensional optical spectroscopy uses sequences of laser pulses to perturb or label the electronic degrees of freedom and watch for correlated events taking place during several controlled time intervals. The resulting correlation plots can be interpreted in terms of multipoint correlation functions that carry considerably more detailed information on dynamical events than the two-point functions provided by 1D techniques1–7. Correlations between spins have been routinely used in NMR to study complex molecules. The Nobel prize was awarded to Richard Ernst8 for inventing the technique and to Kurt Wüthrich9 for developing pulse sequences suitable for large proteins. Optical analogues of 2D NMR techniques first designed to study vibrational dynamics by Raman or infrared pulses1 and later extended to resonant electronic excitations in chromophore aggregates10 have been made possible thanks to the development of stable femtosecond laser sources with controlled phases11. In an ideal heterodyne-detected 2D experiment (Fig. 1) 3 laser pulses with wavevectors k1, k2, k3 interact sequentially with the molecules in the sample to create a polarization with wavevector k4 given by one of the linear combinations ±k1 ±k2 ±k3. In all other directors the polarization vanishes due to the random phases of contributions from different molecules. The coherent signal is generated in directions close to the various possible k4. The missmatch caused by frequency variation of the index of refraction is optimized (“phase matched”) to generate an intense signal detected by interference with a 4th pulse at the desired wavevector k4. When the radiation field is described quantum mechanically the entire process can be viewed as a concerted 4 photon process. The signal S(t3,t2,t1) depends parametrically on the time intervals between pulses which constitute the primary control-parameters. Other parameters include the direction k4, pulse polarizations, envelope shapes, and even the phases.
Figure 1.
Scheme of the time-resolved four-wave-mixing experiment. All calculations are given for the three-band scheme shown on the bottom left.
We shall illustrate the power of 2D techniques and how they work using the three-band model system shown in Fig. 1 which has a ground state (g), a singly excited manifold (e) and a doubly excited manifold (f ). The dipole operator can induce transitions between g to e and e to f . All transitions in the system are stimulated: spontaneous emission is neglected. This three-band model represents electronic excitations in the various physical systems covered in the this article.
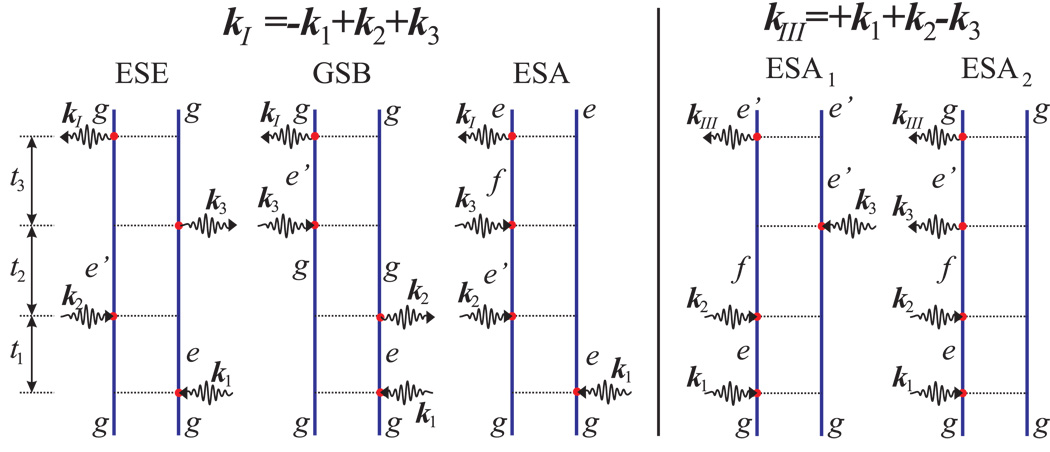
Multidimensional signals monitor the dynamics of the system’s density matrix during the time intervals between pulses. Diagonal elements of this matrix ρnn represent populations of various states, while the off diagonal elements ρnm (n ≠ m), known as coherences, carry additional valuable phase information. These signals can be described intuitively using the Feynman diagrams shown in Fig. 2 which display the Liouville space pathways: sequences of interactions with the various fields and the relevant elements of the density matrix during the controlled intervals between interactions6. The two vertical lines represent the ket (left) and the bra (right) of the density-matrix.
Figure 2.
Feynman diagrams for two 2D techniques with wavevectors kI and kIII. Incoming and outgoing arrows represent the interaction events, labels indicate states of the system during various intervals between interactions. ESA - excited state absorption, GSB - ground state bleaching, ESE - excited state emission. For SkI : the density matrix during (t1,t2,t3) is (ge, é e, é g) for ESE, (ge, gg, é g) for GSB and (ge, é e, fe) for ESA. For SkIII both diagrams are of ESA type. The states of the density matrix are (eg, fg, f é) for ESA1, and (eg, fg, é g) for ESA2.
Time runs from bottom to top and the labels mark the density matrix elements during the evolution periods between interactions. The arrows represent interactions with photons and are labelled by their wavevectors. Photon absorption is accompanied by a molecular excitation (g to e or e to f transition) whereas photon emission induces deexcitation (e to g or f to e).
Our discussion will focus on two signals: the photon-echo SkI with kI = −k1+k2+k3 and the double-quantum-coherence SkIII with kIII =+k1+k2−k3. We first present the Feynman diagrams and the quantum pathways relevant for the two techniques for the generic exciton model of Fig. 1. Simulated signals are then presented for three different physical systems: Wannier excitons in semiconductor quantum wells12–15, Frenkel excitons in photosynthetic complexes6,7, and soft x-ray core excitons in molecules16–19. We demonstrate that both techniques provide new insights into the structure and exciton dynamics in semiconductor nanostructures and molecular aggregates and are highly sensitive to the separation between core-shells and the localization of the core-excited states.
The three contributions to the SkI signal depicted in Fig. 2 are known as ground state bleaching (GSB), excited state stimulated emission (ESE) and excited state absorption (ESA)6. In the GSB pathway the system returns to the ground state (and described by the density matrix element ρgg), during the second interval t2, after interacting with the first two pulses. The third interaction is affected by the decrease of the ground state population which reduces (bleaches) the subsequent photon absorption. In the ESE pathway, the system resides in the singly-excited (e) manifold during t2 and the third interaction brings it back to the ground state by stimulated emission. The ESA pathway shares the same t1 and t2 history of the ESE, however the third interaction now creates a doubly-excited state f . The SkI signal is usually displayed as a frequency/frequency correlation plot SkI (Ω3,t2,Ω1) obtained by a double Fourier transform with respect to the time delays t1 and t3, holding t2 fixed. Ω3 and Ω1 reveal the various resonance transitions, as can be anticipated from the diagrams. Only single-exciton ωeg resonances corresponding to optical coherences ρeg show up during t1 and are projected onto the Ω1 axis. The Ω3 axis shows either ωe′g resonances (ESE, GSB) or ωfe (ESA). The t2 evolution reflects exciton populations ρee and intra-band single-exciton coherences ρee′. Population transport, coherence oscillations and spectral diffusion dominate this interval in the ESE and ESA paths6.
Since the molecular frequencies during t1 (ωge) are negative and during t3 (ωeg and ωfe) are positive, the Ω1 frequency axis is reversed in the 2D plots. With this convention uncoupled excitons only show diagonal peaks. Off diagonal cross-peaks are markers of some kind of communication between various excitations which causes their resonance frequency to be different during t1 and t3. This can be attributed either to exciton delocalization or to population transport. A simple interpretation of the signals is possible by using a basis of states localized on the various chromophores. Since the dipole is localized on each chromophore and can only excite one chromophore at a time, cross peaks only appear when the chromophores are coupled. NMR spectra are similarly interpreted in terms of the couplings of localized spin states8. The couplings of chromophores can always be formally eliminated by diagonalizing the single-exciton Hamiltonian and switching to the delocalized exciton basis. However in this representation the dipole operator matrix elements will depend on the details of the eigenstates, which prevents the simple intuitive interpretation of the signal.
The SkIII technique has two ESA-type contributions (Fig. 2). 2D spectra is obtained by either correlating t1 → Ω1 with t2 → Ω2, SkIII (Ω1, Ω2, t3), or t2 → Ω2 with t3 → Ω3, SkIII (t1,Ω2,Ω3). The density matrix evolution during t1 and t2 is identical for the ESA1 and ESA2 diagrams: single-exciton resonances corresponding to ρeg show up during t1. During t2 the system is in a coherent superposition (coherence) ρfg between the doubly-excited state f and the ground-state g. Two-exciton double-quantum-coherence resonances corresponding to the different doubly excited states f are then projected onto Ω2. The t3 evolution is very different: In ESA1 the system is in a coherence between f and e′ (ρfe′) which results in resonances at Ω3 = ωfe′, corresponding to all possible transitions between doubly- and singly- excited states. For ESA2 the system is in a coherence between e′ and g (ρe′g) and reveals single- exciton resonances at Ω3 = ωe′g as t3 is scanned. When the single-exciton states e and e′ do not interact (e.g. when they belong to two uncoupled chromophores), the corresponding two-exciton state is given by a direct product |f〉 = |ee′〉 and the double-excitation energy is the sum εf = εe + εé. In that case ωeg =ωfe′ =εe, the two diagrams exactly cancel and the signal vanishes! The entire SkIII signal is thus induced by correlations and its peak pattern provides a characteristic fingerprint for the correlated doubly excited wavefunctions. This conclusion goes beyond the present simple model. SkIII vanishes for uncorrelated many electron systems described by the Hartree Fock wavefunction and thus provides an excellent background-free probe for electron correlations12,20. The (Ω2,Ω3) correlation plots spread the two-exciton (f state) information along both axes, thus improving the resolution of the two-exciton manifold.
Signatures of Many-Electron Correlations in Semiconductor Quantum Wells
Semiconductor nanostructures can be fabricated with high purity allowing to vary parameters (e. g. confinement size, barrier height) one at a time. Such degree of control is not possible in molecular aggregates. They therefore provide ideal systems for experimentally testing various levels of many-body theory and electronic structure calculations. 1D femtosecond four wave mixing spectroscopy has long been used for probing coherence and charge carrier dynamics in semiconductors21. 2D extensions have recently been reported in quantum wells and quantum dots12–15.
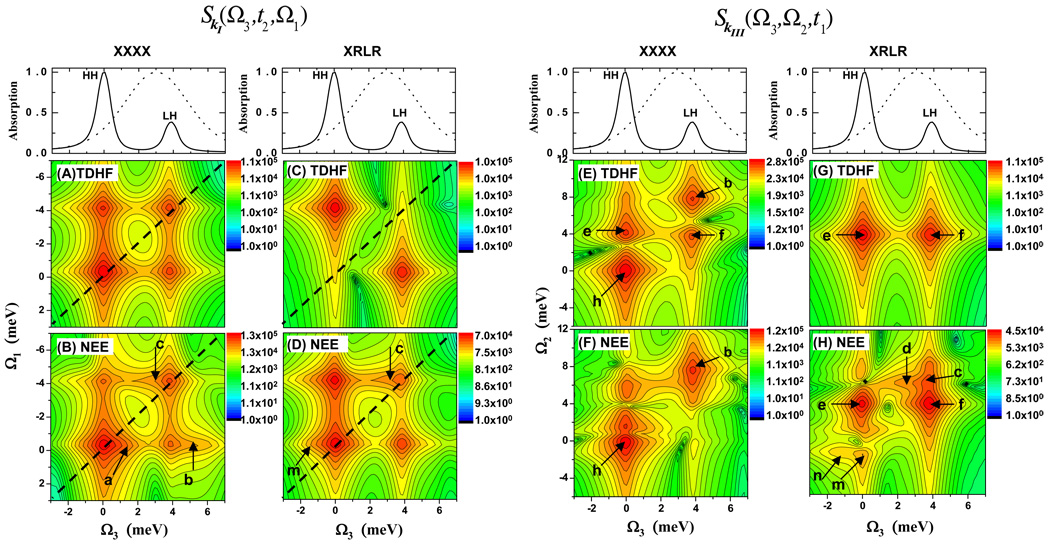
Taking spin-orbit interaction and spatial confinement into account, excitons in GaAs quantum wells (QW) can be described using a single conduction band for electrons and two nondegenerate valence bands12. This results in heavy-hole (HH) and light-hole (LH) excitons. For a QW with 10 nm width, these give two absorption peaks at 0.0 meV and 3.8 meV (top panels of Fig. 3; the origin is set at the 1520 meV HH exciton energy). There are three types of possible two-exciton states: pure HH/HH, pure LH/LH and mixed LH/HH. The two-exciton states can be either bound (negative interaction energy), or unbound (positive, scattering energy), depending on the electron and hole spin configuration.
Figure 3.
Simulated SkI (Ω3,t2,Ω1) (panels A–D) and SkIII (Ω3, Ω2, t1) (panels E–H) spectra of a GaAs quantum well, calculated by a mean-field (TDHF) and a higher level (NEE) treatment of electron correlation using XXXX and XRLR pulse polarization configurations, as indicated. The frequency origin is set at the HH exciton energy (eH =1520 meV) along the Ω3 and Ω1 axes, and at twice the HH exciton energy (2eH) along Ω2. Top panels show the simulated linear absorption (solid) and pulse power spectra (dot) used for the computed 2D signals.
The following simulations used a three-band one-dimensional tight-binding Hamiltonian with periodic boundary conditions, which qualitatively reproduces the key features of the optical excitations of a QW of GaAs. The first two columns of Fig. 3 show the simulated SkI (Ω3,t2,Ω1) spectra for two pulse polarization configurations XXXX (left column) and XRLR (next column). This notation gives the polarizations of the three excitation pulses and the final heterodyne pulse from right (first) to left (last): R - right-circularly polarized, L - left-circularly polarized, and X - linearly polarized along x. Two levels of theory were employed. The time-dependent Hartree-Fock (TDHF) includes an approximate mean-field treatment of electron correlations, while the nonlinear exciton equations (NEE) provide an exact treatment of correlations for the model Hamiltonian used6. We start with the XXXX configuration. At the TDHF level (panel A), the two peaks along the diagonal dashed line represent HH (eH =0 meV) and LH (eL =3.8 meV) excitons. The crosspeaks indicate that the two types of excitons are coherently coupled. The NEE calculation shown in panel (B) reveals several additional features marked (a), (b) and (c) in the vicinity of the main peaks. These are attributed respectively to the unbound HH/HH, mixed (LH/HH) and bound LH/LH two-excitons and are missed in the lower-level TDHF theory (panel A). The second column represents the calculations for the XRLR polarization configuration. This eliminates the diagonal peaks in the TDHF (panel C). Consequently, in the NEE calculation (panel D), the features (m) and (c) arising respectively from bound HH/HH and LH/LH two-excitons are better resolved, compared to XXXX.
The corresponding SkIII (Ω3,Ω2,t1) signals are shown in the right two columns. Panels (E) and (F) represent XXXX spectra. In (E), TDHF contributions (h), (b), (e) and (f) from HH/HH, LH/LH, LH/HH and HH/LH two-excitons respectively, are all present. These dominant TDHF contributions mask the weaker correlation effects in the NEE calculation (panel F). With XRLR polarization (panel G), only two peaks marked (e) and (f) are seen at the TDHF level13. These represent the contributions from mixed (HH/LH) two-excitons. However, the TDHF contribution from either pure HH/HH two-excitons at (Ω3,Ω2) = (eH,2eH) = (0,0) or from pure LH/LH two-excitons at (Ω3,Ω2) = (eL,2eL) = (3.8,7.6) are eliminated. This makes it possible to probe weaker correlation effects beyond TDHF. This is demonstrated in the NEE simulation in panel (H). In addition to the TDHF peaks (e) and (f) (same as panel (G)), we clearly see new features (c), (d), (m) and (n). (m) and (n) coming from pure bound HH two-excitons, and the correlation energy is given by the Ω2 value of these peaks. Similarly, the Ω2 shift of (c) and (d) with respect to eL+eH gives the correlation energy among pure bound LH two-excitons.
These simulations demonstrate how TDHF and higher-order correlation effects may be separated by the SkIII technique using the XRLR polarization configuration. This is not possible in the SkI signal due to the overlap between single-exciton (GSB and ESE) and two-exciton contributions (GSA). SkI and SkIII provide complementary information. SkIII offers a direct look at two-exciton correlations22. This experiment has been recently carried out in a GaAs quantum well23. SkI (Ω3,t2,Ω1), however, can reveal the important relaxation and transport phenomena in semiconductor by varying the signal as a function of t2. SkIII is not sensitive to transport since exciton populations (ρee) are never created.
Computing electron correlation effects, beyond the Hartree Fock level, constitutes a major challenge of many-body theory. It is not possible to visualize the full correlated electronic wavefunctions which live in a high dimensional many-electron space. However, the various peaks of the SkIII signal show the projections of the correlated two exciton wavefunction onto various products of single exciton states. This information is related to electron delocalization and coherences and goes beyond the charge density alone. The unique look into the many-body wavefunctions offered by 2D signals thus provides a direct experimental test for different approximate levels of theory for electron correlations.
Energy-transfer and double-quantum-coherence in photosynthetic complexes
The primary events driving the food-chain are the absorption of sun light by photosynthetic antennae and the subsequent transport of the excitations to reaction centers, where charge-separation triggers a sequence of events that eventually convert the photon-energy into chemical-energy6.
Multidimensional optical techniques can provide a unique probe for the entire energy and charge transfer pathway in a single measurement6,7,24. The FMO complex from photosynthetic green sulfur bacteria made of seven Bacteriochlorophyll a (BChl a) molecules (Fig. 4a) mediates the energy-transport between the primary antennae (the chlorosome) and the reaction center.
Figure 4.
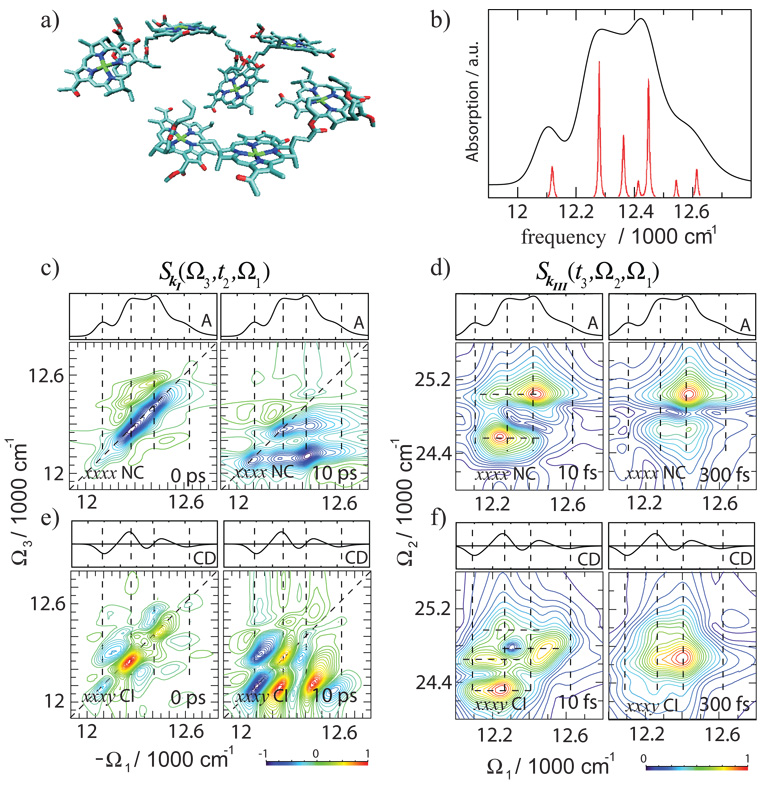
2D signals of the Qy band of the FMO complex from Chlorobium tepidum. a) Arrangement of BChls in FMO, b) absorption (oscillator strength of each exciton is represented by the red line), c) and e) the 2D SkI (Ω1, t2, Ω3) using XXXX (imaginary part) and XXXY (real part) pulse polarizations. The t2 delay time is indicated on each panel. d) and f) absolute value of the 2D SkIII (Ω1,Ω2,t3) signal using XXXX and XXXY pulse polarizations. The t3 delay time is indicated on each panel.
The 700 nm Qy absorption band consisting of 7 single-exciton states (Fig. 4b) has 4 peaks. 2D electronic spectra of the same band have been measured7,24. The simulated 2D SkI (Ω3,t2,Ω1) XXXX signal is depicted in Fig.4c. Diagonal peaks show the main exciton resonances whereas the cross peaks reveal the couplings between the BChl chromophores, and their intensities provide direct signatures of structure (distances between chromophores). The lineshape dynamics of diagonal peaks and the ratio of linewidths along and across the diagonal are direct measures of frequency fluctuation correlation functions. The peak elongation along the diagonal line is a signature of static (inhomogeneous) broadening, indicating that the resonance frequency is the same during t1 and t3.
The energy-transfer pathways can be monitored through the variation of the various peak intensities with the delay t2. At t2=0 the blue region of the signal which represents GSB and ESE is elongated along the diagonal line. The green regions originate from the double-exciton states associated with the ESA. The absorption spectrum is displayed on top of the 2D graphs. At t2=10 ps we see major changes in the peak pattern, due to exciton transport among the excited states. The blue regions around Ω3 =12000 and 12200 cm−1 show emission from the two lowest exciton states after energy relaxation.
Chirality-induced (CI) signals can probe exciton structure, fluctuations and dynamics with a remarkable sensitivity. CI signals are obtained by specific pulse polarization configurations designed to change sign when the sense of chirality is reversed. By design, such signals vanish for non-chiral systems or in racemic mixtures. They are given by the first-order in wavevector corrections (~ 10−2 weaker) to the non chiral (NC) response in the dipole approximation, which is zeroth order in wavevector.
The simulated SkI CI XXXY signal (Fig. 4e) shows a very different pattern than the NC XXXX. At t2 = 0 various peaks are distributed along the diagonal and have alternating signs. The streaks of single-color peaks at constant Ω1 follow the peaks of the circular dichroism (CD) spectrum shown at the top marginal. They reveal single-exciton resonances with higher resolution. Five single-exciton peaks may be identified (compared to four in XXXX). The CI signal shows that the third 12400 cm−1 absorption peak is made of overlapping contributions of several states. These generate a doublet with opposite signs in CD and 2D CI signal. At 10 ps delay the peaks move to the off diagonal region of smaller Ω3 due to population transport. The peaks for a fixed Ω3 alternate signs, as in CD. The resolution is highly improved by the sign alternation.
The d panels in Fig. 4 display the absolute magnitude of SkIII (t3,Ω2,Ω1) (XXXX) signal for two delay times t3, as indicated. Double-exciton resonances are seen along Ω2. FMO has 21 double-exciton states, however only two dominate the signal. Peak positions along Ω1 represent the projections of the double-exciton wavefunction into various products of single-excitons.6 Two single-excitons are seen at t3=10 fs (compare with the absorption given on the top marginal). The dominant double-excitons are localized primarily on this pair of single-exciton states. Variation with t3 reveals the evolution of double-exciton states projected into the space of single-exciton products. At 300 fs one two-exciton state given by a doubly-excited single-exciton mode dominates the signal. The bottom row (f) shows the corresponding CI XXXY signal. It reveals a richer double-exciton pattern; four double-exciton states are now clearly resolved. As in the CI SkI panel (e), the Ω1 axis resembles the CD spectrum. We note that the strongest double-excitons are those associated with the most chiral distribution of pigments. At 300 fs we observe dramatic localization of peaks in the double-exciton and single-exciton space. This dynamics is caused by coherent double-exciton evolution and its interference with single-excitons.
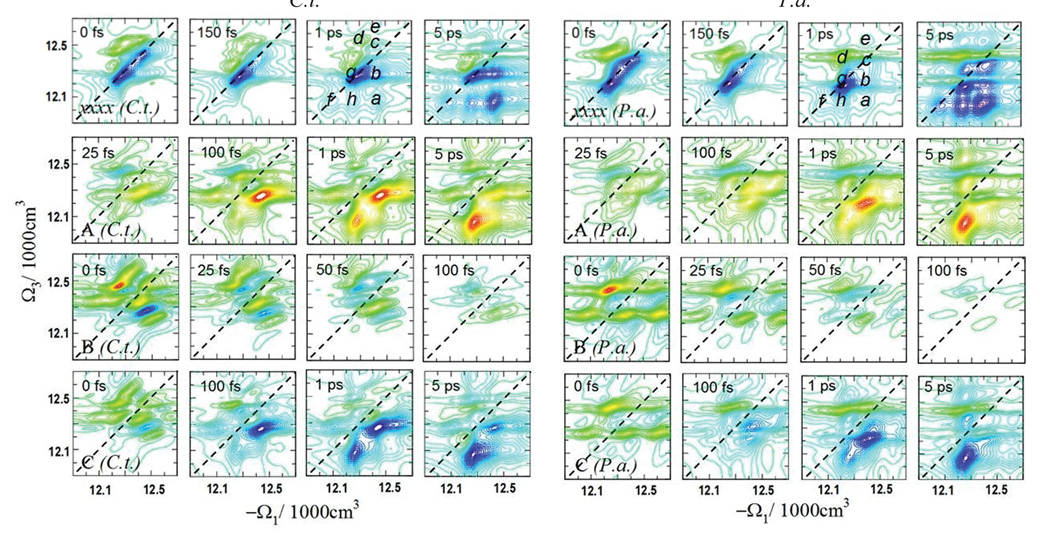
Specific superpositions of SkI signals with various polarization configurations can separate the population transport pathways from coherence oscillations. In Fig. 5 we demonstrate how such NC configurations may be used to distinguish between two species of FMO-containing bacteria: Chlorobium tepidum (C.t.) (left panels) and Prosthecochloris aestuarii (P.a.)25 (right panels). The FMO complexes of both species have an identical pigment configuration. Spectral differences are caused by the different protein environments. In the top row we show snapshots of XXXX signals (as in Fig. 4). In the lower three rows we present three combinations of polarization configurations designed to enhance specific features6,25. Signal A (second row) highlights the exciton coherent and incoherent dynamics during t2 by eliminating static background: it vanishes at 0 delay, then builds up in 100 fs and shows large changes up to 5 ps. This dynamics is further elucidated by the other two, B and C, signals. The B signal (third row) reveals rapid few hundred femtosecond decay of exciton coherences by eliminating all population-including contributions to the signal during t2. At short delays (0–50 fs) it reveals various peaks distributed in anti-diagonal pattern around 12300 cm−1. Between 0 to 50 fs the peak pattern does not change, indicating that the quantum evolutions of density matrix coherences are decoupled within the secular approximation used in our simulations.
Figure 5.
2D SkI (Ω1,t2,Ω3) signals of the Qy band of the FMO complexes from two species of bacteria: Chlorobium tepidum (C.t.) and Prosthecochloris aestuarii (P.a.). A, B and C signals are given by the following superpositions of pulse polarizations:
The C signal (fourth row) highlights exciton hopping during t2. Very strong diagonal peaks are eliminated and the exciton states participating in primary energy transport in the off diagonal regions at 100 fs are clearly seen. Between 150 fs to 5 ps the initial crosspeak configuration changes to reflect the thermal equilibrium of excitons. The exciton states can be identified from peak positions and thus the energy transport pathways can be deduced. The strongest crosspeak indicates that early transport in the region 12500–12570 cm−1 involves excitons 3, 4 and 5 (exciton states are numbered in increasing-energy order). A different peak becomes dominant at long (5 ps) delay indicating energy trapping in the lowest state 1. Intermediate steps can be followed through other off-diagonal peaks. B type signals for the C.t. and P.a. species are very different, whereas the C signals are similar. This indicates that energy transport pathways in the two species are similar, even though the exciton coherences and exciton delocalization patterns are different25.
Attosecond snapshots of valence electronic excitations; resonant x-ray spectroscopy of core excitons
X-ray pulses offer much higher spatial and temporal resolution than possible in the visible regime. 2D x-ray correlation spectroscopy (2DXCS) can provide an attosecond, atomic-scale window into the valence electronic structure and chemical dynamics. Impulsive 100 femtosecond lasers shorter than typical molecular vibrational periods made it possible in the eighties to excite them coherently and observe vibrational wavepackets in real time26. Attosecond x-ray pulses are shorter than valence electron transition frequencies and can similarly excite wavepackets of valence electrons impulsively, as permitted by their broad bandwidth, making it possible to observe motions of electrons in real space and time.
When an x-ray photon is absorbed, a core-shell electron is excited into bound unoccupied or continuum states. Because the core-shell is highly localized, resonances in x-ray absorption spectroscopy (XAS) near the ionization edge provide information about the valence unoccupied states in the vicinity of the nucleus. The core hole is filled within a few femtoseconds either radiatively (x-ray fluorescence) or by an Auger process. The process is accompanied by valence electron excitations. Resonances in the resulting x-ray inelastic scattering (RIXS) and emission (XES) spectra provide information about occupied valence electronic states. Because binding energies of 1s electrons in first-row atoms differ by 60–150 eV, one can selectively probe different regions in a molecule by tuning the incident soft x-ray photon frequency to a particular atom. XAS and XES thus provide atom-specific probes of valence electronic structure of molecules.
Note that in contrast to (off resonant) x-ray diffraction, the spatial resolution in resonant spectroscopy is not directly related to the short wavelength but rather to the highly localized nature of the core orbitals. We next turn to the temporal resolution. Time-resolved XAS employs femtosecond x-ray pulses to resolve nuclear dynamics, and observe transition species in photochemical reactions.16 Attosecond x-ray pulses have been produced by high-harmonic generation (HHG)17,19. Fourth-generation synchrotron sources based on the x-ray free-electron laser (XFEL) can provide 100 fs x-ray pulses of brilliance that exceeds existing x-ray sources by many orders of magnitude. Future developments in technology that will combine the pulse coherence of HHG with the brilliance of XFEL may ultimately result in multiple x-ray pulses with controlled timing, phase and intensity necessary to perform phase-coherent attosecond all-x-ray four-wave mixing measurements.
SkI signals in a molecule where pulses 1 and 2 are tuned to one core transition (say N K edge) and pulses 3 and 4 are resonant with a different transition (say O K edge)27 can show the interference between ESE and GSB quantum pathways that involve only singly core-excited states, and ESA pathways that involve singly and doubly core-excited states. If the frequency of a given core-shell transition is independent of whether another core-shell is excited or not, the ESA contribution interferes destructively with the ESE and GSB and the cross peaks vanish. The coupling between two transitions results in a distinct 2DXCS cross peak pattern. This is in striking contrast to XAS and XES, which are additive i.e. the contribution of two independent transitions is the sum of the individual transitions. 2DXCS provide a direct probe into the electronic and molecular structure through the coupling between core transitions that depends on the distance between the core shells as well as their electronic environment, while retaining the element-specificity of XAS and XES.
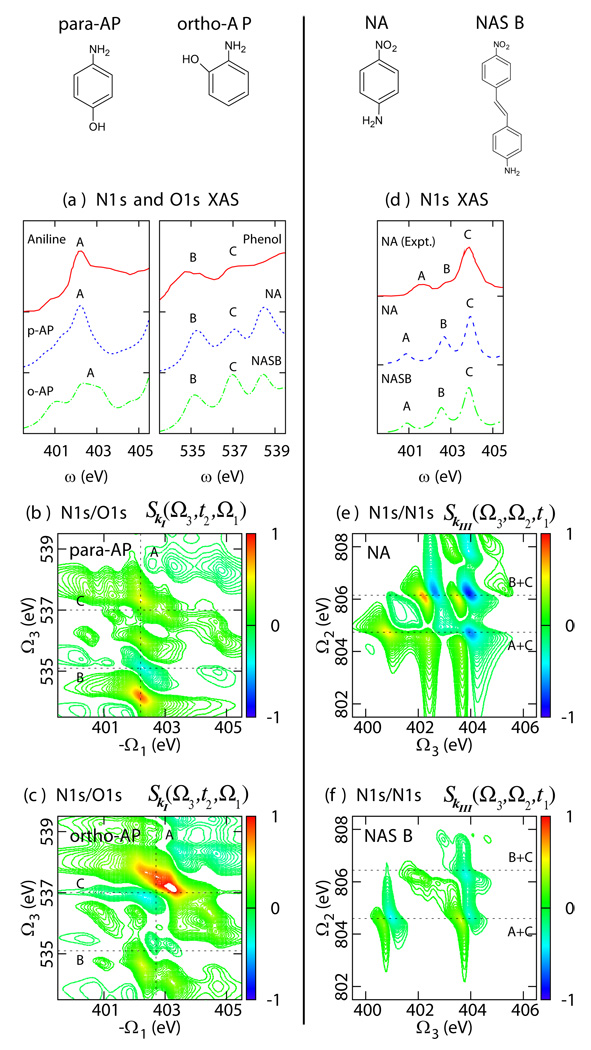
The left column of the Fig. 6 depicts the simulated N1s and O1s XAS and SkI N1s/O1s 2DXCS signal of the para and ortho isomers of aminophenol.27 The first two pulses are tuned to the N K-edge (401 eV) and the other two are near the O K-edge (537 eV). We assume 100 attosecond rectangular pulse envelopes ℰj(ω) with a 6 eV bandwidth centered around the carrier frequencies. The molecular eigenstates were described by singly and doubly-substituted Konh-Sham (KS) determinants in the equivalent-core approximation.27 The calculated N 1s XAS of para- and ortho-aminophenol closely resemble the experimental inner-shell electron energy loss spectrum (ISEELS) spectra of aniline shown in Figure 6a, indicating that the amine XAS only weakly depends on whether the hydroxyl group is in the para or ortho position, or is not present at all. Similarly, the O 1s XAS is virtually independent of the position of the amine group and similar to the ISEELS of phenol. The situation is markedly different for the N/O 2DXCS cross peaks, as the effect of the N 1s transitions on the O 1s absorption strongly depends on the relative position of two atoms. The SkI of the para-aminophenol (Figure 6b) is weaker than and the ortho isomer (Figure 6c) since the amine and hydroxy groups are further apart and their coupling is weaker. Furthermore, the cross peaks provide information about the core excited-state wave functions beyond the dipole coupling available in XAS. In particular, a strong contribution to XAS but weak 2DXCS cross peak indicates localization of the promoted core electron to the atom in resonance. The reverse pattern will indicate the delocalization of the promoted core electron over the two atoms whose core shells are in resonance.
Figure 6.
Left panel: (a) N1s and O1s XAS of para-aminophenol (p-AP, blue) and ortho-aminophenol (o-AP, green) compared to experimental ISEELS of aniline and phenol (red). (b) N1s/O1s SkI (Ω3,t2 = 0,Ω1) 2DXCS of para-aminophenol and (c) ortho-aminophenol. Right panel: (d) N1s XAS of para-nitroaniline (NA, blue) and 4-nitro-4’-aminestilbene (NASB, green) compared to experimental ISEELS of para-nitroanline (red). (e) SkIII (Ω3,Ω2,t1) 2DXCS of para-nitroaniline and (f) 4-nitro-4’-aminestilbene.
Note that the SkI signals shown in Fig. 6 only cover the crosspeak region which is accessible by our pulses (first two resonant with with the N, others with O). However, transitions involving two different or the same core-shells may contribute to the signal provided the chemical shifts (a few eV) are smaller than the pulse bandwidths, and the 2DXCS diagonal and cross peaks spectrally overlap. Due to interference, the latter are usually weaker, and a higher spectral resolution is required in order to separate the cross peaks and extract the couplings.
SkIII signal only contains features induced by the coupling between core transitions. The simulated N1s XAS and SkIII 2DXCS signals of benzene and stilbene disubstituted with the amine and nitroso groups are shown in Figure 6 (right panel).18 The calculated XAS of para-nitroaniline (NA) and 4-nitro-4’-aminestilbene (NASB) are qualitatively similar to the experimental ISEELS spectra of nitroaniline (Figure 6d). This is in accordance with the building-block principle of XANES spectroscopy, which states that the contributions of multiple core shells (in this case, amine and nitoroso) are additive. The N1s SkIII of NA and NASB obtained with four 402.6 eV pulses are shown, respectively, in Figure 6e and 6f. There are three core-excited states with significant dipole strength in the XAS of NA: two correspond to excitation of the amine core electron (states A and B) and one due to the excitation of the nitroso core electron (state C). Despite the much weaker dipole strength of transition A, the strong coupling between the A and C transitions results in an intense 2DXCS feature. Comparison of the equivalent-core orbitals describing the promoted core electron in the singly and doubly excited states18 shows that in state A the promoted core electron is delocalized, hence states A and C are strongly coupled. State B, in contrast, is localized at the amine group, hence, the coupling between states B and C is weaker, and the 2DXCS signal is weak due to negative interference between the ESA1 and ESA2 contributions.
Similar to NA, there are three core-excited states with a significant dipole strength in the XAS of NASB: two due to excitation of the amine core electron (states A and B) and one due to the excitation of the nitroso core electron (state C). Given the similarity of the XAS spectra, the ESA1 and ESA2 contributions to NASB signal are similar to NA, with the strongest feature corresponding to the double-excitation corresponding to states B and C.18 However, overall, the SkIII signal is much weaker than that of NA, indicating that these states are uncoupled in the doubly-excited states. Examination of the ECA orbitals18 shows that indeed, the B state is strongly localized on the amine group. In NASB the amine and nitroso groups are separated by 12.3 A compared to 5.6 A in NA, hence the coupling between the B state (localized on amine group) and the C state (localized on the nitroso group) is much weaker than the coupling between these states in NA. State A is delocalized, and its coupling with state C is significant resulting in the characteristic two cross peak pattern. SkIII is thus highly sensitive to the separation between the core-shell as well as the localization of the corresponding core-excited states.
2DXCS could provide a novel window for studying strongly correlated materials these materials, extending the information gained by standart inelastic x-ray scattering28.
Supplementary Material
Acknowledgement
This research was supported by the National Institutes of Health (GM59230) and National Science Foundation (CHE-0745892)and the Chemical Sciences, Geosciences and Biosciences Division, Office of Basic Energy Sciences, Office of Science, U.S. Department of Energy.
References
- 1.Tanimura Y, Mukamel S. Two-Dimensional Femtosecond Vibrational Spectroscopy of Liquids. J. Chem. Phys. 1993;99:9496–9511. [Google Scholar]
- 2.Mukamel S. Multidimensional Femtosecond Correlation Spectroscopies of Electronic and Vibrational Excitations. Annu. Rev. Phys. Chem. 2000;51:691–729. doi: 10.1146/annurev.physchem.51.1.691. [DOI] [PubMed] [Google Scholar]
- 3.Hochstrasser R, editor. Proc. Nat. Acad. Sci. USA. 2007. Multidimensional Ultrafast Spectroscopy Special Feature. [DOI] [PMC free article] [PubMed] [Google Scholar]
- 4.Jonas DM. Two-dimensional femtosecond spectroscopy. Annu. Rev. Phys. Chem. 2003;54:425–463. doi: 10.1146/annurev.physchem.54.011002.103907. [DOI] [PubMed] [Google Scholar]
- 5.Zhuang W, Hayashi T, Mukamel S. Coherent Multidimensional Vibrational Spectroscopy of Biomolecules; Concepts, Simulations and Challenges. Angew. Chem. 2008 doi: 10.1002/anie.200802644. (in press) [DOI] [PMC free article] [PubMed] [Google Scholar]
- 6.Abramavicius D, Palmieri B, Voronine DV, Šanda F, Mukamel S. Coherent Multidimensional Optical Spectroscopy of Excitons in Molecular Aggregates; Quasiparticle, vs. Supermolecule Perspectives. Chem. Rev. 2008 doi: 10.1021/cr800268n. (in press) [DOI] [PMC free article] [PubMed] [Google Scholar]
- 7.Cho M. Coherent Two-Dimensional Optical Spectroscopy. Chemical Reviews. 2008;108:1331–1418. doi: 10.1021/cr078377b. [DOI] [PubMed] [Google Scholar]
- 8.Ernst RR, Bodenhausen G, Wokaun A. Principles of Nuclear Magnetic Resonance in One and Two Dimensions. Oxford: Clarendon Press; 1998. [Google Scholar]
- 9.Wüthrich K. NMR studies of structure and function of biological macromolecules (Nobel Lecture) Angew. Chem. Int. Ed. 2003;42:3340–3363. doi: 10.1002/anie.200300595. [DOI] [PubMed] [Google Scholar]
- 10.Chernyak V, Zhang WM, Mukamel S. Multidimensional femtosecond spectroscopies of molecular aggregates and semiconductor nanostructures: The nonlinear exciton equations. J. Chem. Phys. 1998;109:9587–9601. [Google Scholar]
- 11.Corkum P, De Silvestri S, Nelson K, Riedle E, Schoenlein R, editors. Ultrafast Phenomena XVI. Springer; 2009. [Google Scholar]
- 12.Mukamel S, Oszwaldowski R, Yang L. A Coherent Nonlinear Optical Signal Induced by Electron Correlations. J. Chem. Phys. 2007;127:221105. doi: 10.1063/1.2820379. [DOI] [PMC free article] [PubMed] [Google Scholar]
- 13.Yang L, Mukamel S. Revealing exciton-exciton couplings in semiconductors using multidimensional four-wave mixing signals. Phys. Rev. B. 2008;77:075335. [Google Scholar]
- 14.Erementchouk M, Leuenberger MN, Sham LJ. Many-body interaction in semiconductors probed with two-dimensional Fourier spectroscopy. Phys. Rev. B. 2007;76:115307. [Google Scholar]
- 15.Li X, Zhang T, Borca CN, Cundiff ST. Many-Body Interactions in Semiconductors Probed by Optical Two-Dimensional Fourier Transform Spectroscopy. Phys. Rev. Lett. 2006;96:057406. doi: 10.1103/PhysRevLett.96.057406. [DOI] [PubMed] [Google Scholar]
- 16.Pfeifer T, Spielmann C, Gerber G. Femtosecond x-ray science. Rep. Prog. Phys. 2006;69:443–505. [Google Scholar]
- 17.Corkum PB, Krausz F. Attosecond science. Nature Physics. 2007;3:381–387. [Google Scholar]
- 18.Schweigert IV, Mukamel S. Double-quantum-coherence attosecond x-ray spectroscopy of spatially-separated, spectrally-overlaping core-electron transitions. Phys. Rev. A. 2008;78:052509. [Google Scholar]
- 19.Kapteyn H, Cohen O, Christov I, Murnane M. Harnessing Attosecond Science in the Quest for Coherent X-rays. Science. 2007;317:775–778. doi: 10.1126/science.1143679. [DOI] [PubMed] [Google Scholar]
- 20.Li Z, Abramavicius D, Mukamel S. Probing Electron Correlations in Molecules by Two-Dimensional Coherent Optical Spectroscopy. J. Am. Chem. Soc. 2008;130:3509–3515. doi: 10.1021/ja0774414. [DOI] [PMC free article] [PubMed] [Google Scholar]
- 21.Rossi F, Kuhn T. Theory of ultrafast phenomena in photoexcited semiconductors. Rev. Mod. Phys. 2002;74:895–950. [Google Scholar]
- 22.Yang L, Mukamel S. Two-Dimensional Correlation Spectroscopy of Two-Exciton Resonances in Semiconductor Quantum Wells. Phys. Rev. Lett. 2008;100:057402. doi: 10.1103/PhysRevLett.100.057402. [DOI] [PubMed] [Google Scholar]
- 23.Stone KW, Gundogdu K, Turner DB, Li X, Cundiff ST, Nelson KA. Two-quantum 2D FT electronic spectroscopy of biexcitons in GaAs quantum wells. Science. 2008 doi: 10.1126/science.1170274. (submitted) [DOI] [PubMed] [Google Scholar]
- 24.Engel GS, Calhoun TR, Read EL, Ahn TK, Mančal T, Cheng YC, Blankenship RE, Fleming GR. Evidence for wavelike energy transfer through quantum coherence in photosynthetic systems. Nature. 2007;446:782. doi: 10.1038/nature05678. [DOI] [PubMed] [Google Scholar]
- 25.Voronine DV, Abramavicius D, Mukamel S. Chirality-based signatures of local protein environments of photosynthetic complexes of green sulfur bacteria. Simulation Study. Biophys. J. 2008;95:4896–4907. doi: 10.1529/biophysj.108.134387. [DOI] [PMC free article] [PubMed] [Google Scholar]
- 26.Rosker MJ, Dantus M, Zewail AH. Femtosecond Clocking of the Chemical Bond. Science. 1988;241:1200–1202. doi: 10.1126/science.241.4870.1200. [DOI] [PubMed] [Google Scholar]
- 27.Schweigert IV, Mukamel S. Probing interactions between core-electron transitions by ultrafast two-dimensional x-ray coherent correlation spectroscopy. J. Chem. Phys. 2008;182:184307. doi: 10.1063/1.2839859. [DOI] [PubMed] [Google Scholar]
- 28.Devereaux TP, Hackl R. Inelastic light scattering from correlated electrons. Rev. Mod. Phys. 2007;79:175. [Google Scholar]
Associated Data
This section collects any data citations, data availability statements, or supplementary materials included in this article.


