

Abstract
Alterations in the blood brain barrier and brain vasculature may be involved in neurodegeneration and neuroinflammation. We sought to determine if vascular remodeling characterized by angiogenic vessels or increased vascular density, occurred in pathologically confirmed Alzheimer's disease (AD) postmortem human brain tissues. We examined brains of deceased, older catholic clergy from the Religious Order Study, a longitudinal clinical–pathological study of aging and AD. The hippocampus, midfrontal cortex, substantia nigra, globus pallidus and locus ceruleus were examined for integrin αvβ3 immunoreactivity, a marker of angiogenesis, and vascular densities. Activated microglia cell counts were also performed. All areas except the globus pallidus exhibited elevated αvβ3 immunoreactivity in AD cases compared with controls. Only in the hippocampus did the ongoing angiogenesis result in increased vascular density compared with controls. Vascular density was correlated with Aβ load in the hippocampus and αvβ3 reactivity was correlated with neurofibrillary tangles in the midfrontal cortex and in the substantia nigra. These data indicate that ongoing angiogenesis is present in brain regions affected by AD pathology and may be related to tissue injury.
Keywords: Blood brain barrier, Vasculature, Alpha v beta 3, Microglia, Neurofibrillary tangles, Amyloid-beta
Introduction
Alzheimer's disease (AD) is a neurodegenerative disorder associated with neuroinflammation, as indicated by activated microglia and elevated levels of pro-inflammatory cytokines (Streit et al. 2004). Some of these cytokines, such as tumor necrosis factor-alpha (TNFα), interleukin (IL)-1β and transforming growth factor-β (TGFβ), are also pro-angiogenic and induce angiogenesis (Pogue and Lukiw 2004; Naldini and Carraro 2005), the formation of new vessels from pre-existing vessels. Inflammatory mediators also increase production of vascular endothelial growth factor (VEGF), a potent angiogenic factor, further stimulating development of new blood vessels (Tarkowski et al. 2002; Schultheiss et al. 2006). Consistent with this assumption, AD subjects have elevated levels of TGFβ and VEGF in the cerebrospinal fluid compared with control subjects (Kalaria et al. 1998; Tarkowski et al. 2002; Zetterberg et al. 2004), implicating possible angiogenesis in AD.
Amyloid-β (Aβ) plaques and neurofibrillary tangles (NFT), the pathological lesions found in the mesial temporal and neocortex of AD brains (Braak and Braak, 1997), may also be angiogenic. Aβ peptides have been shown to possess pro-angiogenic (Cantara et al. 2004; Boscolo et al. 2007) as well as anti-angiogenic activity (Paris et al. 2004b) in vitro. However, VEGF has been found co-localized to Aβ plaques (Yang et al. 2004). Basic fibroblast growth factor, another angiogenic factor, accumulates in areas of tissue damage in association with NFT and Aβ (Siedlak et al. 1991). Moreover, thrombin, which builds up within the vessel wall of AD subjects (Akiyama et al. 1992), potentiates the effects of VEGF by inducing expression of VEGF receptors (Tsopanoglou and Maragoudakis 1999). Vagnucci and Li (2003) proposed that AD is mediated by pathological angiogenesis, suggesting that a cycle of angiogenic events contributes to Aβ accumulation and neuronal death (Vagnucci and Li 2003).
Angiogenic vessels differ from patent vessels in that they have numerous fenestrea, widened inter-endothelial junctions, abnormal endothelial cell shapes, and abnormal basement membranes (Carmeliet and Jain 2000). Increased vessel diameter, aberrant vessel branching, enhanced endothelial cell proliferation and an irregular basement membrane has been observed in animal models of AD (Nakajima et al. 2003; Meyer et al. 2008) as well as AD patients (Kalaria 1992). Repeated stimulation with VEGF results in vessel leakiness followed by angiogenesis (Croll et al. 2004). Furthermore, long-term exposure to VEGF may result in defective vessels; i.e. pathological angiogenesis (Nagy et al. 2008). Such vascular abnormalities may also contribute to impaired blood flow, reduced nutrient delivery (Jain 2001), and entry of otherwise restricted infiltrates (Kalaria 1992).
Angiogenic vessels can be distinguished from normal vessels by using antibodies to integrin αvβ3, a dimeric glycoprotein expressed on the endothelial cell surface. Integrin αvβ3 is absent on patent vessels, but dramatically increased on angiogenic vessels (Brooks 1996; Folkman 2004). Antibodies to β3 or αvβ3 have used to measure angiogenesis in a variety of conditions including abdominal aneurysm, ovarian cancer, retinopathy, myocardial infarctions, and cortical stroke (Wei et al. 2001; Paik et al. 2004; Lahdenranta et al. 2007; Kalinowski et al. 2008; Willmann et al. 2008). While αvβ3 has been reported to be expressed on oligodendritic precursor cells, αvβ3 expression was only detected between day 2 and 10 of tissue culture (Milner et al. 1997). However, αvβ3 expression appears to be upregulated in a variety of cultured cells (Horton 1990). Examination of integrin expression in the brain indicates that αv may be expressed in the brain in conjunction with other integrin β subunits, but β3 is not expressed in the adult brain (Pinkstaff et al. 1999). An older study failed to find microglial reactivity to a β3 antibody in postmortem brain tissues from AD patients and controls (Akiyama et al. 1991). Recently, Schultheiss et al. used an antibody against β3 to detect angiogenic vessels in an APP23 transgenic mouse model of AD (Schultheiss et al. 2006). We have also used a β3 antibody to identify angiogenic vessels in a 6-hydroxydopamine model of PD (Carvey et al. 2005). A more specific antibody that recognizes an epitope present when only when αvβ3 are associated was used in this study. The aim of this study was to determine whether angiogenic vessels, identified by αvβ3 reactivity, were present in brain regions affected by AD pathology and to determine if αvβ3 reactivity was associated with neuroinflammation.
Methods
Subjects
This study included subjects from the Religious Orders Study, a longitudinal clinical-pathological study of aging and AD (Bennett et al. 2006). Participants of the Religious Order Study are older catholic clergy, who enroll without known dementia and agree to annual follow-up exams and brain autopsy at time of death. Annual exams include medical history, neurological examination and neuropsychological performance testing and diagnostic classification. As part of the cognitive evaluation, patients receive a yearly Mini-Mental State Examination (MMSE) (Folstein et al. 1975). This study was approved by the Institutional Review Board at Rush University Medical Center.
Subjects were placed in AD and control groups based on NIA/Reagan criteria for a neuropathological diagnosis of AD (NIA Working group 1997). National Institute on Aging (NIA)/Reagan criteria indicate the likelihood that a diagnosis of dementia can be explained by AD pathological changes. This criterion uses the consortium to establish a registry for Alzheimer's disease (CERAD) based plaque score, which examines neocortical neuritic plaque density, and Braak stage, which is based on density and distribution of tangles. All eight subjects in the AD group had intermediate to high likelihood of AD, which indicates a Braak III/IV or V/VI and a moderate or severe plaque neocortical density; whereas the seven subjects in the control group had a low likelihood of pathological AD. A board-certified neuropathologist reviewed all sections for diagnosis and provided sections for this study in a blinded fashion
Brain tissue and postmortem data
The mean postmortem interval (PMI) was 10.1 h (SD = 9.1). Brains were removed, dissected and processed as previously described (Bennett et al. 2006). Tissues from the hippocampus, midfrontal cortex, substantia nigra pars compacta (SNpc), and locus ceruleus were dissected into 0.5-cm-thick blocks after 48–72 h fixation in 4% paraformaldehyde, and stored in cryoprotectant. Paraffin-embedded blocks were cut sequentially into 40 μm coronal sections and used for integrin αvβ3 and activated microglia immunohistochemistry. Additional 40 μm coronal sections from the mid-SNpc were used for paired helical filament (PHF) immunohistochemistry (Schneider et al. 2006); and 20 μm sections from the middle frontal cortex (Brodman area 9/46) and hippocampus (CA1/subiculum) were used for both PHF and Aβ immunohistochemistry as previously described (Bennett et al. 2004).
Immunohistochemistry
Sections underwent antigen unmasking and were incubated with primary antibody overnight at room temperature. Antibody AT8, (1:1,000, Polymedco, Cortlandt Manor, NY) to paired helical filament tau, was used to label NFTs in the neuronal cell body. Prior to NFTs immunostaining, SNpc sections were first bleached of neuromelanin with 0.25% potassium manganese peroxide and 5% oxalic acid (Schneider et al. 2006). MO0872 (1:100; Dako, Carpentaria, CA, USA), an antibody that reacts with both the 1–40 and 1–42 length amyloid peptide fragments was used to identify Aβ. Activated microglia were determined using an antibody against MHC Class II molecule located on the cell surface (HLA-DR, -DQ, -DP, Clone Cr3/43, 1:100, Dako, Glostrup, Denmark). An antibody that recognizes an epitope present when the αv and β3 integrin subunits are associated (Clone BV3; 1:100; Abcam; Cambridge, MA) was used to label endothelial cells undergoing angiogenesis. This antibody is specific for the αvβ3 integrin heterodimer and does not recognize other β3 integrins such as platelet αIIbβ3. Immunostaining was performed using the avidin–biotin–peroxidase method (ABC Elite; Vector, Burlingame, CA) for tau, Aβ, activated microglia, and integrin αvβ3 with 3,3 diaminobenzidine (DAB) as the chromagen for color development.
Assessment of pathologic changes
NFTs were identified as positive in the presence of intraneuronal staining and fibrillar morphology. NFT counts in the SNpc were performed using four equidistant serial sections as previously described (Schneider et al. 2006). Briefly, total NFTs within the midnigra were counted using the optical dissector and StereoInvestigator. Tangles were counted within the thickness of the tissue section under an Olympus 60× objective using the unbiased three-dimensional counting adapted from Gunderson (Williams and Rakic 1988). Areas of interest were delineated at low power magnification. Total magnification was increased to 600× and the motorized stage randomly sampled using 150 × 150 μm counting frames within the delineated region. Quantification of hippocampal and midfrontal NFTs were performed as previously described (Bennett et al. 2004). Briefly, we used 20 μm sections, on a Leica DMRBE microscope and a computer (Millennia Mme; Micron Electronic Inc, Boise, Idaho) equipped with StereoInvestigator software version 5.00 (MicroBrightField Inc, Colchester, VT). The area of interest was delineated, and total number of NFTs was determined to calculate the density of NFTs within that region.
Quantitative analysis of Aβ was performed as previously described (Mitchell et al. 2000). A systematic random sampling scheme was used to capture color images from each sampling site and converted to a grayscale images. Percentage area occupied by Aβ immunoreactive pixels was calculated by Object-Image 1.62p15. The percentages of each area were averaged for a composite measure of Aβ load (Bennett et al. 2004).
Microglia cell counts were assessed in the hippocampus, midfrontal cortex, SNpc and locus ceruleus. An Olympus BX60 microscope with a computer-controlled, motorized stage, high sensitivity HV-C20 CCD video camera (Hitachi, Japan) and StereoInvestigator software version 5.1 (MicroBrightField, Colchester, VT) was used to estimate microglia cell counts and volume of the sampling region in equidistant serial sections. Activated microglia were identified using a scale established in (Kanaan et al. 2008). An Olympus BX60 microscope with a computer-controlled, motorized stage, high sensitivity HV-C20 CCD video camera (Hitachi, Japan) and StereoInvestigator software version 5.1 (MicroBrightField, Colchester, VT) was used to estimate microglia cell counts and volume of the sampling region in equidistant serial sections. The number of activated microglia were counted within the thickness of the tissue section under an Olympus 100× objective using the unbiased three-dimensional counting adapted from Gunderson (Williams and Rakic 1988). The areas of interest were delineated at low power magnification prior to random sampling. Approximately 20–25% of the region was quantified using a 200 × 200 μm counting frame. Due to the limited number of human postmortem brain tissue sections, between three to four sections were available for each subject. Therefore, the total number of activated microglia and the volume of tissue evaluated were obtained from StereoInvestigator and divided to obtain a density measurement. Density of activated microglia was expressed as total number/mm3.
Integrin αvβ3 immunoreactivity was visualized using a Leitz Fluovert FU microscope (Lietz; Wetzlar, Germany) in the hippocampus, midfrontal cortex, SNpc and locus ceruleus. Within each region, the entire tissue section was scanned for angiogenic vessels in a 4 × 5 mm counting frame at 25× magnification. Pilot studies indicated that vessels had a range of staining. Rather than rely on an arbitrary decision as to what constituted an angiogenic vessel, or institute a semi-quantitative scale for rating positive vessels, an optical density protocol was used. Images of a slice of interest were taken using brightfield microscopy and the image was opened in NIH image (Image J 1.36b; National Institutes of Health, Bethesda, MD). All longitudinal blood vessels were identified. Vessels perpendicular to the slice (cross-sectional vessels) were often stained, but were not counted to avoid any false positives due to edge effects around potential holes in the tissue. The longitudinal vessels were traced using the tools available in NIH Image and the length, width, area and integrated density were calculated for each vessel. The tracing of the vessel was moved to an area of the tissue free of vessels and pigmented cells, and the density was then taken as a background. The background density was subtracted from the vessel density. Then, the density of all vessels for each brain area for an individual subject was averaged across multiple slices to obtain a composite optical density for each brain area for each subject.
Vessels were counted in the same images used above for optical density measurements. As with optical density determinations, only longitudinal vessels, regardless of length, were counted. Each branching vessel was counted as an individual vessel. Vessels were counted in the entire tissue section on a 2D plane of the saved image. Since vessels were not counted within the thickness of the tissue, a volume measurement could not be assessed. However, this method reduces the possibility of counting cross-sectional or non-continuous vessels multiple times though the thickness of the section. In order to determine the vascular density, the number of vessels was totaled across multiple slices for each patient in each brain area. The total number of vessels was then divided by the total area evaluated for vessel number to yield a measure of number/mm2.
Statistics
Student's t tests were utilized to determine within group and between group variations for the dependent variables integrin αvβ3 immunoreactive intensity and total vessel numbers. AD and control means were compared within each of the four regions of the brain for both variables. T tests were also conducted to determine significant differences for activated microglia density, Aβ, MMSE, age at death, and PMI. Since the number of NFTs failed the test for normal distribution, a Mann–Whitney U test was used for mean comparisons of NFTs.
Spearman correlations were used to determine the relationships between integrin αvβ3 immunoreactivity with pathology, including NFTs and Aβ, and demographics including age in each region. Similar correlations were made with total vessel numbers. All t-tests and spearman correlation analyses were performed using SPSS 13.0 software (Chicago, IL, USA).
Results
Demographics
Subjects were grouped according to the NIA/Reagan Criteria as detailed in the Methods. The mean age at death was 82.6 ± 6 years. AD cases were slightly older, but not significantly different from control patients (Table 1). The average PMI was 10.1 h. Although PMI was longer in controls (t = −2.4, p < 0.05), it was not related to integrin αvβ3 immunoreactivity or vascular density. Overall, AD cases had lower MMSE scores, though it was not statistically significant (t = −1.7, p = 0.06).
Table 1.
Demographics of control and Alzheimer's disease subjects
| Control | Alzheimer's disease | |
|---|---|---|
| Gender | Male 4/female 3 | Male 3/female 5 |
| Age | 79.5 ± 2.6 | 85.2 ± 1.6 |
| Postmortem interval | 15.5 ± 4.0* | 5.4 ± 1.2 |
| Mini-mental score | 25.9 ± 1.85 | 16.88 ± 4.8 |
| NIH/Reagan diagnosis | ||
| Low likelihood | 7 | 0 |
| Intermediate-high likelihood | 0 | 8 |
Data shown as average ± SEM
p < 0.05
Pathological changes
In both the hippocampus (t = 2.5, p < 0.05) and midfrontal cortex (t = 3.8, p < 0.01), Aβ was significantly greater in AD subjects compared with controls (Table 2). Hippocampal (U = 2, p < 0.05) and midfrontal (U = 4.5, p < 0.01) NFTs were also significantly greater in AD subjects compared with controls. In the SNpc, AD cases had greater numbers of NFTs (U = 7.0, p < 0.01), consistent with the idea that AD pathology often involves neurofibrillary degeneration in the nigra (Schneider et al. 2006) (Table 2).
Table 2.
Neuropathological changes of control and Alzheimer's disease subjects
| Control | Alzheimer's disease | |
|---|---|---|
| CA1 Hippocampus | ||
| NFTa | 2.03 ± 1.9 | 25.72 ± 9.4* |
| β amyloida | 0.05 ± 0.05 | 2.94 ± 0.95* |
| Activated microgliab | 1788 ± 337.3 | 2293.4 ± 647.4 |
| Midfrontal cortex | ||
| NFTa | 0 | 12.9 ± 7.2** |
| β amyloida | 0.14 ± 0.12 | 4.4 ± 1.1** |
| Activated microgliab | 516.1 ± 231.4 | 1408.9 ± 232.4* |
| SNpc | ||
| NFTa | 0 | 4,549 ± 1,527** |
| Activated microgliab | 743.8 ± 726.6 | 1881.9 ± 318* |
| Locus ceruleus | ||
| Activated microgliab | 2006.3 ± 418.9 | 3868.1 ± 636.8* |
Data shown as average ± SEM
See text for derivation
Number/mm3
p < 0.05,
p < 0.01
Microglia are shown in Fig. 1. Note that controls generally have fewer stained cells and when stained possess a ramified appearance with light staining of the fibers and little cytoplasmic staining. The density of activated microglia was higher in AD subjects in the midfrontal cortex (t = 3.2, p < 0.05), SNpc (t = 2.3, p < 0.05) and locus ceruleus (t = 2.3, p < 0.05), but not in the hippocampus (Table 2). Note that many of the microglia in the hippocampus from AD patients maintained a ramified appearance with fine immunoreactive fibers (Fig. 1). Tissue atrophy may account for the changes in activated microglia cell density in the AD subjects, but we found that the volume of tissue assessed in the hippocampus (t = 0.38, p > 0.05), midfrontal cortex (t = 0.91, p > 0.05), SN (t = 0.52, p > 0.05) and locus ceruleus (t = 0.87, p > 0.05) did not differ between control and AD subjects.
Fig. 1.
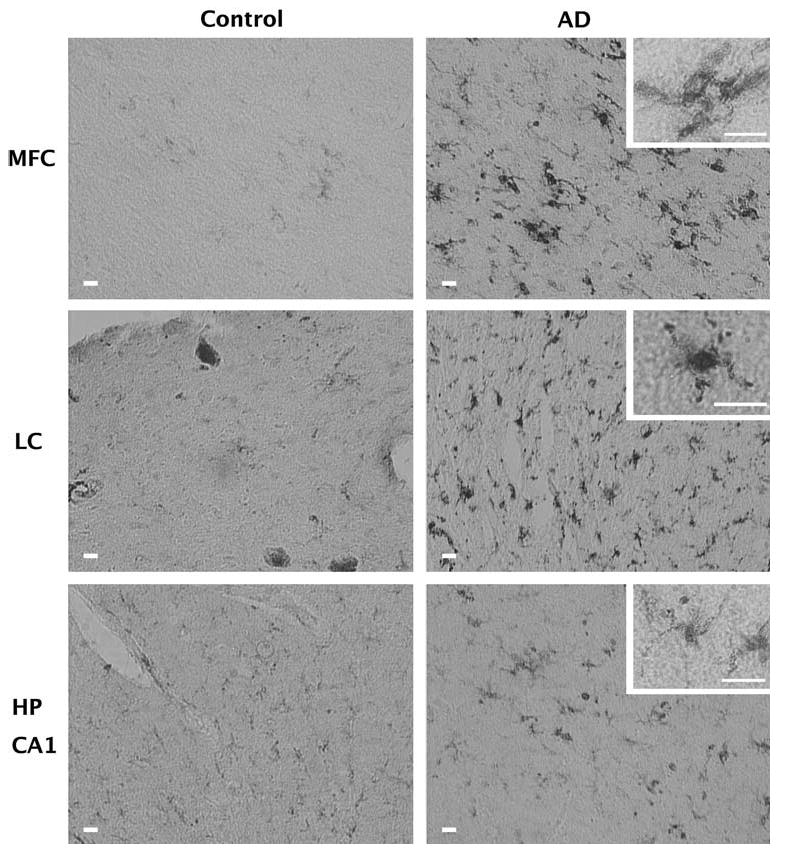
Activation of microglia in AD. Shown is the immunoreactivity of tissue from the midfrontal cortex (MFC), locus ceruleus (LC), and hippocampus (HP CA1) of control and Alzheimer's subjects to an antibody that recognizes the MHC Class II antigen. This antigen is up regulated on the cell surface of activated microglia. All bars indicate 20 μm. Increased numbers of activated microglia are observed in the MFC, and LC of AD subjects compared with controls. In addition, many microglia from the AD subjects have a morphology (see insets) characteristic of activated microglia. In the Hippocampus, there was no difference between control and AD and there was a greater prevalence of the ramified morphology characteristic of unactivated microglia
Angiogenesis
In order to determine whether vessels were actively undergoing angiogenesis, we assessed integrin αvβ3 immunoreactivity, an adhesion molecule present on endothelial cells of angiogenic vessels (Brooks 1996). Regions susceptible to degeneration in AD cases showed high levels of integrin αvβ3 immunoreactivity whereas control cases had little to no αvβ3 immunoreactivity (Fig. 2). In the hippocampus of AD cases, αvβ3 immunoreactivity was significantly increased compared with controls (t = 1.8; p < 0.05; Fig. 2). Similar findings were observed in the midfrontal cortex (t = 2.5; p < 0.05), SNpc (t = 3.9; p < 0.01) and locus ceruleus (t = 1.8; p < 0.05). There was no evidence of angiogenesis in the globus pallidus (Fig. 3), an area not associated with AD pathology (Brilliant et al. 1997).
Fig. 2.
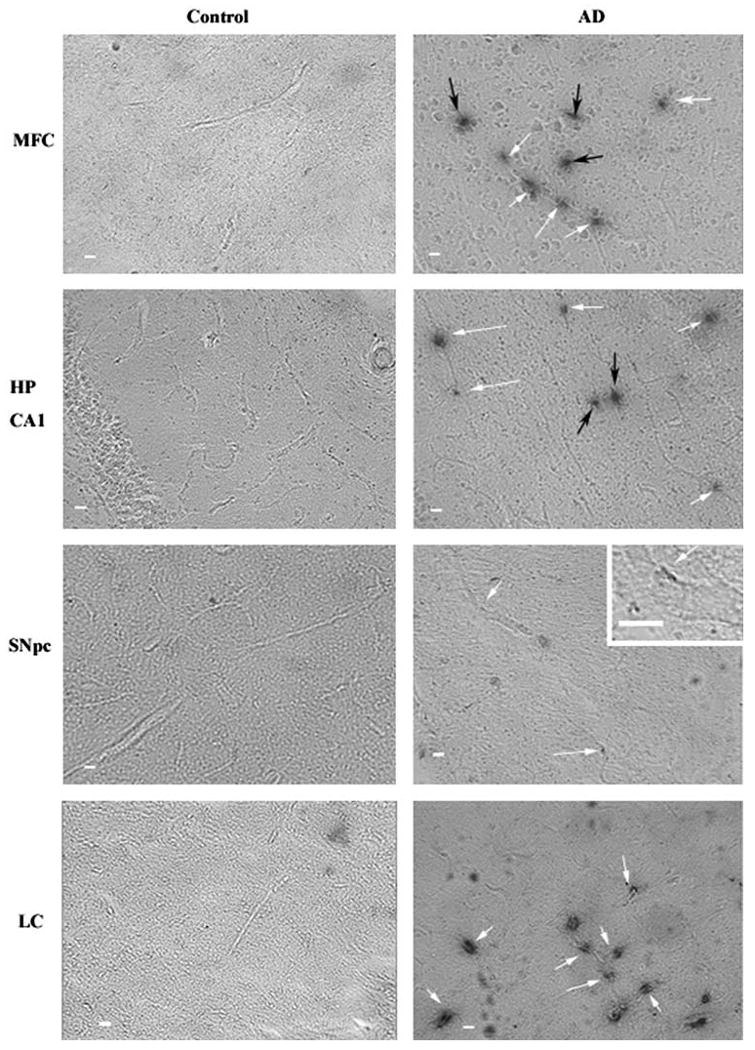
Intensity of αvβ3 staining in Alzheimer's disease tissue samples. Slices from human postmortem brain tissue were labeled with mouse anti-human integrin αvβ3 antibody and visualized with the chromagen DAB. All images are at ×5 magnification and inset images are ×25 magnification. Scale bar = 10 μm. Arrows indicate αvβ3 positive vessels in control and Alzheimer's disease (AD). Integrin αvβ3 immunoreactivity could be observed in the midfrontal cortex (MFC), hippocampus (HP CA1), SNpc and locus ceruleus (LC) of AD subjects. White arrows indicate αvβ3 staining along a longitudinal vessel. Black arrows indicate staining occurring without an apparent longitudinal vessel. While the black arrows likely indicate cross sectional vessel perpendicular to the plane of the image, they were not counted in the quantitation of vessels in Fig. 3 avoid any false positives due to edge effects around potential holes in the tissue
Fig. 3.
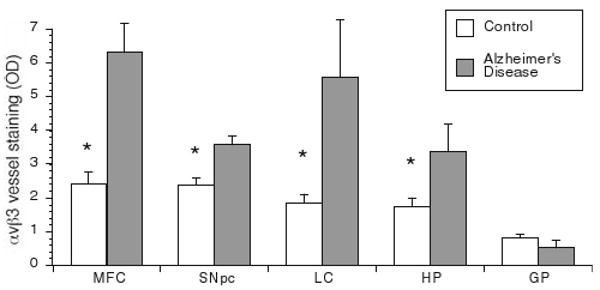
Intensity of αvβ3 vessel staining in postmortem human brain tissue samples. Tissue slices were labeled with αvβ3 as in Fig. 2 and the optical density of longitudinal vessels was measured as described in the methods. Shown is the mean optical density (OD) of vessels for control and AD subjects ± SEM for each brain area. Integrin αvβ3 immunoreactivity is significantly greater in the hippocampus (HP), midfrontal cortex (MFC), SNpc and locus ceruleus (LC) of AD subjects compared with control subjects. There was no difference in αvβ3 staining of vessels between control and AD subjects in the globus pallidus (GP). Data is expressed as Mean ± SEM. *Statistical significance was determined using Student's t tests for mean comparison (p < 0.05)
We also determined the total numbers of vessels in each brain region since it is likely that increased vascular density might reflect ongoing angiogenic activity (Brooks 1996). The hippocampus was the only region that exhibited increased vascular density compared with controls (t = 2.2, p < 0.05). The hippocampus, one of the earliest areas affected in AD (Braak and Braak 1995), was the only region to exhibit both αvβ3 immunoreactivity and increased vascular density (Fig. 4).
Fig. 4.

Total number of vessels in postmortem human tissue samples. Vessel numbers were counted under bright field microscopy. Density measurements were obtained by dividing total number of vessels by the area of interest (refer to Methods). Although a change in vessel number was observed in AD subjects, it was only significantly higher in the hippocampus. Data is expressed as Mean ± SEM. *Statistical significance was determined using Student's t tests for mean comparisons (p < 0.05)
To lessen the possible confounding effect of tissue atrophy on vascular density in the hippocampus, we determined that the area of the hippocampus did not differ between control and AD subjects (1.63 μm2 ± 0.21 and 1.88 μm2 ± 0.0.26, respectively; t = 0.72, p > 0.05). Interestingly, vascular density of AD subjects was not significantly different from control in the midfrontal cortex, SNpc, locus ceruleus and global pallidus (Fig. 4). Likewise, the area evaluated for vascular density in the midfrontal cortex (t = 0.7, p > 0.05), SNpc (t = 0.3, p > 0.05) locus ceruleus (t = 1.9, p > 0.05) and globus pallidus (t = 0.26, p > 0.05) did not differ between control and AD subjects.
Angiogenesis and AD brain pathology
To determine if measures of angiogenesis correlated with pathology, we used Spearman correlations to compare αvβ3 densities and vessel numbers with NFTs, Aβ load, and activated microglia. The relationship between NFT and integrin αvβ3 immunoreactivity (ρ = 0.2, p = 0.28) or vascular density (ρ = 0.47, p = 0.07) did not reach statistical significance in the hippocampus (Table 3). However, there was a strong positive relationship between Aβ load and vascular density (ρ = 0.5, p < 0.05) in the hippocampus. Conversely, in the midfrontal cortex, integrin αvβ3 immunoreactivity was correlated to NFTs (ρ = 0.45, p < 0.05), but not Aβ load (ρ = 0.42, p = 0.06). In the SNpc, NFTs (ρ = 0.69, p < 0.01) were positively associated with integrin αvβ3 immunoreactivity (Table 3). The number of activated microglia was not related to angiogenic activity as assessed by integrin αvβ3 or vascular density in any disease-susceptible areas (Table 3). These data indicate that various features of AD pathology are associated with vascular remodeling, but the strength of the association varies by pathological marker and brain region.
Table 3.
Spearman correlations (rho) between angiogenesis markers and pathological variables
| NFTa | β amyloid densitya | Activated microgliaa | |
|---|---|---|---|
| CA1 Hippocampus | |||
| αvβ3b | 0.2 | 0.029 | 0.34 |
| Vascular densityc | 0.47 | 0.53* | 0.255 |
| Midfrontal cortex | |||
| αvβ3b | 0.45* | 0.414 | 0.29 |
| Vascular densityc | 0.21 | 0.24 | 0.4 |
| SNpc | |||
| αvβ3b | 0.69** | NA | 0.236 |
| Vascular densityc | 0.13 | NA | 0.31 |
| Locus ceruleus | |||
| αvβ3b | NA | NA | 0.22 |
| Vascular densityc | NA | NA | 0.056 |
See text for derivation
Optical density
Number/mm2
p < 0.05;
p < 0.001
Cognitive function
In a clinical setting, AD diagnosis is determined by a detailed clinical history with evidence of decline and neurological examination, which includes cognitive testing. In this study, persons with pathologic AD had lower MMSE scores, but the difference was not statistically significant (t = −1.8, p = 0.06; Table 1), possibly due to the small sample size. It is also well established that persons without cognitive impairment may fulfill neuropathologic criteria for AD. In accordance with previous findings (Bennett et al. 2004; Schneider et al. 2007), MMSE score was related to tangles and Aβ. In addition, we found that MMSE was related to the number of activated microglia in the hippocampus and midfrontal cortex (Table 4), suggesting that inflammation may play a role in impaired cognitive function (Table 4). The correlation between integrin αvβ3 immunoreactivity and vascular density with MMSE score was not statistically significant (Table 4).
Table 4.
Spearman correlations (rho) between neuropathological changes and MMSE
| MMSE | |
|---|---|
| CA1 Hippocampus | |
| NFTa | −0.52* |
| β amyloida | −0.7** |
| Activated microgliab | −0.79** |
| αvβ3c | −0.4 |
| Total vesselsd | −0.2 |
| Midfrontal cortex | |
| NFTa | −0.6** |
| β amyloida | −0.6* |
| Activated microgliab | −0.625** |
| αvβ3c | −0.04 |
| Total vesselsd | −0.06 |
| SNpc | |
| NFTa | −0.38 |
| Activated microgliab | −0.33 |
| αvβ3c | −0.31 |
| Total vesselsd | −0.046 |
| Locus ceruleus | |
| Activated microgliab | −0.45 |
| αvβ3c | −0.13 |
| Total vesselsd | −0.141 |
See text for derivation
Number/mm3
Optical density
Number/mm2
p < 0.05;
p < 0.01
Conclusion
In 1907, Alois Alzheimer described a brain pathology involving endothelial proliferation and neovascularization in his AD patients (Alzheimer et al. 1995). In accordance with Alzheimer's early observations, in this study we showed that angiogenic vessels, detected using integrin αvβ3 immunoreactivity, are present in the hippocampus, midfrontal cortex, SNpc and locus ceruleus of AD brains (Fig. 2, 3), all regions that are susceptible to AD pathology. This is also consistent with the APP23 transgenic animal model of AD, where β3 positive vessels were increased in disease susceptible regions (Schultheiss et al. 2006).
The finding of ongoing angiogenesis is not surprising considering AD has been linked to inflammation, and inflammatory mediators including TNFα, IL1β, IL-6, and IL-8 also possess pro-angiogenic properties (Pogue and Lukiw 2004; Naldini and Carraro 2005). Furthermore, angiogenic mediators angiopoietin-2 and VEGF are released by microvessels isolated from AD brains in vitro (Thirumangalakudi et al. 2006). VEGF is also released by astrocytes in response to hypoxia (Schmid-Brunclik et al. 2008), which has been proposed to be a contributing factor in AD (Zlokovic 2008). AD subjects also have elevated levels of angiogenic factors VEGF and TGFβ in the cerebrospinal fluid compared with controls (Kalaria et al. 1998; Tarkowski et al. 2002; Zetterberg et al. 2004). Though the presence of VEGF in the AD brain may be indicative of angiogenesis it is not necessarily specific for angiogenesis. The functions of VEGF are much broader as it can also be released during axonal outgrowth, play a role in cell survival (Carmeliet and Storkebaum 2002), cause vascular leak (Nagy et al. 2008), and is a chemotactic factor for macrophages and granulocytes (Sato et al. 2008). However, the presence of a significant increase in αvβ3 immunoreactivity in the AD subjects of this study complements the VEGF literature and argues for ongoing angiogenesis in AD.
In contrast, others have suggested that angiogenesis is aberrant in AD resulting in hypoxia (Zlokovic 2008). Such findings are surprising given that hypoxia can trigger VEGF expression (Schmid-Brunclik et al. 2008) leading to angiogenesis. However, it should be pointed out that in tumor biology, angiogenic vessels can be pathologic allowing the passage of plasma proteins from the periphery into the tumor increasing interstitial pressure (Jain 2005; Nagy et al. 2008). Furthermore, the pathologic angiogenic vasculature within the tumor fails to properly deliver macromolecules and oxygen, exacerbating a hypoxic environment (Jain 2005). It is possible that a similar mechanism may be at work in disease susceptible areas of AD subjects. Angiogenesis may be constantly stimulated due to neuroinflammation or hypoxia, leading to formation of abnormal, angiogenic vessels unable to properly deliver nutrients and oxygen to the degenerating area.
To determine if ongoing angiogenesis was associated with a resultant increase in vascular density, the number of vessels was counted in each brain area assessed for αvβ3 immunoreactivity. There was an increase in vascular density in the hippocampus of AD subjects compared with control subjects, suggesting that angiogenesis earlier in the disease resulted in vessel formation. We do not know whether these vessels are fully formed, patent vessels or pathologic. A limitation of this data is that we did not use a vessel specific stain because we did not want to interfere with the assessment of optical density of the vessel resulting from αvβ3 immunohistochemistry. Thus, vessels were identified using bright field microscopy and we may have missed vessels that would have been visible if stained. Vascular density measures were not confounded by tissue atrophy since there was no difference in the areas assessed between control and AD subjects. However, we cannot rule out the possibility that the vessel density may be under estimated since cross-sectional vessels are not as easily identified and were not counted for either group. Paris et al. (2004a, b) found a reduction in vascular density in the hippocampus and cortex in a 9-month old transgenic APPsw mouse model of Aβ amyloidosis compared to wild-type (Paris et al. 2004a). Angiogenesis may not reach completion due to the suppression of the mesenchyme and growth arrest-specific homeobox genes required for vascular cell differentiation and remodeling, leading to premature vessel regression and improper formation of the blood brain barrier (Deane and Zlokovic 2007; Zlokovic 2008). In contrast, Meyer et al. (2008) found altered morphology of the brain vasculature in APP23 transgenic mice consistent with ongoing angiogenesis (Meyer et al. 2008). These investigators infused a resin into a mouse brain to make a 3-D corrosion cast of the brain vasculature and found “holes” in the APP23 vasculature corresponding to Aβ plaques with an enhanced vasculature surrounding the holes. Such findings suggest that simply counting vessels without accounting for the “holes” may lead to an underestimation of vascular changes (Meyer et al. 2008).
In our study, we observed an increase in αvβ3 immunoreactivity and vessel number in the hippocampus, one of the first areas to show pathologic changes indicative of AD. Thus, chronic angiogenesis may contribute to new vessel formation given enough time. However, it is not clear if the active angiogenic process observed in the midfrontal cortex, SNpc, and locus ceruleus would, given enough time, resolve into new, patent vessels. Angiogenesis is a dynamic process and newly created vessels may be removed or pruned if they have failed to attract supporting pericytes that stabilize the vessel (Cheresh and Stupack 2008). It may be that the angiogenic vessels in these areas vessels are stuck in an angiogenic phenotype (Thirumangalakudi et al. 2006), constantly sprouting and regressing, resulting in no net change in vessel density.
Because angiogenesis is a dynamic process, the lack of an increase in vessel number is not necessarily an indicator of a lack of angiogenesis. However, the up regulation of αvβ3 is likely important. In a previous study, we determined that areas of blood brain barrier leakage co-localized with β3 antibody reactivity in a 6-hydroxydopamine model of DA neuron loss (Carvey et al. 2005). While finding has not been demonstrated in an animal model of AD, such a result would not be surprising given that angiogenic factors such as VEGF are upregulated in AD and have direct effects on vascular permeability (Nagy et al. 2008). Thus, markers of angiogenesis may indicate areas where the blood brain barrier fails to function properly.
Because there was a small, but non-significant age difference between AD and control subjects (Table 1), we wanted to ensure that differences in angiogenesis were not confounded by age. As indicated in the results, spearman correlation data indicated that there was no significant relationship between age and integrin αvβ3 immunoreactivity or vascular density in the hippocampus, midfrontal cortex or SNpc. In contrast, age was significantly related to αvβ3 density in the locus ceruleus, a region reported to have significant neuronal loss in AD (Zarow et al. 2003). While these findings suggest that angiogenesis occurs in disease-susceptible regions independent of age, further study with larger numbers will be required to clarify the role of age on angiogenic activity.
Since the pathological features of AD may contribute to the angiogenic environment, we used spearman correlations to determine if a relationship existed between angiogenic activity and AD brain pathology. Our data indicated that that the number of activated microglia did not correlate with angiogenesis (Table 3). However, angiogenesis may be an acute disturbance that occurs in response to ongoing inflammation and the full extent of angiogenesis may not be evident at autopsy. The increase in vessel density also did not correlate with activated microglia (Table 3). However, the increase in vascular density was limited to the hippocampus, an area that did not see an increase in activated microglia. We did find that Aβ load was correlated with vascular density in the hippocampus and αvβ3 immunoreactivity was significantly correlated with NFTs, suggesting that Aβ and NFTs may be intimately involved in altering the cerebral vasculature.
In animal models of AD, cognitive decline is enhanced following endothelial cell activation, proliferation and subsequent vascular remodeling (Schultheiss et al. 2006). In the current study, cognitive impairment, as measured by MMSE, was not related with detectable angiogenesis following autopsy in disease susceptible regions (Table 4). Again, this finding does not rule out a role for angiogenesis, as αvβ3 reactivity only indicates current angiogenesis and does not elucidate angiogenesis that may have been present before or during cognitive testing. In contrast, the number of activated microglia in the cortex and hippocampus was related to lower MMSE scores (Table 4), suggesting that ongoing inflammation has an effect on cognitive function.
It is possible that the angiogenesis or vascular density has a nonspecific relationship with pathology; e.g. vascular changes in the hippocampus, midfrontal cortex, SNpc, and locus ceruleus may be secondary to the accumulation of amyloid and/or NFTs. However, the most intriguing explanation is that an initial neuronal insult triggers an inflammatory response, resulting in angiogenesis allowing neurotoxic substances and immune cells to cross the compromised BBB, exacerbating tissue damage and perpetuating an inflammatory response. Such self-perpetuating episodes of angiogenesis and inflammation in regions affected in AD may make those areas more vulnerable to infiltration of immune cells (McGeer and McGeer 1995; Zarow et al. 1997; Abbott 2000; Phares et al. 2006), contributing to further neuronal death and underlie the slow progressive nature of the disease. An age-controlled study with larger numbers is needed to further explore the role of angiogenesis in AD.
Acknowledgments
This work was supported by RO1AI51619 (BH), K08AG00084 (JAS), P30AG10161 (JAS), R01AG15819 (JAS), and the Kenneth Douglas Foundation (PMC). We thank Dr. Sue Leurgans for her statistical expertise. We thank the nuns, priests, and brothers from the following groups participating in the Religious Orders Study: Archdiocesan priests of Chicago, Dubuque, and Milwaukee; Benedictine Monks, Lisle, IL, and Collegeville, MN; Benedictine Sisters of Erie, Erie, PA; Benedictine Sisters of the Sacred Heart, Lisle, IL; Capuchins, Appleton, WI; Christian Brothers, Chicago, IL, and Memphis, TN; Diocesan priests of Gary, IN; Dominicans, River Forest, IL; Felician Sisters, Chicago, IL; Franciscan Handmaids of Mary, New York, NY; Franciscans, Chicago, IL; Holy Spirit Missionary Sisters, Techny, IL; Maryknolls, Los Altos, CA and Maryknoll, NY; Norbertines, DePere, WI; Oblate Sisters of Providence, Baltimore, MD; Passionists, Chicago, IL; Presentation Sisters, Dubuque, BVM., IA; Servites, Chicago, IL; Sinsinawa Dominican Sisters, Chicago, IL, and Sinsinawa, WI; Sisters of Charity, B.V.M., Chicago, IL, and Dubuque, IA; Sisters of the Holy Family, New Orleans, LA; Sisters of the Holy Family of Nazareth, Des Plaines, IL; Sisters of Mercy of the Americas, Chicago and Aurora, IL, Erie, PA; Sisters of St. Benedict, St. Cloud and St. Joseph, MN; Sisters of St. Casimir, Chicago, IL; Sisters of St. Francis of Mary Immaculate, Joliet, IL; Sisters of St. Joseph of LaGrange, LaGrange Park, IL; Society of Divine Word, Techny, IL; Trappists, Gethsemani, KY, and Peosta, IA; Wheaton Franciscan Sisters, Wheaton, IL. We thank T. Colvin and J. Bach, Religious Orders Study Coordinators; data and analytic programmers, Karen Skish, Veronica Flores, Davik Shah, Benjamin Spirtovic, Wayne Longman and Yu Li for technical assistance and the Rush Institute for Healthy Aging staff.
Footnotes
Conflict of interest statement: There is no actual or potential conflicts of interest.
Contributor Information
Brinda S. Desai, Department of Pharmacology, Rush University Medical Center, Cohn Research Building, 1735 W Harrison Suite 412, Chicago, IL 60612, USA
Julie A. Schneider, Rush Alzheimer's Disease Center, Rush University Medical Center, Chicago, IL 60612, USA Department of Neurological Sciences, Rush University Medical Center, Chicago, IL 60612, USA; Department of Pathology, Rush University Medical Center, Chicago, IL 60612, USA.
Jia-Liang Li, Rush Alzheimer's Disease Center, Rush University Medical Center, Chicago, IL 60612, USA; Department of Neurological Sciences, Rush University Medical Center, Chicago, IL 60612, USA.
Paul M. Carvey, Department of Pharmacology, Rush University Medical Center, Cohn Research Building, 1735 W Harrison Suite 412, Chicago, IL 60612, USA Department of Neurological Sciences, Rush University Medical Center, Chicago, IL 60612, USA.
Bill Hendey, Email: bhendey@rush.edu, Department of Pharmacology, Rush University Medical Center, Cohn Research Building, 1735 W Harrison Suite 412, Chicago, IL 60612, USA.
References
- Abbott NJ. Inflammatory mediators and modulation of blood– brain barrier permeability. Cell Mol Neurobiol. 2000;20:131–147. doi: 10.1023/A:1007074420772. [DOI] [PMC free article] [PubMed] [Google Scholar]
- Akiyama H, Kawamata T, Dedhar S, McGeer PL. Immunohistochemical localization of vitronectin, its receptor and beta-3 integrin in Alzheimer brain tissue. J Neuroimmunol. 1991;32:19–28. doi: 10.1016/0165-5728(91)90067-h. [DOI] [PubMed] [Google Scholar]
- Akiyama H, Ikeda K, Kondo H, McGeer PL. Thrombin accumulation in brains of patients with Alzheimer's disease. Neurosci Lett. 1992;146:152–154. doi: 10.1016/0304-3940(92)90065-f. [DOI] [PubMed] [Google Scholar]
- Alzheimer A, Stelzmann RA, Schnitzlein HN, Murtagh FR. An English translation of Alzheimer's 1907 paper, “Uber eine eigenartige Erkankung der Hirnrinde”. Clin Anat. 1995;8:429–431. doi: 10.1002/ca.980080612. [DOI] [PubMed] [Google Scholar]
- Bennett DA, Schneider JA, Wilson RS, Bienias JL, Arnold SE. Neurofibrillary tangles mediate the association of amyloid load with clinical Alzheimer disease and level of cognitive function. Arch Neurol. 2004;61:378–384. doi: 10.1001/archneur.61.3.378. [DOI] [PubMed] [Google Scholar]
- Bennett DA, Schneider JA, Arvanitakis Z, Kelly JF, Aggarwal NT, Shah RC, Wilson RS. Neuropathology of older persons without cognitive impairment from two community-based studies. Neurology. 2006;66:1837–1844. doi: 10.1212/01.wnl.0000219668.47116.e6. [DOI] [PubMed] [Google Scholar]
- Boscolo E, Folin M, Nico B, Grandi C, Mangieri D, Longo V, Scienza R, Zampieri P, Conconi MT, Parnigotto PP, Ribatti D. Beta amyloid angiogenic activity in vitro and in vivo. Int J Mol Med. 2007;19:581–587. [PubMed] [Google Scholar]
- Braak H, Braak E. Staging of Alzheimer's disease-related neurofibrillary changes. Neurobiol Aging. 1995;16:271–278. doi: 10.1016/0197-4580(95)00021-6. discussion 278–284. [DOI] [PubMed] [Google Scholar]
- Braak H, Braak E. Frequency of stages of Alzheimer-related lesions in different age categories. Neurobiol Aging. 1997;18:351–357. doi: 10.1016/s0197-4580(97)00056-0. [DOI] [PubMed] [Google Scholar]
- Brilliant MJ, Elble RJ, Ghobrial M, Struble RG. The distribution of amyloid beta protein deposition in the corpus striatum of patients with Alzheimer's disease. Neuropathol Appl Neurobiol. 1997;23:322–325. [PubMed] [Google Scholar]
- Brooks PC. Role of integrins in angiogenesis. Eur J Cancer. 1996;32A:2423–2429. doi: 10.1016/s0959-8049(96)00381-4. [DOI] [PubMed] [Google Scholar]
- Cantara S, Donnini S, Morbidelli L, Giachetti A, Schulz R, Memo M, Ziche M. Physiological levels of amyloid peptides stimulate the angiogenic response through FGF-2. Faseb J. 2004;18:1943–1945. doi: 10.1096/fj.04-2114fje. [DOI] [PubMed] [Google Scholar]
- Carmeliet P, Jain RK. Angiogenesis in cancer and other diseases. Nature. 2000;407:249–257. doi: 10.1038/35025220. [DOI] [PubMed] [Google Scholar]
- Carmeliet P, Storkebaum E. Vascular and neuronal effects of VEGF in the nervous system: implications for neurological disorders. Semin Cell Dev Biol. 2002;13:39–53. doi: 10.1006/scdb.2001.0290. [DOI] [PubMed] [Google Scholar]
- Carvey PM, Zhao CH, Hendey B, Lum H, Trachtenberg J, Desai BS, Snyder J, Zhu YG, Ling ZD. 6-Hydroxydopamine-induced alterations in blood–brain barrier permeability. Eur J Neurosci. 2005;22:1158–1168. doi: 10.1111/j.1460-9568.2005.04281.x. [DOI] [PubMed] [Google Scholar]
- Cheresh DA, Stupack DG. Regulation of angiogenesis: apoptotic cues from the ECM. Oncogene. 2008;27:6285–6298. doi: 10.1038/onc.2008.304. [DOI] [PubMed] [Google Scholar]
- Croll SD, Ransohoff RM, Cai N, Zhang Q, Martin FJ, Wei T, Kasselman LJ, Kintner J, Murphy AJ, Yancopoulos GD, Wiegand SJ. VEGF-mediated inflammation precedes angiogenesis in adult brain. Exp Neurol. 2004;187:388–402. doi: 10.1016/j.expneurol.2004.02.010. [DOI] [PubMed] [Google Scholar]
- Deane R, Zlokovic BV. Role of the blood–brain barrier in the pathogenesis of Alzheimer's disease. Curr Alzheimer Res. 2007;4:191–197. doi: 10.2174/156720507780362245. [DOI] [PubMed] [Google Scholar]
- Folkman J. Endogenous angiogenesis inhibitors. APMIS. 2004;112:496–507. doi: 10.1111/j.1600-0463.2004.apm11207-0809.x. [DOI] [PubMed] [Google Scholar]
- Folstein MF, Folstein SE, McHugh PR. “Mini-mental state”. A practical method for grading the cognitive state of patients for the clinician. J Psychiatr Res. 1975;12:189–198. doi: 10.1016/0022-3956(75)90026-6. [DOI] [PubMed] [Google Scholar]
- Horton M. Vitronectin receptor: tissue specific expression or adaptation to culture? Int J Exp Pathol. 1990;71:741–759. [PMC free article] [PubMed] [Google Scholar]
- Jain RK. Normalizing tumor vasculature with anti-angiogenic therapy: a new paradigm for combination therapy. Nat Med. 2001;7:987–989. doi: 10.1038/nm0901-987. [DOI] [PubMed] [Google Scholar]
- Jain RK. Normalization of tumor vasculature: an emerging concept in antiangiogenic therapy. Science. 2005;307:58–62. doi: 10.1126/science.1104819. [DOI] [PubMed] [Google Scholar]
- Kalaria RN. The blood–brain barrier and cerebral microcirculation in Alzheimer disease. Cerebrovasc Brain Metab Rev. 1992;4:226–260. [PubMed] [Google Scholar]
- Kalaria RN, Cohen DL, Premkumar DR, Nag S, LaManna JC, Lust WD. Vascular endothelial growth factor in Alzheimer's disease and experimental cerebral ischemia. Brain Res Mol Brain Res. 1998;62:101–105. doi: 10.1016/s0169-328x(98)00190-9. [DOI] [PubMed] [Google Scholar]
- Kalinowski L, Dobrucki LW, Meoli DF, Dione DP, Sadeghi MM, Madri JA, Sinusas AJ. Targeted imaging of hypoxia-induced integrin activation in myocardium early after infarction. J Appl Physiol. 2008;104:1504–1512. doi: 10.1152/japplphysiol.00861.2007. [DOI] [PubMed] [Google Scholar]
- Kanaan NM, Kordower JH, Collier TJ. Age and region-specific responses of microglia, but not astrocytes, suggest a role in selective vulnerability of dopamine neurons after 1-methyl-4-phenyl-1, 2, 3, 6-tetrahydropyridine exposure in monkeys. Glia. 2008;56:1199–1214. doi: 10.1002/glia.20690. [DOI] [PMC free article] [PubMed] [Google Scholar]
- Lahdenranta J, Sidman RL, Pasqualini R, Arap W. Treatment of hypoxia-induced retinopathy with targeted proapoptotic peptidomimetic in a mouse model of disease. Faseb J. 2007;21:3272–3278. doi: 10.1096/fj.07-8273com. [DOI] [PubMed] [Google Scholar]
- McGeer PL, McGeer EG. The inflammatory response system of brain: implications for therapy of Alzheimer and other neurodegenerative diseases. Brain Res Brain Res Rev. 1995;21:195–218. doi: 10.1016/0165-0173(95)00011-9. [DOI] [PubMed] [Google Scholar]
- Meyer EP, Ulmann-Schuler A, Staufenbiel M, Krucker T. Altered morphology and 3D architecture of brain vasculature in a mouse model for Alzheimer's disease. Proc Natl Acad Sci USA. 2008;105:3587–3592. doi: 10.1073/pnas.0709788105. [DOI] [PMC free article] [PubMed] [Google Scholar]
- Milner R, Frost E, Nishimura S, Delcommenne M, Streuli C, Pytela R, Ffrench-Constant C. Expression of alpha vbeta3 and alpha vbeta8 integrins during oligodendrocyte precursor differentiation in the presence and absence of axons. Glia. 1997;21:350–360. [PubMed] [Google Scholar]
- Mitchell TW, Nissanov J, Han LY, Mufson EJ, Schneider JA, Cochran EJ, Bennett DA, Lee VM, Trojanowski JQ, Arnold SE. Novel method to quantify neuropil threads in brains from elders with or without cognitive impairment. J Histochem Cytochem. 2000;48:1627–1638. doi: 10.1177/002215540004801206. [DOI] [PubMed] [Google Scholar]
- Nagy JA, Benjamin L, Zeng H, Dvorak AM, Dvorak HF. Vascular permeability, vascular hyperpermeability and angiogenesis. Angiogenesis. 2008;11:109–119. doi: 10.1007/s10456-008-9099-z. [DOI] [PMC free article] [PubMed] [Google Scholar]
- Nakajima M, Yuasa S, Ueno M, Takakura N, Koseki H, Shirasawa T. Abnormal blood vessel development in mice lacking presenilin-1. Mech Dev. 2003;120:657–667. doi: 10.1016/s0925-4773(03)00064-9. [DOI] [PubMed] [Google Scholar]
- Naldini A, Carraro F. Role of inflammatory mediators in angiogenesis. Curr Drug Targets Inflamm Allergy. 2005;4:3–8. doi: 10.2174/1568010053622830. [DOI] [PubMed] [Google Scholar]
- NIA Working Group. Consensus recommendations for the postmortem diagnosis of Alzheimer's disease. The National Institute on Aging, and Reagan Institute Working Group on Diagnostic Criteria for the Neuropathological Assessment of Alzheimer's Disease. Neurobiol Aging. 1997;18:S1–S2. [PubMed] [Google Scholar]
- Paik DC, Fu C, Bhattacharya J, Tilson MD. Ongoing angiogenesis in blood vessels of the abdominal aortic aneurysm. Exp Mol Med. 2004;36:524–533. doi: 10.1038/emm.2004.67. [DOI] [PubMed] [Google Scholar]
- Paris D, Patel N, DelleDonne A, Quadros A, Smeed R, Mullan M. Impaired angiogenesis in a transgenic mouse model of cerebral amyloidosis. Neurosci Lett. 2004a;366:80–85. doi: 10.1016/j.neulet.2004.05.017. [DOI] [PubMed] [Google Scholar]
- Paris D, Townsend K, Quadros A, Humphrey J, Sun J, Brem S, Wotoczek-Obadia M, DelleDonne A, Patel N, Obregon DF, Crescentini R, Abdullah L, Coppola D, Rojiani AM, Crawford F, Sebti SM, Mullan M. Inhibition of angiogenesis by Abeta peptides. Angiogenesis. 2004b;7:75–85. doi: 10.1023/B:AGEN.0000037335.17717.bf. [DOI] [PubMed] [Google Scholar]
- Phares TW, Kean RB, Mikheeva T, Hooper DC. Regional differences in blood–brain barrier permeability changes and inflammation in the apathogenic clearance of virus from the central nervous system. J Immunol. 2006;176:7666–7675. doi: 10.4049/jimmunol.176.12.7666. [DOI] [PubMed] [Google Scholar]
- Pinkstaff JK, Detterich J, Lynch G, Gall C. Integrin subunit gene expression is regionally differentiated in adult brain. J Neurosci. 1999;19:1541–1556. doi: 10.1523/JNEUROSCI.19-05-01541.1999. [DOI] [PMC free article] [PubMed] [Google Scholar]
- Pogue AI, Lukiw WJ. Angiogenic signaling in Alzheimer's disease. Neuroreport. 2004;15:1507–1510. doi: 10.1097/01.wnr.0000130539.39937.1d. [DOI] [PubMed] [Google Scholar]
- Sato W, Kosugi T, Zhang L, Roncal CA, Heinig M, Campbell-Thompson M, Yuzawa Y, Atkinson MA, Grant MB, Croker BP, Nakagawa T. The pivotal role of VEGF on glomerular macrophage infiltration in advanced diabetic nephropathy. Lab Invest. 2008;88:949–961. doi: 10.1038/labinvest.2008.60. [DOI] [PubMed] [Google Scholar]
- Schmid-Brunclik N, Burgi-Taboada C, Antoniou X, Gassmann M, Ogunshola OO. Astrocyte responses to injury: VEGF simultaneously modulates cell death and proliferation. Am J Physiol Regul Integr Comp Physiol. 2008;295:R864–R873. doi: 10.1152/ajpregu.00536.2007. [DOI] [PubMed] [Google Scholar]
- Schneider JA, Li JL, Li Y, Wilson RS, Kordower JH, Bennett DA. Substantia nigra tangles are related to gait impairment in older persons. Ann Neurol. 2006;59:166–173. doi: 10.1002/ana.20723. [DOI] [PubMed] [Google Scholar]
- Schneider JA, Boyle PA, Arvanitakis Z, Bienias JL, Bennett DA. Subcortical infarcts, Alzheimer's disease pathology, and memory function in older persons. Ann Neurol. 2007;62:59–66. doi: 10.1002/ana.21142. [DOI] [PubMed] [Google Scholar]
- Schultheiss C, Blechert B, Gaertner FC, Drecoll E, Mueller J, Weber GF, Drzezga A, Essler M. In vivo characterization of endothelial cell activation in a transgenic mouse model of Alzheimer's disease. Angiogenesis. 2006;9:59–65. doi: 10.1007/s10456-006-9030-4. [DOI] [PubMed] [Google Scholar]
- Siedlak SL, Cras P, Kawai M, Richey P, Perry G. Basic fibroblast growth factor binding is a marker for extracellular neurofibrillary tangles in Alzheimer disease. J Histochem Cytochem. 1991;39:899–904. doi: 10.1177/39.7.1865106. [DOI] [PubMed] [Google Scholar]
- Streit WJ, Mrak RE, Griffin WS. Microglia and neuroinflammation: a pathological perspective. J Neuroinflammation. 2004;1:14. doi: 10.1186/1742-2094-1-14. [DOI] [PMC free article] [PubMed] [Google Scholar]
- Tarkowski E, Issa R, Sjogren M, Wallin A, Blennow K, Tarkowski A, Kumar P. Increased intrathecal levels of the angiogenic factors VEGF and TGF-beta in Alzheimer's disease and vascular dementia. Neurobiol Aging. 2002;23:237–243. doi: 10.1016/s0197-4580(01)00285-8. [DOI] [PubMed] [Google Scholar]
- Thirumangalakudi L, Samany PG, Owoso A, Wiskar B, Grammas P. Angiogenic proteins are expressed by brain blood vessels in Alzheimer's disease. J Alzheimers Dis. 2006;10:111–118. doi: 10.3233/jad-2006-10114. [DOI] [PubMed] [Google Scholar]
- Tsopanoglou NE, Maragoudakis ME. On the mechanism of thrombin-induced angiogenesis. Potentiation of vascular endothelial growth factor activity on endothelial cells by up-regulation of its receptors. J Biol Chem. 1999;274:23969–23976. doi: 10.1074/jbc.274.34.23969. [DOI] [PubMed] [Google Scholar]
- Vagnucci AH, Jr, Li WW. Alzheimer's disease and angiogenesis. Lancet. 2003;361:605–608. doi: 10.1016/S0140-6736(03)12521-4. [DOI] [PubMed] [Google Scholar]
- Wei L, Erinjeri JP, Rovainen CM, Woolsey TA. Collateral growth and angiogenesis around cortical stroke. Stroke. 2001;32:2179–2184. doi: 10.1161/hs0901.094282. [DOI] [PubMed] [Google Scholar]
- Williams RW, Rakic P. Three-dimensional counting: an accurate and direct method to estimate numbers of cells in sectioned material. J Comp Neurol. 1988;278:344–352. doi: 10.1002/cne.902780305. [DOI] [PubMed] [Google Scholar]
- Willmann JK, Lutz AM, Paulmurugan R, Patel MR, Chu P, Rosenberg J, Gambhir SS. Dual-targeted contrast agent for US assessment of tumor angiogenesis in vivo. Radiology. 2008;248:936–944. doi: 10.1148/radiol.2483072231. [DOI] [PMC free article] [PubMed] [Google Scholar]
- Yang SP, Bae DG, Kang HJ, Gwag BJ, Gho YS, Chae CB. Co-accumulation of vascular endothelial growth factor with beta-amyloid in the brain of patients with Alzheimer's disease. Neurobiol Aging. 2004;25:283–290. doi: 10.1016/S0197-4580(03)00111-8. [DOI] [PubMed] [Google Scholar]
- Zarow C, Barron E, Chui HC, Perlmutter LS. Vascular basement membrane pathology and Alzheimer's disease. Ann N Y Acad Sci. 1997;826:147–160. doi: 10.1111/j.1749-6632.1997.tb48467.x. [DOI] [PubMed] [Google Scholar]
- Zarow C, Lyness SA, Mortimer JA, Chui HC. Neuronal loss is greater in the locus coeruleus than nucleus basalis and substantia nigra in Alzheimer and Parkinson diseases. Arch Neurol. 2003;60:337–341. doi: 10.1001/archneur.60.3.337. [DOI] [PubMed] [Google Scholar]
- Zetterberg H, Andreasen N, Blennow K. Increased cerebrospinal fluid levels of transforming growth factor-beta1 in Alzheimer's disease. Neurosci Lett. 2004;367:194–196. doi: 10.1016/j.neulet.2004.06.001. [DOI] [PubMed] [Google Scholar]
- Zlokovic BV. The blood–brain barrier in health and chronic neurodegenerative disorders. Neuron. 2008;57:178–201. doi: 10.1016/j.neuron.2008.01.003. [DOI] [PubMed] [Google Scholar]