

Abstract
Considerable effort has focused on the development of selective protein farnesyl transferase (FTase) and protein geranylgeranyl transferase (GGTase) inhibitors as cancer chemotherapeutics. Here, we report a new strategy for anti-cancer therapeutic agents involving inhibition of farnesyl diphosphate synthase (FPPS) and geranylgeranyl diphosphate synthase (GGPPS), the two enzymes upstream of FTase and GGTase, by lipophilic bisphosphonates. Due to dual site targeting and decreased polarity, the compounds have activities far greater than do current bisphosphonate drugs in inhibiting tumor cell growth and invasiveness, both in vitro and in vivo. We explore how these compounds inhibit cell growth, how cell activity can be predicted based on enzyme inhibition data, and, using x-ray diffraction, solid state NMR and isothermal titration calorimetry, we show how these compounds bind to FPPS and/or GGPPS.
Introduction
The high prevalence of mutated Ras genes, found in ~30% of human cancers, resulted in the development of many protein farnesyl transferase (FTase) inhibitors.1 However, these compounds have not been found to be very effective drugs, due in part to cross-prenylation by geranylgeranyl diphosphate.1 An alternative approach might be to block formation of farnesyl and/or geranylgeranyl diphosphate, since in recent work2 the bone resorption drug zoledronate (Zometa, Reclast, Aclasta) has been shown in prostate cancer cells to exert its main biological activity against protein geranylgeranylation.2 Zoledronate has a second remarkable activity in that it activates human γδ T cells (containing the Vγ2Vδ2 T cell receptor), which then kill tumor cells.3, 4 It also reduces tumor cell invasion and migration, as well as angiogenesis.3 Furthermore, in a very recent Phase III trial of 1803 breast cancer patients, there was a significantly reduced (36%) risk of cancer returning, or death, on zoledronate (+hormone) therapy.5
The main bisphosphonates in clinical use (Figure 1a) are thought to act primarily by inhibiting the enzyme farnesyl diphosphate synthase (FPPS). This results in decreased prenylation of proteins such as Ras, Rho, Rac and Rap, and impairment of cell survival signaling pathways,6–8 Figure 1b. The inhibition of FPPS also results in the accumulation of its substrate, isopentenyl diphosphate (IPP), which can be converted to the isopentenyl ester of ATP (ApppI), which is strongly pro-apoptotic and is thought to contribute to the overall efficacy of bisphosphonates, both in vitro and in vivo.9, 10 FPP biosynthesis proceeds via carbocationic transition state/reactive intermediates11 such as that circled in red in Figure 1c, with the bisphosphonate side-chains (of e.g. ibandronate, Figure 1a) mimicking the cationic charge centers of the transition state/reactive intermediates, and the bisphosphonate backbone providing a hydrolytically stable analog of diphosphate.11 However, the same types of transition state might also be expected for other prenyltransferases, such as GGPP synthase (GGPPS). So, it seemed possible that bisphosphonates might be designed to inhibit FPPS as well as GGPPS, with the targeting of multiple enzymes leading to enhanced potency against tumor cell growth and invasiveness.
Figure 1.

Bisphosphonate chemistry and targets. (a) Structures of common nitrogen-containing bisphosphonates. The cationic center are shown in blue. (b) Schematic illustration of several pathways involved in bisphosphonate activity in tumor cells, γδ T cells, osteoclasts, macrophages, and some protozoa. (c) FPP, GGPP biosynthesis and protein prenylation showing carbocation transition state/reactive intermediates and bisphosphonate carbocation-sidechain analog (enclosed in red circle). (d) Comparative molecular similarity index electrostatic field (left, blue=positive charge favored)) and pharmacophore (right, green=hydrophobic, red=positive, blue=negative ionizable) for FPPS inhibition. (e) Some cationic bisphosphonates. (f) Potent GGPPS inhibitor structures.
Zoledronate and other bisphosphonate drugs are not conventionally drug-like, however, since they rapidly bind to bone. We thus reasoned that it also might be possible to generate a new class of drug leads that would be far more effective than current bisphosphonates if: 1) they would inhibit FPPS, resulting in reduced Ras prenylation; 2) they would also inhibit GGPPS, resulting in enhanced tumor cell killing and decreased invasiveness and 3) they might be engineered so as to have low affinity for bone. All three aims have now been achieved and the resulting “lipophilic bisphosphonates” are found to be far more active, both in vitro and in vivo, than any currently available bisphosphonate drug.
Results and Discussion
Inhibitor Design and Tumor Cell Growth Inhibition by Bisphosphonates
Since earlier comparative molecular similarity analysis (CoMSIA)12 and pharmacophore models for FPPS inhibition13 (Figure 1d) suggested that moving the positive charge feature closer to the bisphosphonate backbone would enhance activity, we synthesized several bisphosphonates with such a feature (Figure 1e), including pyridinium, sulfonium, phosphonium, ammonium and guanidinium bisphosphonates. Also, the possible importance of having a large, hydrophobic tail (Figure 1f) was suggested from our earlier work on Saccharomyces cerevisiae and human GGPPS14, 15, and that of Wiemer and Hohl16, and we hypothesized that such long-chain inhibitors would have good cellular uptake and reduced bone binding affinity since bone binding is inversely correlated with lipophilicity,17 as characterized for example by the log of the octanol/water partition coefficient (clogP). We thus designed a series of novel bisphosphonates that might have good activity against FPPS and/or GGPPS, and tested these compounds, together with other known bisphosphonates (Figure S1 in the Supporting Information), for their activity (pIC50 = − log10IC50 [M]) in tumor cell killing, using three cell lines: MCF-7 (breast), NCI-H460 (non-small cell lung) and SF-268 (human glioblastoma) from the NCI/NIH Developmental Therapeutics Program’s 60 human tumor cell line screen screening collection.
The cell growth inhibition results, Figure 2a, clearly show that cationic bisphosphonates, such as BPH-715 (Figure 1f), are far more active in tumor cell growth inhibition than are conventional bisphosphonates, such as zoledronate and pamidronate, since they have IC50 values of ~100–200 nM, to be compared with ~15 μM for zoledronate and ~140 μM for pamidronate (Figure 2a). There was no ‘rescue’ from growth inhibition by BPH-715 in any of the three cell lines investigated by addition of farnesol (FOH) or geranylgeraniol (GGOH), and only a partial rescue by GGOH for zoledronate (Figure S2 in the Supporting Information). On the other hand, the large hydrophobic bisphosphonate, BPH-675 (Figure 1f), was not only more potent in cell growth inhibition than were either zoledronate or pamidronate (IC50 = 5 μM), but its growth inhibitory effect was almost fully reversed by addition of 20 μM GGOH (Figure 2b), but not by FOH. This suggests that BPH-675 is a selective GGPPS inhibitor, and similar inhibition (IC50 ~21 μM) and rescue by GGOH is found with another selective GGPPS inhibitor,16 1,1-digeranylmethylene bisphosphonate, although the activity of both of these selective GGPPS inhibitors is much less than with BPH-715 (IC50=~0.23 μM). These results clearly indicate three different type of inhibition. In the case of BPH-675, only GGPPS is potently inhibited, consistent with the enzyme inhibition results (Supporting Information Table S1) and the observation of an essentially full rescue by GGOH. FOH has no effect, since FPPS inhibition is very weak. With zoledronate, it is primarily FPPS that is inhibited. This effect can be partly overcome by addition of GGOH, but the Ras inhibition and IPP/ApppI accumulation still partially blocks cell growth. With BPH-715, both FPPS and GGPPS inhibition are involved and there is no rescue by either FOH or GGOH, since both FPPS and GGPPS are targeted.
Figure 2.

In vitro tumor cell growth inhibition results. (a) MCF-7 cell growth inhibition by bisphosphonates. (b) FOH, GGOH rescue of BPH-675 cell growth inhibition. (c) Correlation matrix for enzyme inhibition, cell growth inhibition, and SlogP. (d) Experimental pIC50 values plotted versus computed pIC50 values, for NCI-H460 cell growth inhibition, using a combinatorial descriptor search algorithm. The R is the Pearson correlation coefficient (R=0.89).
A Quantitative Model for Tumor Cell Growth Inhibition
The possible involvement of more than one enzyme target necessitated the development of a quantitative model of cell growth inhibition based on enzyme data, so we next determined the pKi (pKi = −log10 Ki [M]) values for FPPS and GGPPS inhibition by the 29 bisphosphonates investigated (Supplementary Table 1, Figure S1). We then investigated the correlations between cell growth inhibition results (pIC50) for all three human tumor cell lines and the pKi values for both of the enzymes studied, together with a parameter that is frequently used to characterize the lipophilicity of molecules, SlogP.18 As shown in the correlation matrix in Figure 2c, in which we compare all pair-wise Pearson R-values for FPPS and GGPPS inhibition, MCF-7 cell growth inhibition, and SlogP, we find a good correlation between cell growth inhibition and GGPPS inhibition (R = 0.81). There is a moderate correlation between cell growth inhibition and SlogP (R=0.63), but only a poor correlation with FPPS inhibition alone. Similar results are observed for the other cell lines. These results support the idea that GGPPS inhibition is, in many cases, of prime importance in tumor cell growth inhibition, consistent with these and other GGOH rescue studies.2
We then developed a quantitative model for cell growth inhibition, using a partial least squares method to regress enzyme inhibition and SlogP data against the cell pIC50 results. That is:
where a–d are regression coefficients. Using solely enzyme inhibition and SlogP data, there was a slight improvement in predictivity, to R = 0.84 for MCF-7, with GGPPS inhibition dominating the correlation. Full results are given in Table S1. Further improvements were obtained by using a combinatorial descriptor search19 in which we sampled 230 descriptors,18 together with enzyme inhibition data. GGPPS inhibition overwhelmingly dominated the overall experimental/predicted pIC50 correlations in all the cell lines (Figure 2d, R = 0.88 for MCF-7; detailed results for all three cell lines are given is Table S1–S4 in the Supporting Information).
X-ray, NMR and Calorimetric Investigations of Bisphosphonate–Target Interactions
We next chose to study how pyridinium bisphosphonates, BPH-461(Figure 1d), BPH-721, BPH-722, BPH-714 and BPH-715 (Figure 1f), bind to their primary FPPS and GGPPS targets,
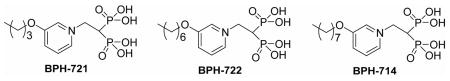
using x-ray crystallography. BPH-461 and BPH-721 are representative of the smaller types of pyridinium bisphosphonate that are more potent inhibitors of FPPS, while BPH-714 and BPH-722 are representative of the longer chain species that are less potent inhibitors of FPPS, but better GGPPS inhibitors. Data collection and refinement statistics for several FPPS complexes are shown Tables S5–10 in the Supporting Information, for both the human and Trypanosoma brucei FPPS enzymes, the latter being of interest as a target for anti-infective drug development.20 The structures of BPH-461 bound to both human and Trypanosoma brucei FPPS are shown superimposed in Figure 3a and are very similar, with the bisphosphonate fragment chelating to 3 Mg2+, as first observed with risedronate in the Escherichia coli protein.21 In the presence of nitrogen containing bisphosphonates together with IPP, it has been found that ternary bisphosphonate-IPP-FPPS complexes form21–25 and BPH-461 forms the same type of complex, containing 3 Mg2+ plus IPP (Figure 3b). In the case of bisphosphonates with longer side chains, such as BPH-721, PBP-722 and BPH-714, the alkyloxy side-chains extend deeper into the binding site, Figure 3c. The first 4 carbons (closest to the backbone) in the alkyloxy sidechain track the positions in the GPP substrate, but with the longer side-chains, the chain terminus starts to bend back, due to a steric clash with Tyr99, effects that correlate with diminished activity in FPPS inhibition.
Figure 3.

X-ray results. (a) X-ray structures of BPH-461 bound to human FPPS (PDB: 2opm, in green) and Trypanosoma brucei FPPS (PDB: 3dyg, in magenta). (b) X-ray structure of BPH-461+IPP bound to T. brucei FPPS (PDB: 3dyf). (c) Superimposition of X-ray structure of BPH-714 bound to T. brucei FPPS (PDB: 3efq, in green) with BPH-461 bound to Trypanosoma brucei FPPS (PDB: 3dyg, in magenta).
The formation of ternary FPPS complexes with IPP, Mg2+ is also seen in solid-state 31P NMR spectra (Figure 4) and clearly indicates that each of five different types of cationic bisphosphonates form ternary complexes with, on average, a 1:1 (±0.2) bisphosphonate: IPP stoichiometry. And, as determined by isothermal titration calorimetry, the binding of each of the different classes of cationic bisphosphonates are overwhelmingly entropy driven (Figure 5; Table S11 in the Supporting Information), as also found24, 26 with conventional bisphosphonates such as alendronate and ibandronate, which also have positively charged side chains.
Figure 4.

31P NMR spectra (600 MHz 1H resonance frequency) of bisphosphonate/IPP/T. brucei FPPS complexes. The structures of the bisphosphonates investigated are shown above the spectra. All of the cationic bisphosphonates form ~1:1 bisphosphonate: IPP complexes with FPPS. The T. brucei protein was chosen for NMR investigation since it provided much higher expression levels than did the human protein.
Figure 5.
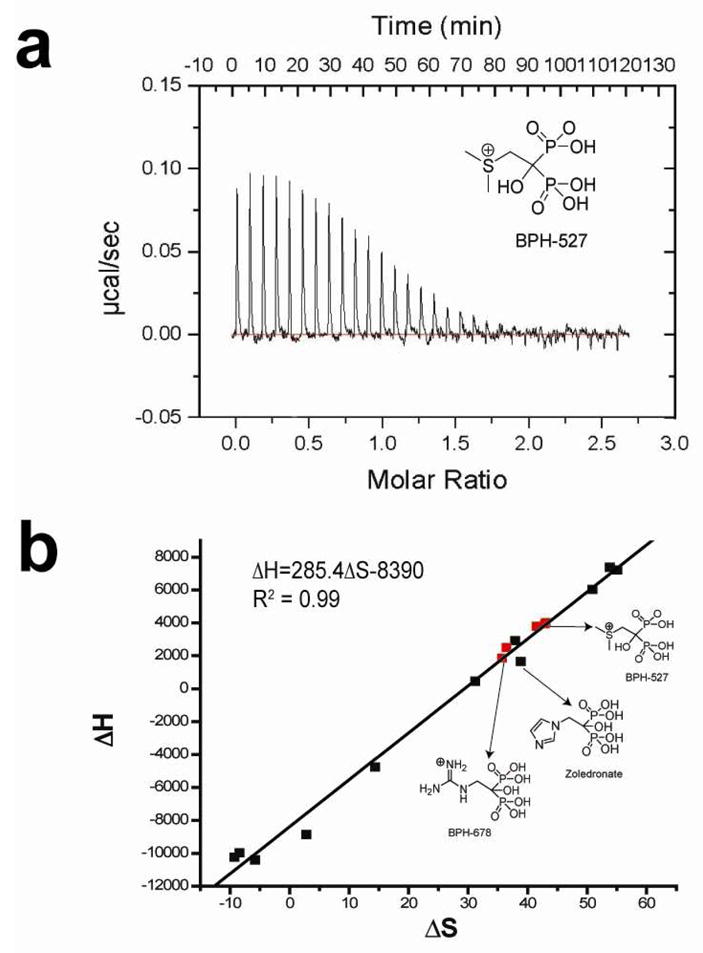
Representative ITC results for a cationic bisphosphonate (BPH-527) bound to T. brucei FPPS and ΔH, ΔS correlation (novel cationic compounds in red, others from Yin et al.26).
In the case of GGPPS, we determined the structure of the long alkyl chain pyridinium bisphosphonate inhibitor BPH-715 (Figure 1f), both in the presence and in the absence of IPP, using the S. cerevisiae protein studied previously15. BPH-715 is representative of the longer chain species that are more potent inhibitors of (both human and S. cerevisiae) GGPPS than (human or T. brucei) FPPS. Data collection and refinement statistics for two structures are shown in Tables S12, 13 in the Supporting Information. In the presence or absence of IPP, only the GGPP product or inhibitor binding site27 is occupied by BPH-715 (Figure 6a). In the presence of IPP, a ternary bisphosphonate-IPP-Mg complex forms, (Figure 6b), and the IPP location is similar to that seen in the FPPS complex (Figure 3b). Since the inhibitor binds to the GGPP binding site, there is no requirement for a positive charge feature, so both cationic and neutral side-chain containing species can inhibit tumor cell growth, due primarily to GGPPS inhibition, but only the cationic species can also inhibit FPPS.
Figure 6.

X-ray results for GGPPS. (a) X-ray structure of BPH-715 (yellow, PDB 2zeu) bound to GGPPS (from Saccharomyces cerevisiae) shown superimposed on GGPP (pink) bound to human GGPPS (PDB File 2q80). (b) x-ray structure of BPH-715 (yellow) with IPP (PDB 2zev) bound to GGPPS (from Saccharomyces cerevisiae) shown superimposed on GGPP (pink) bound to human GGPPS (PDB File 2q80).
Tumor Cell Invasiveness and in vivo Results
The results described above show that pyridinium bisphosphonates have potent activity against tumor cell growth, in vitro. But do they also have pronounced effects on tumor cell invasiveness? And do they have good activity in vivo? The results of the recent clinical trial of zoledronate on breast cancer survival and disease re-occurrence appear to be linked to the direct effects of the bisphosphonate on tumor cell growth, invasiveness, angiogenesis as well as, potentially, γδ T cell activation. Clearly, a complex set of effects. We thus next studied one of the most potent species in tumor cell growth inhibition on MDA-MB-231 cells, in a Matrigel invasion assay (Figure 7a). MDA-MB-231 has a mutated constitutively activated K-Ras and is a highly invasive “triple negative” human breast adenocarcinoma cell line lacking expression of estrogen receptor, progesterone receptor and human epidermal growth receptor 2 (Her2) and is, therefore, resistant to many modern drugs. Cells were cultured with zoledronate or two lipophilic bisphosphonates with the latter being found (Figure 7a) to be more inhibitory than was zoledronate, which had essentially no effect even at 10 μM.
Figure 7.

Effects of bisphosphonates on tumor cell invasion in vitro and tumor growth in vivo. (a) Effects of zoledronate, BPH-715 and BPH-716 on MDA-MB-231 invasion in a Matrigel system. (b) Effects of zoledronate, BPH-715 on tumor cell volume in a mouse xenograft system (SK-ES-1 cells). (c) Tumor cell volume as a function of the number (n) of CH2 groups in the n-alkyloxy sidechain.
To determine whether such compounds have activity in vivo, we used SK-ES-1 sarcoma cells in a mouse xenograft system, as described previously.28 While zoledronate caused a significant (p < 0.01) reduction in tumor cell growth versus control, the effect of the lipophilic bisphosphonate (BPH-715, Figure 1e) was even more pronounced (Figure 7b, p = 0.032 versus zoledronate), and there was no weight loss or other adverse effect observed. Activity in this mouse model can be attributed to direct activity on tumor cell growth and invasiveness, since murine γδ T cells lack the Vγ2Vδ2 T cell receptor29 required for activation by IPP. These results demonstrate, therefore, that the more lipophilic bisphosphonates can have potent, direct activity against tumor cell proliferation/invasiveness, both in vitro and in vivo. As expected, we find that shorter alkyl-chain containing analogs of BPH-715 have less efficacy in this in vivo model, Figure 7c, since they are less potent GGPPS inhibitors, inhibiting primarily FPPPS, and are also much more polar. However, increased chain length can also have adverse effects, since these compounds may become too long to fit in the FPPS/GGPPS active sites and, in vivo, may have poor pharmacokinetics. This appears to be the case with BPH-716, which is two carbon longer than BPH-715. In the cell assays, BPH-716 has about the same activity as BPH-715. This is not expected based solely on the enzyme inhibition results but may be attributed to compound hydrophobicity (SlogP −0.45 versus −1.2). That is, the compound can more readily enter cells, in both the growth inhibition and Matrigel invasion assays. However, in vivo, this improved hydrophobicity may result in targeting “other” tissues or organs, making it less bio-available. In any case, the results shown in Figure 7 clearly indicate that the most potent lipophilic bisphosphonate in vivo, BPH-715, has much greater activity than zoledronate. The opposite effect is seen, however, in a 43Ca2+-release model of bone resorption, Figure 8a, in which zoledronate is more effective than any of the lipophilic bisphosphonates tested. In this assay, enhanced bone-binding by the polar zoledronate molecule (slogP =−5.52) is responsible, and indeed, we find in a direct bone-binding model using 14C-labelled olpadronate displacement by bisphosphonates (Figure 8b) that zoledronate is indeed far more effective in displacing this bound bisphosphonate than are the lipophilic species. For example, BPH-715 has an IC50 = 2.9 μM in a mouse fetal metatarsal 45Ca2+ release inhibition assay (Figure 8a) while the IC50 for zoledronate is ~100 nM (Figure 8a). This is potentially quite desirable in the context of chemotherapy and potentially, immunotherapy, since excessive bone binding would reduce the amount of bisphosphonate available for tumor cell killing (or γδ T cell activation). And since bone is not targeted, this might enable use in pediatric patients, where inhibiting bone development is undesirable. Of course, there is some bone binding, but this could be beneficial, since it would be expected to inhibit tumor cell recruitment to bone, in more advanced disease.
Figure 8.

Bone binding and anti-resorptive results. (a) 45Ca release from mouse metatarsals in response to administration of zoledronate, BPH-675, BPH-715 and BPH-716. Computed IC50 values are ~100 nM, ~30 μM, ~2.9 μM and ~1.3 μM, respectively. (b) Percentage of 14C-olpadronate displaced from fetal mouse metatarsals by different bisphosphonates: BPH-715; BPH-675; clodronate (CLO) and zoledronate (ZOL).
Conclusions
Bisphosphonates are conventionally thought to target the enzyme farnesyl diphosphate synthase (FPPS), resulting in decreased FPP levels. This leads to decreased prenylation of Ras proteins. But paradoxically, the primary “biological activity” of bisphosphonates has been shown to be on protein geranylgeranylation, even though FPPS is being targeted.2 This leads to the idea that it might be possible to develop potent cell growth inhibitors which target GGPPS directly, and this we find to be the case, with compounds such as BPH-715 having IC50 values (in tumor cell growth inhibition) ~100 fold lower than the most potent commercially available drug, zoledronate. However, compounds that inhibit exclusively GGPPS are less effective than those that can also inhibit FPPS. This is clearly reminiscent of other anti-cancer drugs such as the multi-kinase inhibitors, which gain efficacy by inhibiting several targets, or pathways. The novel lipophilic bisphosphonates also have potent activity in vitro in a Matrigel assay using a highly invasive, triple-negative breast adenocarcinoma cell line (MDA-MB-231) that has a mutated constitutively activated K-Ras. Plus, they have activity in vivo in a murine xenograft model, where they are more effective than current bisphosphonates. Part of this activity can be attributed to the more lipophilic nature of these compounds, which results in enhanced cellular uptake, and part can be attributed to weaker binding to bone mineral. This latter observation is important since conventional bisphosphonates are typically removed from the circulation in <1 hour, by binding to bone surfaces, an effect that can be expected to decrease their utility in inhibiting non-bone tumor cell growth, and invasiveness.
Consistent with these observations, our nuclear magnetic resonance, calorimetric and x-ray crystallographic results show that the novel bisphosphonates bind to FPPS in a similar manner as do conventional bisphosphonates (such as zoledronate),19–25 while the most potent species (e.g. BPH-715) target primarily GGPPS, binding to the GGPP product or inhibitor site first identified by Kavanagh et al.27 We also find that the cellular activities of each inhibitor can be well predicted by the use of computer models using enzyme inhibition results combined with other descriptors that help describe transport. For tumor cell growth inhibition, we find that GGPPS inhibition overwhelmingly dominates the correlation, in accord with the observations of Goffinet et al.2 (using solely zoledronate), an observation we now extend to other bisphosphonates, including the most active species. Overall, these results are of interest in the context of cancer chemotherapy, since we now have novel species that are ~2 orders of magnitude more active than are conventional bisphosphonates, in tumor cell killing and in blocking invasiveness. They act in the same way as do current drugs, but are more bio-available, since they are more hydrophobic; they can inhibit more than one target, acting as “multi-prenyl synthase inhibitors”, and they bind only very weakly to bone mineral. Moreover, their cell based activities can be predicted, facilitating their further development in chemotherapy, and in combined chemo/immunotherapy.4,30
Experimental Section
Cell Growth Inhibition Assays
The human tumor cell lines: MCF-7, NCI-H460 and SF-268, were obtained from the National Cancer Institute. Cells were cultured in RPMI-1640 medium supplemented with 10% fetal bovine serum and 2 mM L-glutamine at 37°C in a 5% CO2 atmosphere at 100% humidity. A broth microdilution method was used to determine IC50 values for growth inhibition by each bisphosphonate. Cells were inoculated at a density of 5,000 cells/well into 96-well flat bottom culture plates containing 10 μL of the test compound, previously half-log serial diluted (from 0.316 mM to 0.1 pM) for a final volume of 100 μL. Bisphosphonates were typically dissolved in H2O (0.01 M). Plates were then incubated for 4 days at 37°C in a 5% CO2 atmosphere at 100% humidity, after which an MTT ((3-(4,5-dimethylthiazole-2-yl)-2,5-diphenyltetrazolium bromide) cell proliferation assay (ATCC, Manassas, VA) was used to obtain dose-response curves. GraphPad PRISM® version 4.0 software for windows (GraphPad Software Inc., San Diego, CA, www.graphpad.com) was used to fit the data to a rectangular hyperbolic function:
where I is the percent inhibition, Imax = 100% inhibition, C is the concentration of the inhibitor, and IC50 is the concentration for 50% growth inhibition. Typical dose-response curves are shown in Figure 2a, in the Text. For the “rescue” experiments (Figure 2b and supporting information Figure S2), stock solutions of FOH or GGOH were prepared (in ethanol) and the requisite amounts added to the incubation media to produce a fixed 20 μM concentration. All bisphosphonates were prepared in this laboratory using standard methods described previously.
Human FPPS Inhibition
Human FPPS was expressed and purified as described previously.24 Human FPPS assays were carried out using 96 well plates with 200 μL reaction mixture in each well. The condensation of geranyl diphosphate and isopentenyl diphosphate was monitored by a continuous spectrophotometric assay for phosphate releasing enzymes. The reaction buffer contained 50 mM Tris-HCl, 1 mM MgCl2, at pH 7.4. The compounds investigated were pre-incubated with enzyme for 30 minutes at 20°C. The IC50 values were obtained by fitting the inhibition data to the dose-response curve in Origin 6.1 (OriginLab Corporation, Northampton, MA, www.OriginLab.com).
Human GGPPS Inhibition
The purification of human recombinant geranylgeranyl diphosphate synthase (hGGPPS) followed the protocol reported previously.14 GGPPS inhibition by bisphosphonates was determined using the radiometric assay reported previously14 with slight modification. The assay solution contained 300 ng of hGGPPS, 50 mM potassium phosphate buffer (pH 7.0), 5 mM MgCl2, 2 mM DTT, 1 mg/mL BSA, and 25 μM FPP in a total volume of 50 μL and was preincubated with the bisphosphonates at room temperature for 15 min. Then, reactions were started by adding 5 μL of a 250 μM solution of [14C] IPP and incubated at 37°C for 20 min. Reactions were terminated by addition of 75 μL of HCl/MeOH. Following a second 20 min incubation at 37°C, to hydrolyze the allylic diphosphates, the reaction mixtures were neutralized by addition of 75 μL of 6 N NaOH, then extracted with 500 μL of hexane. 200 μL of the organic phase was transferred to a scintillation vial for counting. The IC50 values were obtained by fitting the data to the dose-response curve in Origin 6.1 (OriginLab Corp., Northampton, MA, www.OriginLab.com).
Invasion Assay
Cells from a human breast carcinoma cell line, MDA-MB-231, were obtained from ATCC (Manassas, VA) and cultured in RPMI-1640 medium, 10% FBS, and 2 mM L-glutamine (Gibco, Grand Island, NY). The culture was maintained at 37°C in a 5% CO2 atmosphere with 100% humidity. For the assay, cells were grown to 90% confluence and treated with bisphosphonates for 24 hours. Cells were washed twice with PBS, detached with 2mM EDTA, and diluted to 106 cell mL−1 in RPMI-1640. 300 μL of cell suspension were seeded into the upper chambers of the culture inserts of a Cytoselect 24-well Cell Invasion Assay kit (Cell Biolabs, Inc., San Diego, CA). The lower chambers were filled with 500μL of RPMI-1640 Media supplemented with 10% FBS and 2 mM L-glutamine, to induce invasion. After 24 hours incubation at 37°C in a humidified 5% CO2 atmosphere, the non-invading cells in the upper chamber were removed with cotton swabs and the adherent cells present on the bottom of each insert were stained with dye supplied in the kit. Cells were counted by light microscopy, 10 fields (magnification 200x) per insert. The assays were run three times and the geometric mean values used to deduce IC50 values for invasion inhibition.
In vivo Tumor Model
Experiments were carried out basically as described in Kubo et al.31 Xenografts of human SK-ES-1 cells were initiated by subcutaneous injections of 1.5×10⁷ cells into the right flank of four, 6-week old athymic nude mice (CLEA, Tokyo, Japan). The mice received daily intraperitoneal injections of bisphosphonates (5μg, for 30 days), or physiological saline. The smallest and largest diameters of tumors, and the body weights, were measured weekly. Tumor volumes were calculated using the following formula: volume (mm3) = (smallest diameter)2 × (largest diameter)/2. All animal experiments were conducted according to the guidelines of the Institutional Animal Care and Use Committee and the protocol was approved by the Ethics Committee for Experimental Animals of Hiroshima University. Statistical significance was determined by one-way ANOVA and Fisher’s PLSD method, using Statcel (OMS Ltd., Saitama, Japan); p < 0.05 was considered to be significant.
Molecular Descriptors
Structures of inhibitors were imported into the Molecular Operating Environment (MOE) 2006.08.18 Extraneous salts were removed and acidic groups and basic groups deprotonated and protonated, respectively. Protonation states were verified manually. A set of 230 molecular descriptors were computed within MOE and 124 non-Boolean sets (plus the FPPS, GGPPS pIC50 values) were exported into MATLAB32 for a combinatorial descriptor search.
Combinatorial Descriptor Search
The entire descriptor space was searched exhaustively to find the combination of descriptors which gave the best regression coefficient (highest R2 for experimental versus predicted pED50) for the equation:
where A–C are descriptors and a–d are coefficients. The search was performed with the requirement that at least one of the descriptors (A, B or C) must be an enzyme (FPPS or GGPPS) pKi. Calculations were performed in MATLAB32 on a Dual 2GHz PowerPC G5.
NMR Spectroscopy
Spectra were obtained by using the magic-angle sample spinning technique on a 600 MHz (1H resonance frequency) Infinity Plus spectrometer equipped with a 14.1 T, 2 inch bore Oxford magnet and Varian/Chemagnetics 3.2 mm T3 HXY probe. Spectra were referenced with respect to an external standard of 85% orthophosphoric acid. 1H transverse magnetization was created by a 3.5 μs pulse (75 kHz field) and cross polarization was used for signal enhancement, followed by TPPM decoupling (80 kHz 1H field) during data acquisition. 1H-31P cross polarization pulse shapes and decoupling were optimized on risedronate prior to data acquisition on the protein samples. Data were acquired using a dwell time of 10 μs (a 100 kHz spectral width), 2048 points, a 2 sec recycle delay and a spinning speed of 13.333 kHz. All spectra were processed by using zero-filling to 4096 points, 50 Hz exponential multiplication, and a polynomial correction for baseline correction prior to peak integration. The number of scans varied between 32 k and 86 k.
Crystallization and X-ray Data Collection for Human FPPS·bisphosphonate Complexes
Crystals of human FPPS complexed with Mg and BPH-461 were obtained based on the methods described by K. L. Kavanagh et al.24 with slight modification. FPPS was incubated with 2.5 mM bisphosphonate and 2.5 mM MgCl2 overnight on ice before setting up the drops. Crystals were grown at room temperature in sitting drops by mixing 2 μL of protein solution with 1 μL of precipitant, which consisted of 40% (v/v) of either polyethylene glycol 2,000 or 4,000 and 0.1 M phosphate/citrate buffer, pH 4.2. Diffraction data were obtained at 100 K using an ADSC Q315 CCD detector at the Brookhaven National Synchrotron Light Source, beamline X29 (λ=1.1 Å). Data collection statistics are reported in Supporting Information Table S5.
Crystallization and X-ray Data Collection of T. brucei FPPS·bisphosphonate Complexes
Crystallization conditions were based on the conditions reported by Mao et al.33 The effects of protein concentration, precipitant type and concentration, buffer type, buffer pH value and metal-ion concentration were then optimized and protein crystals that gave good diffraction patterns were obtained. Protein at 5.55 mg/mL was mixed with 2.5 mM bisphosphonates, 2.5 mM MgCl2 and incubated overnight on ice before setting up the drops. Crystals were grown at room temperature in hanging drops by mixing 1 μL of FPPS-bisphosphonate solution with 1 μL of precipitant, consisting of 10% (v/v) MPD in 100 mM ammonium acetate, pH 5.5~6.0. Prior to data collection, crystals were mounted in a cryoloop and after the addition of 40% (v/v) MPD as cryoprotectant, were flash-frozen in liquid nitrogen. Diffraction data were obtained at 100 K using an ADSC Q4 CCD detector at the Brookhaven National Synchrotron Light Source beamline X8C (λ=1.1 Å). Data collection statistics are reported in Table S6, S8–S10 in the Supporting Information. An additional data set for BPH-461 was obtained by crystallization in the presence of 2.5 mM IPP. Statistics are shown in Table S7.
Crystallization and Data Collection for GGPPS·bisphosphonate Complexes
Native S. cerevisiae GGPPS crystals for soaking were obtained by using the hanging drop method (Hampton Research; Laguna Niguel, CA) by mixing 2 μL of GGPPS solution (5–10 mg/mL in 25 mM Tris-HCl, pH 7.5 and 150 mM NaCl) with 2 μL of mother liquor (0.08 M CH3COONa, 16% PEG 4000, 6–10% glycerol, and 6–10% 1, 2-propanediol), and equilibrating with 500 μL of the mother liquor. Crystals grew to 0.5 × 0.2 × 0.2 mm in 7 days, at room temperature, and were then soaked in cryoprotectant solution containing 2.5 mM MgCl2, 2.5 mM bisphosphonate (± 2.5 mM IPP), 0.08 M CH3COONa, 20% PEG 4000, 10% glycerol, and 10% 1, 2-propanediol, for 3–12 h. X-ray diffraction data were collected at beam line BL13B1 of the National Synchrotron Radiation Research Center (NSRRC, Hsinchu, Taiwan). Data collection and refinement statistics are shown in Tables S12 and S13 in the Supporting Information.
Structure Determination of Human FPPS·bisphosphonate Complexes
For structure determination, the human FPPS structure (1YV5)24 minus the risedronate ligand was used as a search model using the molecular replacement method. Rigid body refinement was applied to the model obtained using AMoRe.34 The crystal structure was then further refined by using Shelxl-97,35 with bisphosphonate densities readily identified. Rebuilding and fitting the ligand in the 2Fo-Fc electron density map was carried out by using the program O.36 The refinement statistics are included in Supporting Information Table S5.
Structure Determination of T. brucei FPPS·bisphosphonate Complexes
The crystal structures of the T. brucei FPPS bisphosphonate complexes were determined by using the molecular replacement method using the program AMoRe.34 The previously solved T. brucei FPPS structure (2EWG)25 minus the minodronate ligand was used as a starting model. The structure was further refined using CNS,37 with densities of the ligands readily identified. After iterative rounds of refinement using CNS and rebuilding and ligand fitting using Coot,38 the structures had the final refinement statistics shown in Tables S6–S10.
Structure Determination of S. cerevisiae GGPPS·bisphosphonate Complexes
The structures of the GGPPS complexes were determined by using the native GGPPS structure (2DH4). The 2Fo-Fc difference Fourier maps showed clear electron densities for most amino acid residues, including those in the IPP binding site(s), but several loops and the C-terminal segments were disordered. Bisphosphonate and substrate densities were obvious. Subsequent refinement with incorporation of cofactors and water molecules at a 1.0σ map level yielded R and Rfree values of 0.19–0.20 and 0.24–0.27, respectively, at 2.00–2.23 Å resolution. Statistics for the final models are listed in Tables S12 and S13. All manual modifications of the models were performed on an SGI Fuel (Silicon Graphics, Mountain View, CA) computer using the XtalView39 program. Structure refinements, which included maximal likelihood and simulated-annealing protocols, were carried out by using CNS.37 PyMol40 was used in creating the figures.
Supplementary Material
Acknowledgments
We thank K. Kavanagh and U. Oppermann for providing the human FPPS expression system and for providing unpublished results and H. Sagami for providing the human GGPPS expression system. We thank the staff of the Brookhaven National Laboratory, SER-CAT Advanced Photon Source at Argonne National Laboratory and the National Synchrotron Radiation Research Center (Taiwan) Beamlines, for synchrotron time and support. This work was supported by the United States Public Health Service (NIH grants GM065307 and GM073216). Y.Z. was supported by a Postdoctoral Fellowship from the American Heart Association, Midwest Affiliate. A.L. was supported by an NIH Institutional NRSA in Molecular Biophysics (grant GM008276). S.M. was supported by a Predoctoral Fellowship from the American Heart Association, Midwest Affiliate (Award No. 06155647). Y.S. was supported by a Leukemia and Lymphoma Society Special Fellowship.
Footnotes
The coordinates for the FPPS, GGPPS structures have been deposited in the Protein Data Bank as: 2opm, 3dyf, 3dyg, 3dyh, 3efq, 3egt, 2zeu, and 2zev.
Supporting Information Available: Additional results (Tables S1–S13 and Figures S1–S2). This material is available free of charge via Internet at http://pubs.acs.org.
References
- 1.Sousa SF, Fernandes PA, Ramos MJ. Curr Med Chem. 2008;15:1478–82. doi: 10.2174/092986708784638825. [DOI] [PubMed] [Google Scholar]
- 2.Goffinet M, Thoulouzan M, Pradines A, Lajoie-Mazenc I, Weinbaum C, Faye JC, Seronie-Vivien S. BMC Cancer. 2006;6:60. doi: 10.1186/1471-2407-6-60. [DOI] [PMC free article] [PubMed] [Google Scholar]
- 3.Green JR. Oncologist. 2004;9(Suppl 4):3–13. doi: 10.1634/theoncologist.9-90004-3. [DOI] [PubMed] [Google Scholar]
- 4.Dieli F, Vermijlen D, Fulfaro F, Caccamo N, Meraviglia S, Cicero G, Roberts A, Buccheri S, D’Asaro M, Gebbia N, Salerno A, Eberl M, Hayday AC. Cancer Res. 2007;67:7450–7457. doi: 10.1158/0008-5472.CAN-07-0199. [DOI] [PMC free article] [PubMed] [Google Scholar]
- 5.Gnant MF, Mlineritsch B, Schippinger W, L-E G, Poestlberger S, Menzel C, Jakesz R, Kubista E, Marth C, Greil R On behalf of ABCSG. J Clin Oncol. 2008;26(suppl) abstr LBA4. [Google Scholar]
- 6.Russell RG, Xia Z, Dunford JE, Oppermann U, Kwaasi A, Hulley PA, Kavanagh KL, Triffitt JT, Lundy MW, Phipps RJ, Barnett BL, Coxon FP, Rogers MJ, Watts NB, Ebetino FH. Ann N Y Acad Sci. 2007;1117:209–57. doi: 10.1196/annals.1402.089. [DOI] [PubMed] [Google Scholar]
- 7.Shipman CM, Rogers MJ, Apperley JF, Russell RG, Croucher PI. Br J Haematol. 1997;98:665–72. doi: 10.1046/j.1365-2141.1997.2713086.x. [DOI] [PubMed] [Google Scholar]
- 8.Stresing V, Daubine F, Benzaid I, Monkkonen H, Clezardin P. Cancer Lett. 2007;257:16–35. doi: 10.1016/j.canlet.2007.07.007. [DOI] [PubMed] [Google Scholar]
- 9.Monkkonen H, Auriola S, Lehenkari P, Kellinsalmi M, Hassinen IE, Vepsalainen J, Monkkonen J. Br J Pharmacol. 2006;147:437–45. doi: 10.1038/sj.bjp.0706628. [DOI] [PMC free article] [PubMed] [Google Scholar]
- 10.Monkkonen H, Ottewell PD, Kuokkanen J, Monkkonen J, Auriola S, Holen I. Life Sci. 2007;81:1066–70. doi: 10.1016/j.lfs.2007.08.007. [DOI] [PubMed] [Google Scholar]
- 11.Martin MB, Arnold W, Heath HT, 3rd, Urbina JA, Oldfield E. Biochem Biophys Res Commun. 1999;263:754–8. doi: 10.1006/bbrc.1999.1404. [DOI] [PubMed] [Google Scholar]
- 12.Klebe G, Abraham U, Mietzner T. J Med Chem. 1994;37:4130–46. doi: 10.1021/jm00050a010. [DOI] [PubMed] [Google Scholar]
- 13.Sanders JM, Gomez AO, Mao J, Meints GA, Van Brussel EM, Burzynska A, Kafarski P, Gonzalez-Pacanowska D, Oldfield E. J Med Chem. 2003;46:5171–83. doi: 10.1021/jm0302344. [DOI] [PubMed] [Google Scholar]
- 14.Szabo CM, Matsumura Y, Fukura S, Martin MB, Sanders JM, Sengupta S, Cieslak JA, Loftus TC, Lea CR, Lee HJ, Koohang A, Coates RM, Sagami H, Oldfield E. J Med Chem. 2002;45:2185–96. doi: 10.1021/jm010412y. [DOI] [PubMed] [Google Scholar]
- 15.Guo RT, Cao R, Liang PH, Ko TP, Chang TH, Hudock MP, Jeng WY, Chen CK, Zhang Y, Song Y, Kuo CJ, Yin F, Oldfield E, Wang AH. Proc Natl Acad Sci U S A. 2007;104:10022–7. doi: 10.1073/pnas.0702254104. [DOI] [PMC free article] [PubMed] [Google Scholar]
- 16.Wiemer AJ, Tong H, Swanson KM, Hohl RJ. Biochem Biophys Res Commun. 2007;353:921–5. doi: 10.1016/j.bbrc.2006.12.094. [DOI] [PubMed] [Google Scholar]
- 17.Hirabayashi H, Sawamoto T, Fujisaki J, Tokunaga Y, Kimura S, Hata T. Pharm Res. 2001;18:646–51. doi: 10.1023/a:1011033326980. [DOI] [PubMed] [Google Scholar]
- 18.Molecular Operating Environment (MOE), 2006.08. Chemical Computing Group, Inc.; Montreal, Quebec: 2006. [Google Scholar]
- 19.Mukkamala D, No JH, Cass LM, Chang TK, Oldfield E. J Med Chem. 2008;51:7827–33. doi: 10.1021/jm8009074. [DOI] [PMC free article] [PubMed] [Google Scholar]
- 20.Montalvetti A, Fernandez A, Sanders JM, Ghosh S, Van Brussel E, Oldfield E, Docampo R. J Biol Chem. 2003;278:17075–83. doi: 10.1074/jbc.M210467200. [DOI] [PubMed] [Google Scholar]
- 21.Hosfield DJ, Zhang Y, Dougan DR, Broun A, Tari LW, Swanson RV, Finn J. J Biol Chem. 2004;279:8526–9. doi: 10.1074/jbc.C300511200. [DOI] [PubMed] [Google Scholar]
- 22.Gabelli SB, McLellan JS, Montalvetti A, Oldfield E, Docampo R, Amzel LM. Proteins. 2006;62:80–8. doi: 10.1002/prot.20754. [DOI] [PubMed] [Google Scholar]
- 23.Rondeau JM, Bitsch F, Bourgier E, Geiser M, Hemmig R, Kroemer M, Lehmann S, Ramage P, Rieffel S, Strauss A, Green JR, Jahnke W. ChemMedChem. 2006;1:267–73. doi: 10.1002/cmdc.200500059. [DOI] [PubMed] [Google Scholar]
- 24.Kavanagh KL, Guo K, Dunford JE, Wu X, Knapp S, Ebetino FH, Rogers MJ, Russell RG, Oppermann U. Proc Natl Acad Sci U S A. 2006;103:7829–34. doi: 10.1073/pnas.0601643103. [DOI] [PMC free article] [PubMed] [Google Scholar]
- 25.Mao J, Mukherjee S, Zhang Y, Cao R, Sanders JM, Song Y, Zhang Y, Meints GA, Gao YG, Mukkamala D, Hudock MP, Oldfield E. J Am Chem Soc. 2006;128:14485–97. doi: 10.1021/ja061737c. [DOI] [PubMed] [Google Scholar]
- 26.Yin F, Cao R, Goddard A, Zhang Y, Oldfield E. J Am Chem Soc. 2006;128:3524–5. doi: 10.1021/ja0601639. [DOI] [PubMed] [Google Scholar]
- 27.Kavanagh KL, Dunford JE, Bunkoczi G, Russell RG, Oppermann U. J Biol Chem. 2006;281:22004–22012. doi: 10.1074/jbc.M602603200. [DOI] [PubMed] [Google Scholar]
- 28.Kubo T, Shimose S, Matsuo T, Sakai A, Ochi M. Efficacy of a nitrogen-containing bisphosphonate, minodronate, in conjunction with a p38 mitogen activated protein kinase inhibitor or doxorubicin against malignant bone tumor cells. Cancer Chemother Pharmacol. 2007;62:111–6. doi: 10.1007/s00280-007-0580-y. [DOI] [PubMed] [Google Scholar]
- 29.Chen ZW, Letvin NL. Trends Immunol. 2003;24:213–9. doi: 10.1016/s1471-4906(03)00032-2. [DOI] [PMC free article] [PubMed] [Google Scholar]
- 30.Clezardin P, Ebetino FH, Fournier PG. Cancer Res. 2005;65:4971–4. doi: 10.1158/0008-5472.CAN-05-0264. [DOI] [PubMed] [Google Scholar]
- 31.Kubo T, Shimose S, Matsuo T, Tanaka K, Yasunaga Y, Sakai A, Ochi M. J Orthop Res. 2006;24:1138–44. doi: 10.1002/jor.20177. [DOI] [PubMed] [Google Scholar]
- 32.MATLAB 7.4. The MathWorks, Inc.: Natick, MA; [Google Scholar]
- 33.Mao J, Gao YG, Odeh S, Robinson H, Montalvetti A, Docampo R, Oldfield E. Acta Crystallogr D. 2004;60:1863–6. doi: 10.1107/S0907444904020633. [DOI] [PubMed] [Google Scholar]
- 34.Navaza J. Acta Crystallog A. 1994;50:157–163. [Google Scholar]
- 35.Sheldrick G, Schneider T. Methods in Enzymology. 1997;277:319–343. [PubMed] [Google Scholar]
- 36.Jones TA, Zou JY, Cowan SW, Kjeldgaard M. Improved methods for building protein models in electron density maps and the location of errors in these models. Acta Crystallogr A. 1991;47:110–119. doi: 10.1107/s0108767390010224. [DOI] [PubMed] [Google Scholar]
- 37.Brunger AT, Adams PD, Clore GM, DeLano WL, Gros P, Grosse-Kunstleve RW, Jiang JS, Kuszewski J, Nilges M, Pannu NS, Read RJ, Rice LM, Simonson T, Warren GL. Acta Crystallogr D. 1998;54:905–21. doi: 10.1107/s0907444998003254. [DOI] [PubMed] [Google Scholar]
- 38.Emsley P, Cowtan K. Coot: model-building tools for molecular graphics. Acta Crystallogr D. 2004;60:2126–32. doi: 10.1107/S0907444904019158. [DOI] [PubMed] [Google Scholar]
- 39.McRee DE. J Stru Biol. 1999;125:156–165. doi: 10.1006/jsbi.1999.4094. [DOI] [PubMed] [Google Scholar]
- 40.DeLano WL. The PyMOL Molecular Graphics System. DeLano Scientific LLC; South San Francisco, CA, USA: [Google Scholar]
Associated Data
This section collects any data citations, data availability statements, or supplementary materials included in this article.