Abstract
A novel method of physiological motion compensation for use with radiation force elasticity imaging has been developed. The method utilizes a priori information from finite element method models of the response of soft tissue to impulsive radiation force to isolate physiological motion artifacts from radiation force-induced displacement fields. The new algorithm is evaluated in a series of clinically realistic imaging scenarios, and its performance is compared to that achieved with previously described motion compensation algorithms. Though not without limitations, the new model-based motion compensation algorithm performs favorably in many circumstances and may be a logical choice for use with in vivo abdominal imaging.
I. INTRODUCTION
Soft tissue elasticity imaging is a developing field that holds significant promise for a wide range of clinical applications. Elasticity imaging techniques typically compress, vibrate, or use radiation force to excite tissues, then monitor the induced tissue response to extract information related to local mechanical properties. The tissue response is usually monitored using magnetic resonance (MR) or ultrasound (US) methods. US-based techniques track tissue displacement by applying correlation-based or Doppler algorithms [1]–[3] to sequentially acquired lines of raw or demodulated radio frequency (RF) data. Images are created of induced tissue deformation/displacement, and with some techniques, additional processing may produce images of strain or reconstructed material properties. Relevant background information and an introduction to many of the various implementations of elasticity imaging has been compiled in several review articles [4]–[6].
For elasticity imaging to be effective, it is vital that the tissue response to applied stimuli be tracked accurately. Motion not associated with these stimuli is generally difficult to relate to local mechanical properties and adds bias and uncertainty to elasticity measurements [7]–[9]. These secondary sources of motion often originate from unwanted transducer movements or from physiological events. Although stable transducer placement can be achieved with experienced sonographers and patient breath-hold, physiological motion is unavoidable in many organs. Robust motion compensation algorithms are thus required for successful elasticity imaging in organs (such as the liver and heart) that experience significant physiological motion.
A fundamental component of successful motion compensation involves the differentiation of tissue motion related to applied stimuli from tissue motion arising from other sources. Accordingly, elasticity imaging in the presence of physiological motion can be viewed as a two-step process. First, all tissue motion in a region of interest is tracked in one or more dimensions. Subsequently, secondary measurements, a priori information about the expected tissue response, or other criteria are used to minimize the prevalence of motion artifacts in elasticity measurements. Logical strategies for the isolation of stimulusdriven tissue motion will vary depending upon which implementation of elasticity imaging is being used, as each technique utilizes different mechanisms to deform or excite tissues (and thus elicits a different tissue response). In the present paper, we focus upon motion compensation strategies for elasticity imaging techniques involving the use of impulsive radiation force [10]–[17]. Although we will perform our analysis focusing upon one such technique, acoustic radiation force impulse (ARFI) imaging, the strategies described herein can be applied to most radiation force imaging methods without significant alteration.
High pass filters, such as wall filters used in Doppler flow imaging [18], are not generally applicable for radiation force elasticity imaging since the induced tissue velocities fall in the same range as the physiological tissue velocities. In previous ARFI imaging investigations we have described two types of adaptive, temporal recovery-based filters designed to remove motion artifacts [9], [11], [19]. These algorithms (to be described in greater detail in the next section) perform effectively in many imaging scenarios, but are associated with known shortcomings related to the validity of the assumptions inherent in their design. In particular, the recovery-based (RB) motion filter algorithms require a user to estimate the time required for tissues to fully recover from the radiation force excitation. Accurate estimation of this time is often difficult in vivo, as the material properties that dictate tissue recovery are typically not known precisely. Although minor errors in estimated recovery time are well tolerated by the algorithms, the output of temporal recovery motion filters may bias elasticity measurements significantly for larger deviations.
We have developed a novel method of motion compensation for use with radiation force elastography. Finite element method (FEM) simulations are first used to model the response of soft tissue to impulsive radiation force [20], [21]. Information regarding this expected tissue response is then incorporated into algorithms designed to remove physiological motion from measurements of tissue displacement. As with other motion compensation algorithms, assumptions pertaining to the characteristics of physiological motion and estimations of relevant tissue properties are required. However, in many clinically realistic imaging scenarios, the operating assumptions associated with the model-based (MB) motion filter may allow for improved performance relative to RB motion filters.
The goals of this study are to introduce the newly developed algorithm and to perform an initial investigation into its effectiveness. Further, we wish to determine if the design assumptions incorporated into the algorithm limit its applicability or practicality in certain scenarios. We compare the MB motion filter to previously implemented temporal recovery motion filters to assess the potential benefits of the new algorithm. Simulated and experimental tissue-mimicking phantoms (where material properties are known precisely) are used to evaluate the algorithm. Experimental data from in vivo human abdominal imaging are also utilized to assess the method in clinically realistic scenarios, where material properties can be estimated only a priori.
II. BACKGROUND
A. Recovery-Based, Motion Filters
The response of soft tissue to impulsive radiation force is a complicated dynamic event strongly dependent upon tissue mechanical properties and the characteristics of the incident US beam [20], [22]. Despite the complicated nature of tissue, its induced temporal behavior is well known under many circumstances. In the absence of secondary motions, soft tissue will recover entirely from radiation force excitation and return to its initial state. In the region of excitation, recovery times in the focal zone are typically on the order of 1 to 10 ms [9], [22]. Due to beam focusing, tissue inertial effects, and other factors, recovery times are commonly longer in the near field [14], [20].
RB motion filters use knowledge of tissue dynamics and a user-specified estimate of the recovery timescale to isolate radiation force-induced displacements from physiological motion-induced displacement artifacts. These algorithms operate by determining the residual displacement magnitude in a region of interest at the estimated recovery time (often referred to as the cutoff time, or tcut). A polynomial is then fit between the origin (zero elapsed time, zero displacement) and the measured residual displacement at the cutoff time. The order of the polynomial is determined by the design assumptions of the algorithm (further elaboration below). Displacements described by this polynomial are considered physiological motion and are subtracted from the original estimate to obtain the radiation force displacement profile.
Two approaches to RB motion filtering have been implemented to date. The fundamental difference between the approaches is related to the temporal characteristics that the physiological motion is assumed to possess. Linear motion filters [9], [11] assume that during the short (3–10 ms) time windows over which tissue motion in a region is monitored, any physiological motion present can be approximated to have a linear temporal profile (i.e., be of constant velocity). This assumption is appropriate for imaging in many organs, as the linear algorithm has been shown to perform adequately in the presence of small to moderate velocity fluctuations [9]. The linear RB filter algorithm can be expressed as follows:
| (1) |
where M(t) is the measured displacement for a given spatial location at time t, M(tcut) is the measured displacement at the filter cutoff time, and Mfilt(t) is the motion filtered displacement output. As the algorithm is solved at each location, possible spatial variations in physiological motion are accounted for.
A more robust (and computationally intensive) algorithm is the quadratic motion filter, which allows for a constant tissue acceleration (including 0 cm/s2, the linear filter case) [19]. The quadratic motion filter is well suited for cardiac applications and often outperforms the linear filter when regions of interest are nearby major blood vessels. A drawback to the quadratic motion filter is that errors in the estimated tissue recovery time can affect the output displacement map considerably. The quadratic RB filter algorithm can be described by the following expression:
| (2) |
where c1 and c2 are scaling constants. For further details concerning the functionality and effectiveness of RB motion filters, the reader is referred to [9] for the linear algorithm and [19] for the quadratic algorithm.
Successful use of RB motion filters relies on an accurately specified tissue recovery time. Proper selection of this input parameter can be difficult in vivo, where knowledge of tissue properties is uncertain. If the user-specified cutoff time is too early, the magnitude of the radiation force-induced displacement is often suppressed. This suppression will lower the image signal-to-noise ratio (SNR) and decrease the span of depths over which stiffness comparisons can be reliably made. Additionally, since near-field tissues recover much later in time than tissues in the focal region, the choice of single cutoff time for a large span of depths is a simplifying assumption known not to hold true in virtually all cases. Thus, selecting a cutoff time appropriate for tissues in the focal region will often cause motion filters to suppress the amplitude of radiation force displacement in tissues shallower in depth. Although specifying a depth-varying cutoff time is possible, limited tissue tracking intervals often prevent this from being an effective option. Extending tissue tracking intervals increases acquisition time, thus decreasing frame rates and markedly increasing the likelihood of encountering significant physiological motion in regions of interest.
B. Model-Based, Motion Filtering
An alternative approach to motion filtering incorporates information from FEM models of the response of soft tissue to applied radiation force. Using this method, nearly all of the measured temporal displacement information is incorporated into the filtering algorithm. Conversely, the RB motion filters use only information from displacement measurements made at (linear filter) or following (quadratic filter) the filter cutoff time. By utilizing more complete a priori information concerning induced tissue dynamics, the MB motion filter eliminates the need to specify a cutoff time. Although the MB algorithm is associated with its own set of inherent limitations and underlying assumptions, it was hypothesized that in many imaging scenarios it would outperform the traditionally used RB algorithms.
The MB algorithm uses FEM models of the response of soft tissue to applied radiation forces to predict, for an arbitrary peak displacement amplitude, the shape of the temporal recovery curve of tissue for regions at all depths. As with other motion compensation algorithms, modeled tissue is approximated as homogeneous. It is then assumed that tissue displacements measured during the tracking interval are some combination of amplitude-scaled model-predicted behavior and a linear component related solely to tissue/transducer motion. Eq. (3) below describes this assumption mathematically for each displacement estimate (spatial location) in the image:
| (3) |
where R(t) is the modeled displacement for a given spatial location at time t, and c1 and c2 are scaling constants. Similar to the linear RB motion filter, the MB filter assumes that physiological motion will be of constant velocity. The system described by (3) is solved using least-squared error methods to determine the ideal coefficients for each spatial point in the image. The algorithm omits displacements measured in the early tracking period (not needed since system is heavily overdetermined) when solving for the coefficients to account for displacement underestimation due to shearing under the tracking point spread function [21]. The linear component attributed to physiological/transducer motion, c2t, is then removed from the measured displacement to recover the radiation force-induced displacement profile.
C. ARFI Image Interpretation
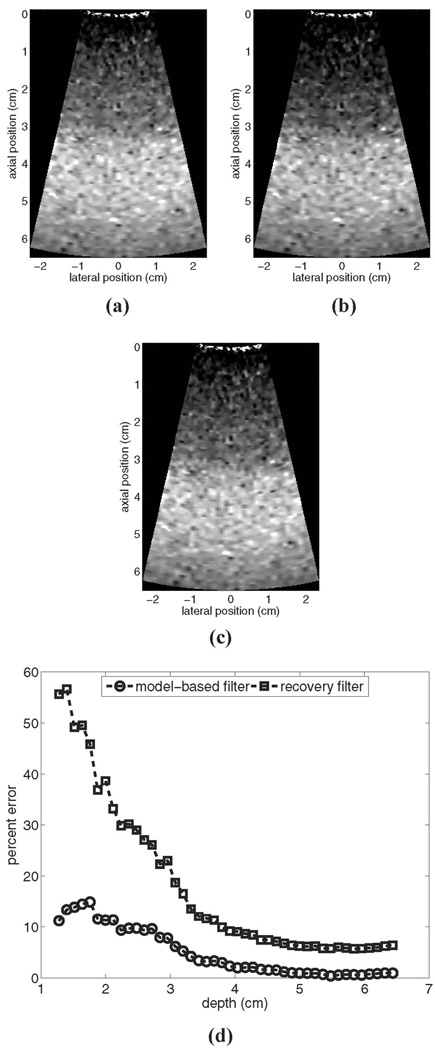
In ARFI images, bright pixels represent regions of relatively large displacement, while dark pixels represent regions displaced less. These images show a snapshot of the tissue response at a set time (in this study, 0.9 ms) following the removal of radiation force. Unless otherwise noted, both the experimental and the simulated tissue-mimicking phantom targets shown in this document are comprised of homogeneous media. However, one will notice [as in Fig. 1(a)] that, despite targets with uniform elastic modulus, focusing and inertial effects cause displacement magnitude in ARFI images to vary with depth. Normalization to account for these displacement gradients can be accomplished using time gain control (TGC) processing [23]. For the current motion filter study, we feel that algorithm performance is most appropriately evaluated when additional signal/image processing is minimized, and thus we have not implemented TGC processing for any images shown in this document.
Fig. 1.
Motion filters comparison. for a simulated stationary phantom: (a) shows the reference image prior to motion filtering, (b) shows the output of the linear RB motion filter, (c) shows the output of the MB motion filter, and (d) shows plots of percent error for each filter’s output. All images are shown on the same displacement scale.
III. METHODS
The performance of the novel MB motion filter algorithm was evaluated using three types of data: 1) experimental ARFI images acquired of uniform tissue-mimicking phantoms, 2) simulated ARFI images acquired of modeled uniform and inclusion phantoms, and 3) in vivo ARFI images acquired of both healthy volunteers and patients recruited into an ongoing clinical study approved by the Institutional Review Board at Duke University Medical Center. Both qualitative and quantitative comparisons were made. Qualitative evaluation criteria included the assessment of boundary definition in simulated ARFI images of stiff inclusions with known size. Quantitative comparisons, when available, described the percent error associated with the output of each type of motion filter with respect to the ideal (non-motion filtered) image of a stationary target. For simulated inclusion phantoms, contrast-to-noise ratio (CNR) measurements were made using the following formula:
| (4) |
where 𝒰̄b is the mean displacement estimate of a region of phantom background material, 𝒰̄i is the mean displacement estimate in a region of the inclusion, and σb2 and σi2 represent the variances of the displacement estimates in the same background and inclusion regions, respectively. In all comparisons, the cutoff time for the RB filters was specified to be the time associated with the final tracking line in each region.
For evaluations where simulated bulk physiological motion was known to be of constant velocity, only results from the linear RB filter are provided. For in vivo evaluations, comparisons are made using all three motion filters described. For the purpose of this initial investigation, all evaluations are performed for simulated and clinical abdominal ARFI imaging. In order to focus interpretations solely upon relative motion filter performance, the range of tissue velocities and accelerations selected for use in the phantom studies were chosen such that image quality was not hampered significantly by decorrelation effects related to tissue motion [9]. Unless otherwise noted, all images and statistical analyses provided are from displacement fields tracked 0.9 ms following the cessation of radiation force application, a time consistent with peak focal displacement magnitude in abdominal ARFI imaging [9], [24]. Plots of motion filter performance in the experimental phantom are mean values obtained by averaging results from 10 independent trials. Error bars in these plots represent ± 1 standard deviation. Data in both simulated and experimental plots of percent error were downsampled spatially in order to aid visualization.
A. Finite Element Method Modeling
FEM models of the response of soft tissue to impulsive radiation force were used both as inputs to the MB motion filter and during the creation of simulated ARFI images. The complete modeling protocol has been covered extensively elsewhere [20]. Details of the model specific to the current study are outlined below.
A mesh composed of 0.45-mm, trilinear, cubic elements was generated using LS-PREPOST2 (Livermore Software Technology Corporation, Livermore, CA). Symmetry was assumed in the elevation plane. The mesh extended 12 cm axially from the transducer face, ± 1.75 cm laterally, and 1.5 cm along the elevation (symmetry) plane. The nodes in the top and bottom edges of the boundary were fully constrained [20]. Tissue was modeled as a linear, isotropic, elastic solid having a Poisson’s ratio of 0.499, a value chosen to balance the accuracy of modeled shear dynamics and the computational requirements of the simulation. Background tissue was assigned an elastic modulus of 4 to 8 kPa; stiff cylindrical inclusions were assigned an elastic modulus of 16 kPa. No slip was allowed between the boundaries of stiff inclusions and background tissue.
Field II, a linear ultrasound simulation program [25], was used to simulate pressure fields emitted during ARFI imaging. Pressure fields were converted to intensities, and then scaled to match empirically determined intensity values. Intensity values were converted to radiation force (F, a body force or force per unit volume) using the following expression:
| (5) |
where α is the absorption coefficient of the tissue (0.7 dB/cm/MHz), c is the speed of sound (1540 m/s), and I is the time average acoustic beam intensity at each nodal location. Calculated radiation forces were converted to nodal point loads by multiplying by the element volume. The three-dimensional displacement dynamics resulting from applied point loads were solved with LS-DYNA3D (Livermore Software Technology Corporation, Livermore, CA), an explicit, time-domain finite element analysis package. Models have been validated previously for several imaging configurations using calibrated tissue-mimicking phantoms [9], [20].
B. Experimental Phantom Data Acquisition
Experimental data were acquired using a Siemens SONOLINE Antares™ ultrasound scanner that had been modified to allow for custom beam sequencing and user access to raw RF data. A Siemens CH62 curvilinear transducer array operating at 2.5 MHz was used during data acquisition. Both radiation force and tissue tracking ultrasound beams were focused at a depth of 6.5 cm. Due to attenuation effects, radiation force push strength is strongest proximal to the focus. In this study, we will define the “focal region” as the depth range spanning 5 to 6.5 cm.
Images were acquired of a uniform tissue-mimicking phantom (Computerized Imaging Research Systems Inc., Norfolk, VA) with acoustic and mechanical properties representative of liver tissue (acoustic absorption of 0.75dB/cm/MHz, elastic modulus of 4 kPa ± 1 kPa). Bulk physiological motion was simulated using a three-axis linear translation stage (Newport Corporation, Irvine, CA) in a manner detailed in previous reports [9]. Focal displacement magnitude in the phantom images was on the order of 3 µm. The temporal tracking period for each region of excitation was 5.8 ms. With 50 total regions of excitation in the 2D image, total acquisition time was approximately 290 ms. Currently used clinical imaging protocols generally use fewer regions of excitation (reduced line density) and a slightly longer (∼7 ms) temporal tracking period.
Our group’s experience with the experimental phantom indicate that its elastic modulus is likely larger than the manufacturer-rated value of 4 kPa. Independent measurements of shear wave velocity in this phantom made by another laboratory support this claim and estimate its elastic modulus to be on the order of 5 kPa [26]. Thus, when applying the MB motion filter to images acquired of the experimental phantom, data from FEM simulations of displacement/recovery in a 5 kPa material were used as input information to the algorithm.
C. Simulated, ARFI Images
Simulated ARFI images were created of both uniform and inclusion phantom targets that were either stationary or experiencing bulk motion. These images were synthesized using a multi-step approach described in detail previously [9, [21]. The following is a brief description of the simulation process. Simulated RF data were created of diffuse scattering phantom targets using Field II. Simulated phantom targets were assigned an absorption of 0.7 dB/cm/MHz and an elastic modulus of 4 kPa. Simulated transducers were given focusing configurations similar to those used during experimental data acquisition. After reference RF data were acquired, scatterers in simulated phantoms were displaced from their reference positions using a trilinear interpolation of spatially registered nodal displacement data from FEM models of the tissue response to radiation force. A series of subsequent RF data lines were synthesized of these deformed phantoms throughout the displacement/recovery process at the experimental temporal sampling interval (0.23 ms). ARFI displacement images were generated by applying correlation-based tracking algorithms to data created with the Field II program. In some phantoms, in addition to simulated radiation force displacements, scatterers were also displaced from their reference positions in a manner representative of bulk physiological motion. Unless otherwise noted, peak focal displacement magnitude in simulated images was on the order of 3 µm. The temporal tracking interval for simulated data was 7 ms, a period typical for in vivo data acquisitions.
D. Clinical Data Acquisition
In vivo data were acquired of abdominal tissues using either a Siemens CH62 transducer operating at 2.5 MHz (volunteers) or a Siemens CH41 transducer operating at 2.2 MHz (patients). Acquisition occurred during patient breath-hold (usually held inspiration) and was electrocardiogram (ECG)-gated, commencing 350 ms following the detection of the QRS complex (representing ventricular depolarization). This ECG delay was empirically determined to be suitable for minimizing physiological motion in many segments of the liver in healthy volunteers. The degree of physiological motion encountered was strongly dependent on the segment of liver under investigation. Data were examined with all three motion filters; however, the lack of a known “gold-standard” image made all comparisons both qualitative and subjective. The number of regions of interrogation in 2D images and the length of the temporal tracking period in each region varied considerably from subject to subject. The most common temporal tracking interval utilized was 7 ms. These parameters were selected on a case-by-case basis to balance the trade-off between acquisition time and the required line density and field of view (FOV).
IV. RESULTS
A. Stationary Phantom Targets
This subsection investigates motion filter performance in stationary phantom targets. For these targets, the ideal motion filter output would be identical to the pre-motion filtered input. Thus, the results in this subsection provide insight into the magnitude of error inherent to each algorithm when used under the conditions of this study.
Fig. 1 shows results for a simulated stationary phantom: (a) shows the reference image prior to motion filtering, (b) shows the output of the linear RB motion filter, (c) shows the output of the MB motion filter, and (d) shows plots of percent error vs. depth for each filter output. As illustrated, the RB filter suppresses the magnitude of the radiation force displacement significantly, particularly in the near field. In this region, error for the RB filter is as high as 57%, whereas error for the MB filter is roughly 15%. In the focal zone, error is on the order of 6% for the RB filter and on the order of 1% for the MB filter.
It should be noted that since the same FEM model data are used both to generate the image in Fig. 1(c) and as an input to the MB motion filter algorithm, theoretically the error for the MB motion filter should be negligible. The residual error shown in Fig. 1(d) stems from the fact that the simulated temporal tracking period has been restricted to the longest interval currently utilized during clinical imaging. In the absence of the complete temporal information from the model, the MB algorithm falsely detects a small linear component in the tracked displacement profile (particularly in the near field). Extending the simulated tracking period will reduce the error associated with both motion filters, but may not reflect realistically achievable imaging conditions. We will revisit this issue in more depth later.
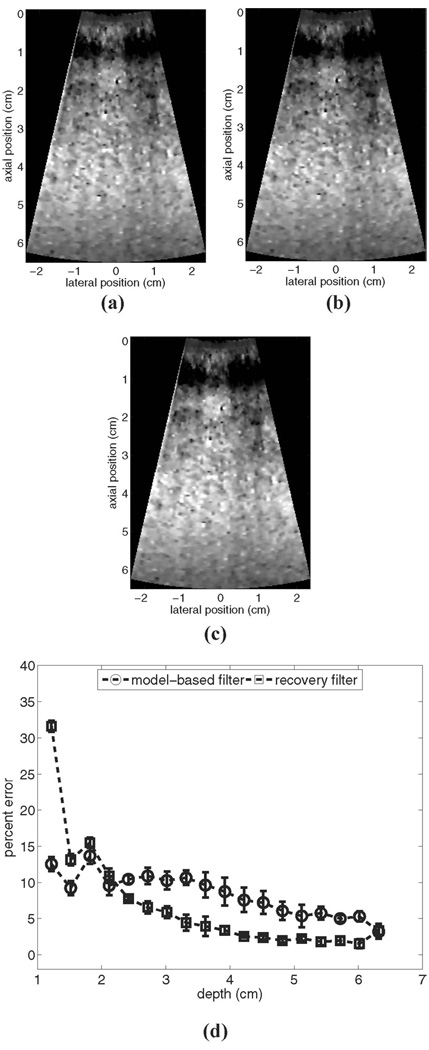
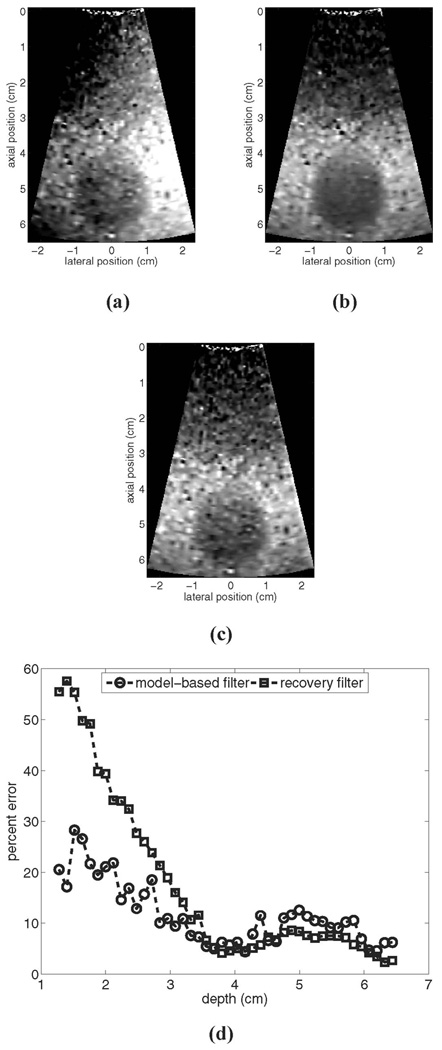
Fig. 2 shows experimental results for ARFI imaging of a stationary uniform phantom: (a) shows an example reference image prior to motion filtering, (b) shows the output of the linear RB motion filter for these data, (c) shows the output of the MB motion filter for these data, and (d) shows plots of the mean percent error vs. depth from 10 independent trials for each algorithm.
Fig. 2.
Motion filter comparison for an experimental stationary phantom: (a) shows the reference image prior to motion filtering, (b) shows the output of the linear RB motion filter, (c) shows the output of the MB motion filter, and (d) shows plots of percent error for each filter’s output. All images are shown on the same displacement scale.
From Fig. 2(d) we see that for the experimental measurements the RB motion filter performs more accurately than it did for the simulated measurements, despite the fact that the temporal tracking interval was shorter. This implies that the elastic modulus of the phantom is greater than 4 kPa (the modulus utilized for simulated phantoms) and supports the validity of using a 5-kPa material model as input to the MB filter algorithm for this application.
For the experimental stationary phantom shown in Fig. 2, the RB filter outperforms the MB filter for depths greater than 2.5 cm. In the focal region, error for the RB filter is roughly 2% and error for the MB filter is about 5.5%. However, the magnitude of error associated with the RB filter varies significantly with depth, a factor that limits the range over which stiffness comparisons can be made (although qualitative assessments of lateral stiffness variations performed over a restricted depth range remain reliable). The stability of the MB filter through depth may be advantageous in many imaging scenarios.
B. Phantom Targets, Constant Velocity
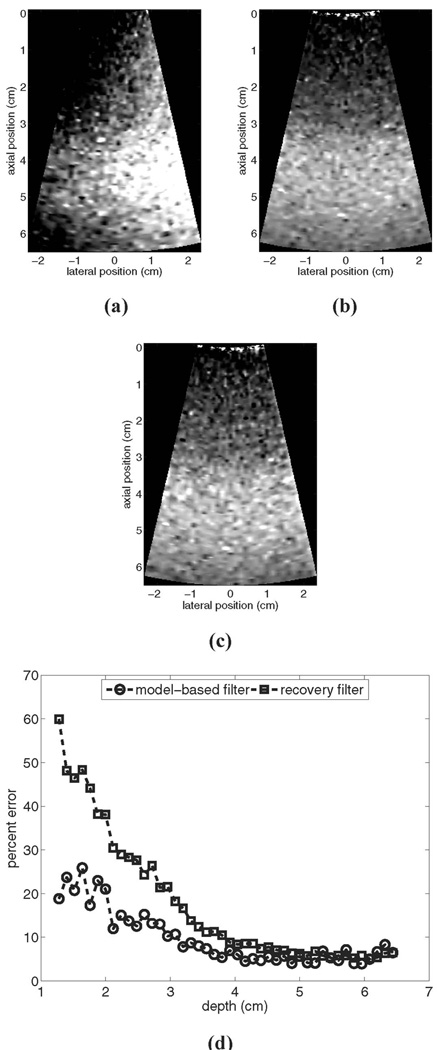
Fig. 3 provides a motion filter performance comparison for a simulated phantom moving laterally with a constant velocity of 5 mm/s: (a) shows the image prior to motion filtering, (b) shows the output of the linear RB motion filter, (c) shows the output of the MB motion filter, and (d) shows plots of percent error for each filter’s output relative to the reference image shown in Fig. 1(a).
Fig. 3.
Motion filter comparison for a simulated phantom moving laterally with a constant velocity of 5 mm/s: (a) shows the image prior to motion filtering, (b) shows the output of the linear RB motion filter, (c) shows the output of the MB motion filter, and (d) shows plots of percent error for each filter’s output relative to the reference image in Fig. 1 (a). All images are shown on the same scale.
The images in Fig. 3 show that qualitatively both filters perform adequately at removing motion artifacts. The RB motion filter still suffers from poor near-field performance, with the error curve in (d) similar to that shown for the stationary phantom in Fig. 1. Again, the MB motion filter outperforms the RB filter in the near field, although overall MB filter performance in this example is compromised slightly relative to that seen in Fig. 1. Maximum error for the RB motion filter is 60% versus a maximum error of 26% for the MB motion filter.
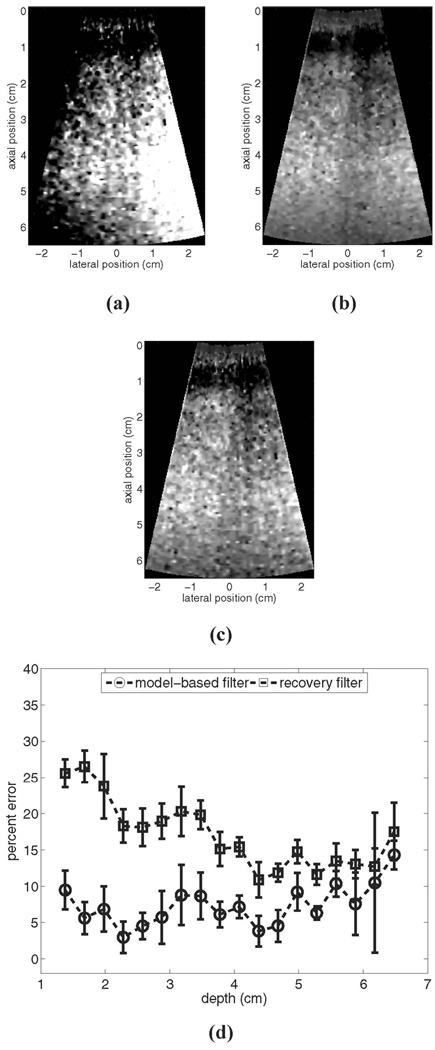
The matched experimental comparison is shown in Fig. 4. For these data, the experimental phantom was moving with a constant lateral velocity of 5 mm/s relative to the imaging transducer. Fig. 4(a) shows an example image prior to motion filtering, (b) shows the output of the linear RB motion filter for these data, (c) shows the output of the MB motion filter for these data, and (d) shows plots of the mean percent error for each algorithm relative to the reference image shown in Fig. 2(a) for 10 independent trials.
Fig. 4.
Motion filter comparison for the experimental phantom with a constant lateral velocity of 5 mm/s relative to the imaging transducer: (a) shows the image prior to motion filtering, (b) shows the output of the linear RB motion filter, (c) shows the output of the MB motion filter, and (d) shows plots of percent error for each filter’s output relative to the reference image in Fig. 2(a). All images are shown on the same scale.
Examination of Fig. 4(a)–(c) indicates that both filters also remove motion artifacts from the experimental images adequately. The error plots in (d) show that for most scan depths, the MB motion filter outperforms the RB filter. In the focal region, both motion filters perform similarly. The maximum mean errors are 14.5% (at a depth of 6.5 cm) for the MB filter and 26.5% for the RB filter (at a depth of 1.7 cm).
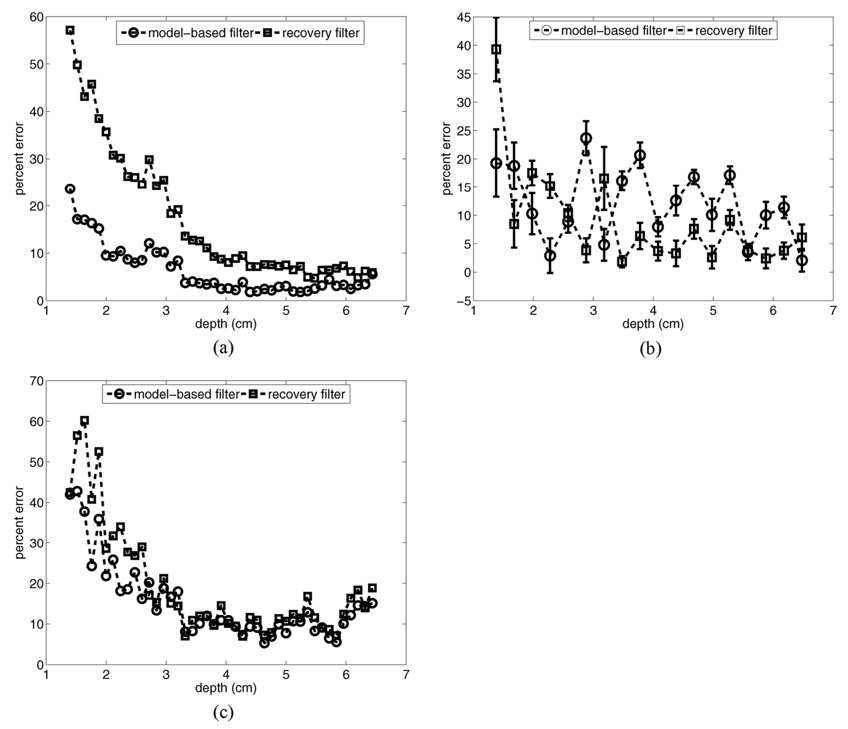
Fig. 5 shows plots of motion filter performance in the presence of axial target motion for both the simulated and experimental phantoms. Axial target motion has a large radial component (the tracking dimension) and generally produces more significant motion artifacts in tracked displacement maps relative to transverse motion [9]. Fig. 5(a) shows results for a simulated phantom moving at a velocity of 2 mm/s, (b) shows results for an experimental phantom moving at a velocity of 2 mm/s, and (c) shows results for a simulated phantom moving at a velocity of 50 mm/s. All results are for constant velocity motion away from the transducer.
Fig. 5.
Motion filter error plots for simulated and experimental phantom targets moving with a constant axial velocity: (a) shows results for a simulated phantom moving at a velocity of 2 mm/s, (b) shows results for an experimental phantom moving at a velocity of 2 mm/s, and (c) shows results for a simulated phantom moving at a velocity of 50 mm/s. All results are for constant velocity motion away from the transducer.
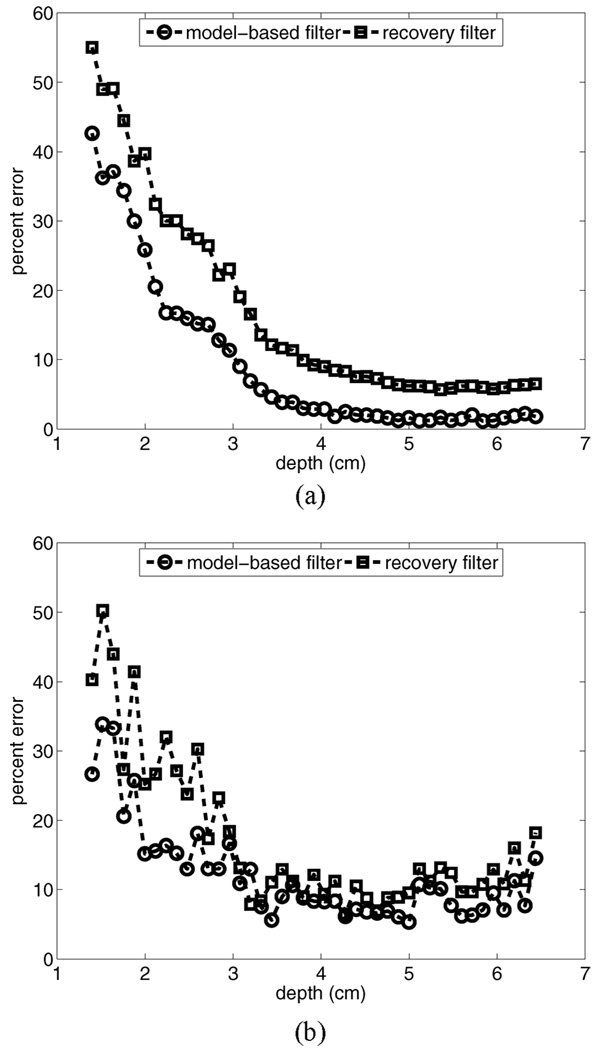
For the simulated phantom results shown in Fig. 5(a), the MB filter outperforms the RB filter at all depths. In the focal zone, error for the MB motion filter is on the order of 3%, while error for the RB motion filter is on the order of 6%. Maximum error in the near field is 23.5% for the MB filter and 57% for the RB filter.
For the experimental measurements [Fig. 5(b)], the performance of both motion filters varies somewhat erratically with depth. The mean error over all depths is 12.3% (±8.4%) for the MB motion filter and 9.1% (±11.6%) for the RB filter. Likely contributing to the large degree of variability in these plots are experimental difficulties associated with maintaining a consistent relative phantom/transducer position at the start of data acquisition for all 10 trials. This lack of precise synchronization between the data collection system and the translation stage made spatial registration between axially moving targets and a stationary reference target difficult.
Fig. 5(c) shows simulated results for a large (50 mm/s) axial velocity. In this situation, the MB filter outperforms the RB filter at depths shallower than 2.6 cm. Beyond this depth, the performance of the two filters is nearly identical. Maximum error for the RB filter is 63%, maximum error for the MB filter is 43%. The poor performance of the MB filter for this case compared to the lower axial velocity is likely related to the magnitude of the radiation force displacement (∼3 µm) relative to the magnitude of the motion artifact (70 µm) at the time of tracked displacement (0.9 ms after radiation force pulse, 1.4 ms after acquisition of the reference RF data line).
C. Simulated Inclusion Phantom
Fig. 6 provides a motion filter comparison for a simulated phantom with a 1 cm radius stiff inclusion centered at a depth of 5 cm. The background material has an elastic modulus of 4 kPa and the inclusion has an elastic modulus of 16 kPa. The simulated phantom was moving with a constant lateral velocity of 5 mm/s. Fig. 6(a) shows the image prior to motion filtering, (b) shows the output of the RB motion filter, (c) shows the output of the MB motion filter, and (d) shows plots of percent error for each filter’s performance. All ARFI images are shown on the same scale.
Fig. 6.
Motion filter comparison for a simulated inclusion phantom moving with a lateral velocity of 5 mm/s: (a) shows the image prior to motion filtering, (b) shows the output of RB motion filter, (c) shows the output of MB motion filter, and (d) shows plots of percent error for each filter’s performance. All ARFI images are shown on the same scale.
Qualitative inspection of Fig. 6 indicates that the boundary definition of the inclusion is similar in both motion-filtered images, although lesion detectability appears slightly compromised in the MB motion-filtered image. CNR is 1.9 for the MB filtered image and 2.3 for the RB filtered image.
Fig. 6(d) shows the percent error vs. depth for each motion filter relative to a stationary reference image. Away from the lesion, each filter performs nearly identically to the results shown for the uniform phantom with the same motion characteristics (see Fig. 3). The performance of both motion filters is compromised inside the inclusion, where recovery dynamics are complicated due to reflected shear waves re-entering the tracking region of interest. For regions inside the inclusion, the RB filter performs slightly more accurately than the MB filter. This is potentially due to the fact that the input FEM data to the MB algorithm is not reflective of the correct elastic modulus in this region.
D. Accelerating Phantom Targets
To this point, analyses have been focused upon the linear RB filter and the MB motion filter, both of which assume that any tissue motion not related to applied radiation force will be of constant velocity. In this subsection, we analyze motion filter performance when this criterion does not hold true and examine the effectiveness of the quadratic RB filter (which accounts for tissue acceleration) for this operating condition.
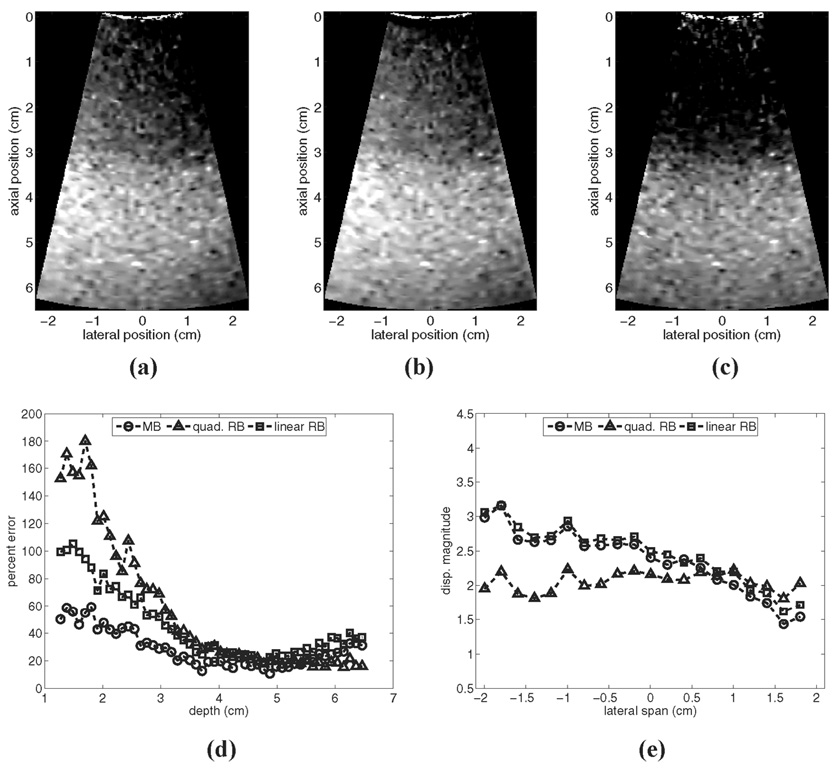
Fig. 7 provides a motion filter comparison for a simulated phantom moving with a constant lateral acceleration of 100 m/s2: (a)–(c) show output images from the linear RB filter, the MB filter, and the quadratic RB filter, respectively; (d) shows plots of percent error for each filter relative to the reference image in Fig. 1(a); and (e) shows the lateral variation in mean focal displacement magnitude in each output image. From the figures it is clear that, despite being the only algorithm that can accurately account for tissue acceleration, the quadratic RB filter performs the least accurately in the near field. Although focal zone performance is tolerable, displacement magnitude is suppressed severely throughout most depths, and error exceeds 180% in some near-field regions. The poor performance of the quadratic RB filter is related to the fact that the simulated tissue does not completely recover during the tracking interval (7 ms).
Fig. 7.
Motion filter comparison for a simulated phantom moving with a constant lateral acceleration of 100 cm/s2: (a)–(c) show output images from the linear RB filter, the MB filter, and the quadratic RB filter, respectively; (d) shows plots of percent error for each filter relative to the reference image in Fig. 1(a); and (e) shows the lateral variation in mean focal displacement magnitude in each output image.
The linear motion filters are relatively more tolerant of incomplete tissue recovery, and thus Fig. 7 indicates lower percent error for these filters relative to the quadratic RB filter. However, since the assumption of constant velocity is violated, motion artifacts are not removed adequately with these filters. As shown, residual displacements are larger on the left side of the images than on the right side, implying a laterally increasing stiffness gradient. This effect is illustrated quantitatively in Fig. 7(e). In many imaging scenarios, suppression of true displacement magnitude may be a welcome trade-off if spatially varying motion artifacts are removed adequately.
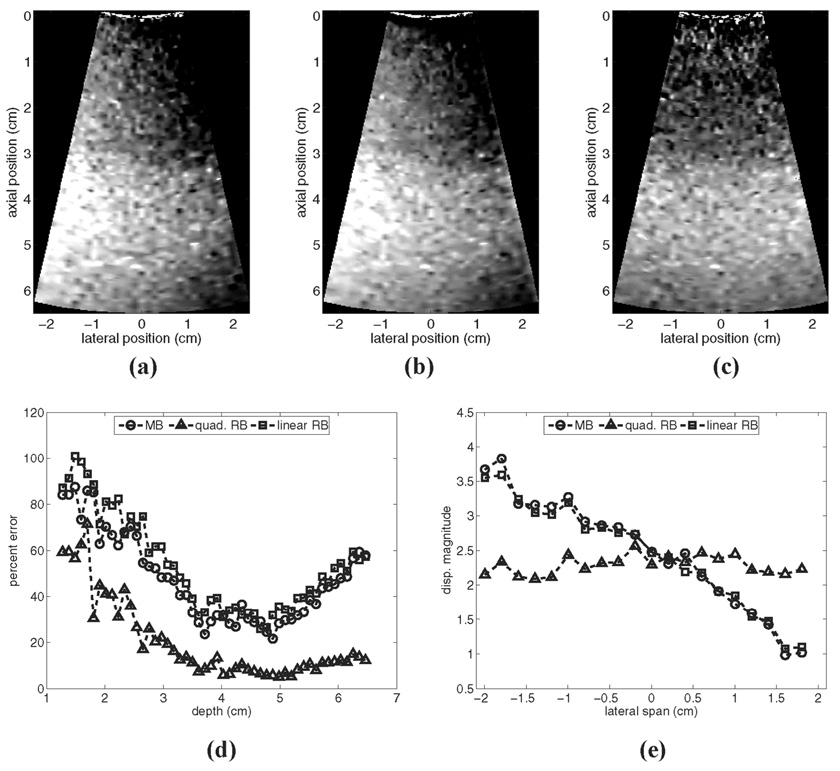
Fig. 8 shows how the performance of the motion filters in Fig. 7 changes if the temporal tracking interval (and also the cutoff time for the recovery filters) is extended from 7 ms to 11.6 ms. As indicated, the linear RB and MB motion filters perform relatively more poorly, and the output images [Fig. 8(a) and (b), respectively] contain more severe motion-related displacement artifacts. This performance degradation results from the larger velocity fluctuation that occurs over the extended tracking interval. Conversely, with the extended tracking interval, the error associated with the use of the quadratic RB filter is markedly decreased. The quadratic RB filter [Fig. 8(c)] outperforms the constant velocity filters (particularly in the focal zone, where tissues have completely recovered from radiation force excitation by the end of the tracking period). As indicated by Fig. 8(e), use of the quadratic motion filter in the presence of tissue acceleration removes motion related displacement artifacts effectively and preserves the lateral uniformity of the induced displacement field.
Fig. 8.
Motion filter comparison for a simulated phantom moving with a constant lateral acceleration of 100 cm/s2 with an extended (11.6 ms) tracking interval: (a)–(c) show output images from the linear RB filter, the MB filter, and the quadratic RB filter, respectively; (d) shows plots of percent error for each filter relative to the reference image in Fig. 1(a); and (e) shows the lateral variation in mean focal displacement magnitude in each output image.
E. Additional Phantom Evaluations
This subsection examines the relative performance of the motion filters as imaging parameters are varied. Although not intended as an all-encompassing analysis, the results provide an indication of how filter performance may change under alternative imaging conditions.
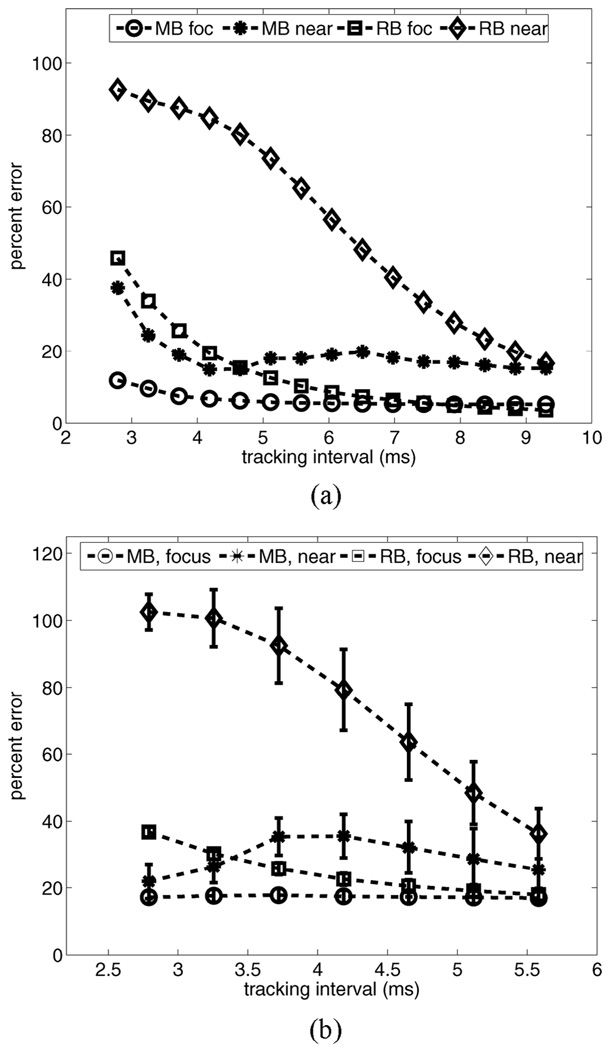
As implied by Fig. 8, the length of the temporal tracking interval significantly impacts motion filter performance. Fig. 9 plots motion filter performance vs. the length of the temporal tracking interval in simulated (a) and experimental (b) phantom targets moving with a constant lateral velocity of 5 mm/s. For each target, plots of mean percent error are shown for regions in the near field (depth range 1.5–2.5 cm) and in the focal region (depth range 5–6.5 cm) for both the MB and the RB motion filters. The experimental temporal tracking interval in (b) is limited by acquisition times used during data collection.
Fig. 9.
Motion filter performance vs. length of temporal tracking interval in simulated (a) and experimental (b) phantom targets moving with a constant lateral velocity of 5 mm/s. For each target, plots of mean percent error are shown for regions in the near field (depth range 1.5–2.5 cm) and focal region (depth range 5–6.5 cm) for both the MB and the RB motion filters.
For both phantoms, performance of the RB motion filter improves as the length of the tracking period increases. If tissues fully recover during the tracking period (for example, in the simulation focal zone after 8 ms), performance of the RB filter equals or exceeds that of the MB filter. However, in vivo acquisition time requirements for 2D imaging can require the tracking interval in each region to be as short as 3–5 ms. Note that in both the near field and the focal zone, MB motion filter performance is relatively stable over the range of tracking intervals shown.
All of the results presented thus far are for ARFI imaging with a focal displacement magnitude on the order of 3 µm. Fig. 10 provides a motion filter comparison for simulated phantoms with a peak radiation force displacement magnitude of 15 µm in the focal region. Results are provided for phantoms moving with a constant lateral velocity of 5 mm/s (a) and a constant axial velocity of 50 mm/s (b). Comparison of Fig. 10(a) to the 3-µm displacement case with the same velocity [see Fig. 3(d)] indicates that the RB motion filter performs nearly identically in both cases. The MB filter, however, shows improved performance in the focal zone despite a relative increase in error in the near field. For this displacement magnitude, the MB filter outperforms the RB filter for all depths.
Fig. 10.
Motion filter comparison for simulated phantoms with a peak radiation force displacement magnitude of 15 µm in the focal region. Results are provided for phantoms moving with a constant lateral velocity of 5 mm/s (a) and a constant axial velocity of 50 mm/s (b).
Fig. 10(b) shows how displacement magnitude affects motion filter performance for axial target motion. Comparison of these error plots to those shown in Fig. 5(c) indicates that both filters perform more accurately in the phantom with 15-µm displacement. This is likely attributable to the improved ratio of true radiation force displacement magnitude to motion artifact magnitude.
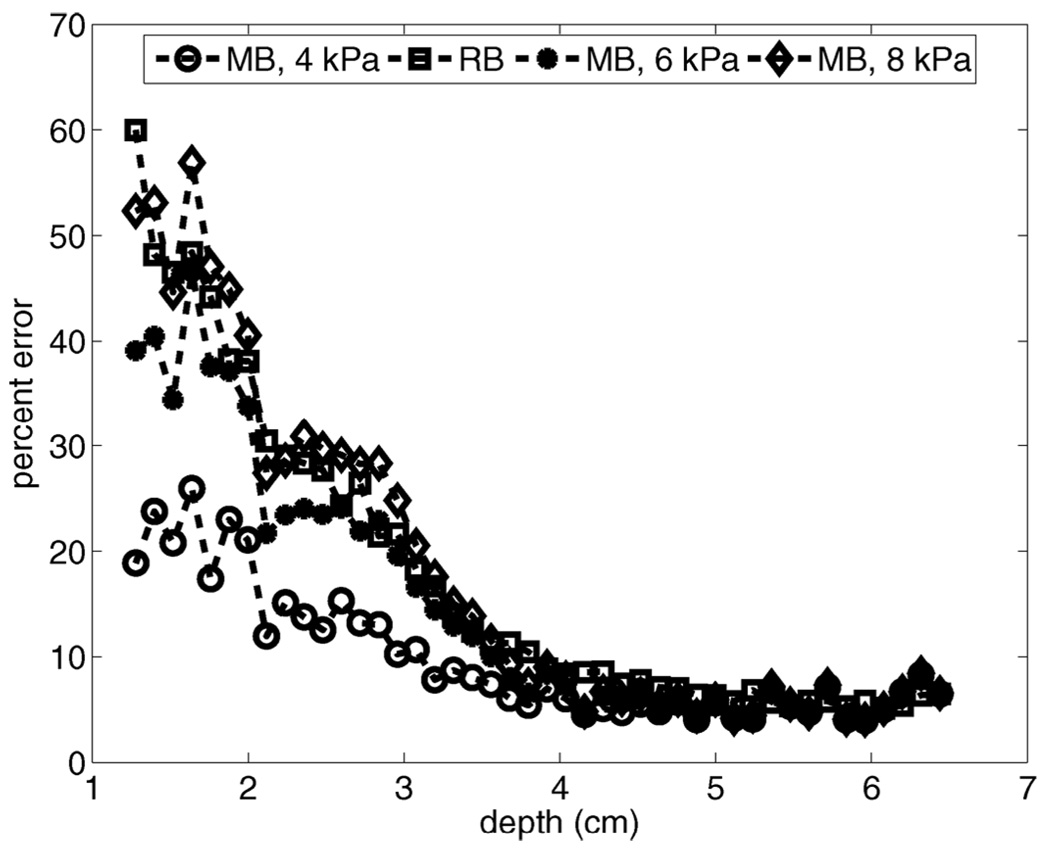
For all of the phantom studies presented, we have used precise a priori knowledge of expected elastic moduli to extract “best-case” results for the MB motion filter. Fig. 11 evaluates MB motion filter performance when the elastic modulus of tissue is incorrectly specified. Error plots vs. depth are provided for motion filtering a simulated 4-kPa phantom moving with a lateral velocity of 5 mm/s. Shown are results for the MB filter when models of 4, 6, and 8 kPa media are used as input to the algorithm. For reference, the error plot associated with the output of the linear RB motion filter is also shown.
Fig. 11.
Evaluation of MB motion filter performance when the elastic moduli of tissue is incorrectly specified. Error plots vs. depth are provided for motion filtering a simulated 4 kPa phantom moving with a lateral velocity of 5 mm/s. Shown are results for the MB filter when models of 4, 6, and 8 kPa media are used for filter input. For reference, the error plot associated with the output of the RB motion filter is also shown.
Fig. 11 indicates that, overall, error is smallest for the MB motion filter with the correct modulus input. However, all filters perform similarly in the focal zone. As shown, uncertainties with specifying the anticipated tissue modulus correctly cause MB filter performance to degrade to that of the RB filter. When the 8-kPa media model (200% of the correct modulus) is used as algorithm input, the MB filter performs similarly to the linear RB filter.
Another metric of motion filter performance is the SNR of output images. Moderate increases in motion artifact removal may not be justified if accompanied by significant increases in image noise. Table I compares SNR in the focal zone of output images produced by both motion filters in simulated phantoms with peak focal displacement magnitudes of 3 and 15 µm. For this purpose, the “signal” is considered to be the average displacement magnitude in a region, and the “noise” is considered to be the standard deviation of the displacement estimate in the same region. Results for phantoms moving with a lateral velocity of 5 mm/s and an axial velocity of 50 mm/s are shown. As indicated, focal zone SNR is similar for both filters. For reference, SNR for a non-motion-filtered simulated stationary phantom is 16.2 dB for the 3-µm case and 16.7 dB for the 15-µm case.
TABLE I.
SNR comparison for simulated images created using the rb and mb motion filters.
| Focal Zone SNR of Output Images | |||
|---|---|---|---|
| Target Motion | Focal Disp. | RB filter | MB filter |
| Lateral 5 mm/s | 3 µm | 15.9 dB | 15.1 dB |
| 15 µm | 16.4 dB | 16.7 dB | |
| Axial 50 mm/s | 3 µm | 15.6 dB | 15.7 dB |
| 15 µm | 15.7 dB | 16.0 dB | |
Shown are values obtained after motion filtering of phantoms moving with a constant 5 mm/s lateral velocity and a constant 50 mm/s axial velocity. All values were calculated in the focal zone (depth range of 5 to 6.5 cm).
F. In Vivo Evaluations
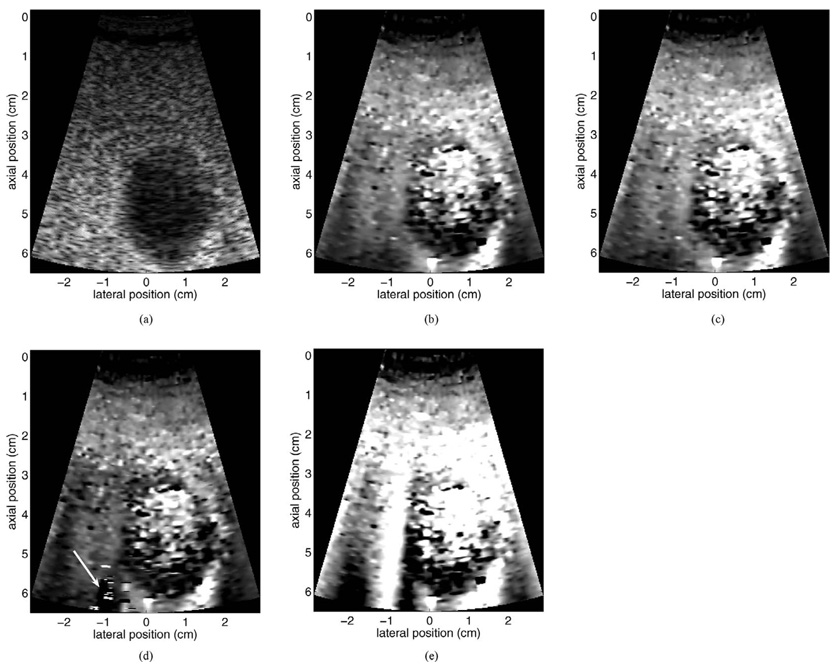
In this subsection, we evaluate motion filter performance when used with in vivo image data. Although the lack of a “gold standard” image makes comparison of different motion filters ambiguous, qualitative assessments are possible. Fig. 12 provides a motion filter comparison for data acquired from a healthy 52-year-old male volunteer. Shown are B-mode (a) and linear RB motion-filtered (b), MB motion-filtered (c), and quadratic RB motion-filtered (d) ARFI images. The non-motion-filtered raw displacement data (containing large motion artifacts) is also provided in (e) for reference. Seen in the image is a transverse cross section of the gallbladder, surrounded by fatty and liver tissue. The images were acquired with a 6.5-cm transmit focus using a subcostal acoustic window. The length of the tracking interval was 8.1 ms in each region, and total image acquisition time was approximately 325 ms. All ARFI images are shown with the same displacement scale.
Fig. 12.
Motion filter comparison for data acquired from a healthy 52-year-old male volunteer. Shown are B-mode (a) and linear RB motion filtered (b), MB motion filtered (c), and quadratic RB motion filtered (d) ARFI images of a transverse gallbladder view. The non-motion filtered raw displacement data are shown in (e) for reference. Note the significant motion artifacts in the non-motion filtered image. Arrow in (d) indicates region of residual motion artifacts. All ARFI images are shown with the same displacement scale.
For the data shown in Fig. 12, physiological tissue motion during image acquisition was present, but of low velocity. Despite minimal physiological motion, motion artifacts are evident in several regions of the non-motion-filtered displacement map (for example, in the bottom-left corner of the image and the bright vertical streak at −1 cm). Output images from the linear RB and MB motion filters show no obvious motion artifacts, and qualitatively the two images appear similar. The output image produced by the quadratic RB filter contains a region [indicated by arrow in (d)] consistent with unremoved motion artifacts. This image also shows lower displacement magnitude throughout the FOV. In each ARFI image, noisy regions of widely varying displacement are seen within the gallbladder lumen, as a result of an extremely low RF data signal in this region.
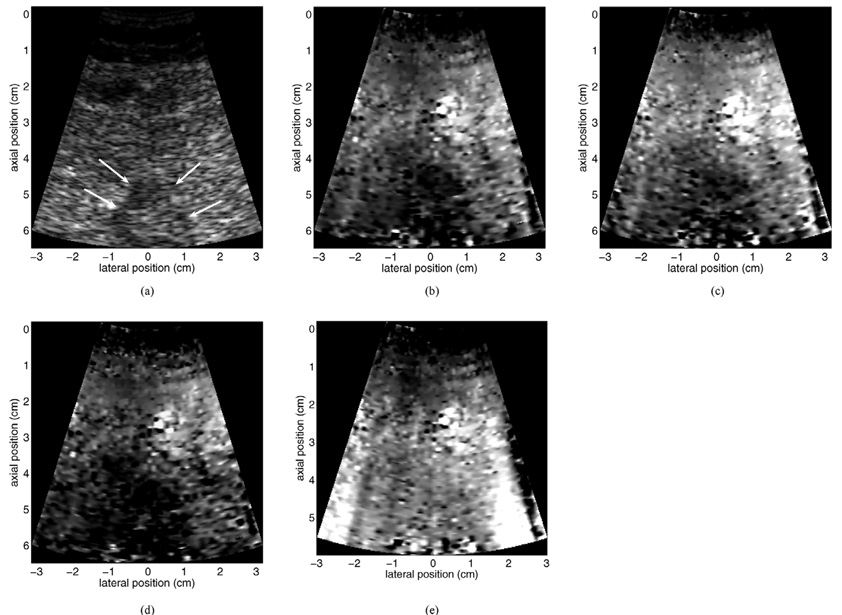
Fig. 13 provides a motion filter comparison for data acquired from a 62-year-old female patient. Shown are Bmode (a) and linear RB motion-filtered (b), MB motion-filtered (c), and quadratic RB motion-filtered (d) ARFI images of a thermal lesion [indicated by arrows in (a)] created with radio frequency ablation (RFA) in the left hepatic lobe. The thermal lesion had been used to treat a metastatic mass in the patient’s non-cirrhotic liver. The images were acquired with a 6.5-cm transmit focus using a subcostal acoustic window. The length of the tracking interval was 5.8 ms in each region, and total image acquisition time was approximately 255 ms. All ARFI images are shown with the same displacement scale. For reference, the non-motion-filtered raw displacement data (containing large motion artifacts) are provided in (e).
Fig. 13.
Motion filter comparison for data acquired from a 62-year-old female patient. Shown are B-mode (a) and linear RB motion filtered (b), MB motion filtered (c), and quadratic RB motion filtered (d) ARFI images of a thermal lesion created with RFA in the left hepatic lobe. The non-motion filtered raw displacement data are shown in (e) for reference. Note the significant motion artifacts in the non-motion filtered image. Arrows in (a) indicate boundaries of the thermal lesion in the B-mode image. All ARFI images are shown with the same displacement scale.
During image acquisition for the patient data shown in Fig. 13, tissue motion in the region of interest was extreme. The heart was located immediately posterior to the FOV shown in the images, and the surrounding tissues appeared to move with similar velocity and displacement magnitude as the heart itself. Despite this, all motion filters appear to remove displacement artifacts from ARFI images reasonably well (although residual artifacts remain at the extreme lower right of all three images). This is particularly true for the artifact-induced vertical streaks seen at both edges of the non-filtered displacement map (e). The thermal lesion is evident (albeit noisy and somewhat ambiguous) in each ARFI image as a dark region of reduced displacement. Using the B-mode image as a reference, the linear RB and MB filters appear to portray the thermal lesion boundaries more accurately than the quadratic RB filter. Relative to both RB filters, the MB motion filter shows more uniform displacement magnitude in regions of background liver tissue.
V. DISCUSSION AND CONCLUSIONS
We have introduced a novel method of reducing artifacts stemming from physiological and/or transducer motion in displacement estimates made during radiation force elasticity imaging. Using simplified but reasonable evaluations, we have demonstrated that in many circumstances (and under realistic operating conditions), the new MB motion filter equals or betters the performance of traditionally used RB motion filters. In particular, MB motion filter performance is significantly superior if the temporal length of tissue tracking intervals is short relative to tissue recovery times. If tracking intervals are sufficiently long, the quadratic RB motion filter may perform best in the presence of significant tissue acceleration.
A major advantage of the MB motion filter is its performance stability over a wide range of depths. This feature is not associated with the RB motion filters. As a consequence of both the depth-dependent temporal response of tissue to impulsive radiation force and the requirement of short tracking intervals in each region, the RB filters tend to perform more accurately in the focal zone and more poorly in the near field. This can limit the depth range over which relative stiffness comparisons can be made, and is a major disadvantage associated with RB motion filtering.
In the presence of ample tissue acceleration, the ability of the linear RB and MB motion filters to remove motion artifacts adequately is impaired. For these situations, use of the quadratic RB motion filter may be optimal. Although this algorithm will dramatically suppress true displacement magnitude in tissue regions that do not recover fully prior to the filter cutoff time, this is a welcome trade-off in many imaging scenarios if motion artifacts can be successfully removed from displacement estimates. Future efforts will investigate the utility of a quadratic MB filter.
A limited range of tissue velocities and accelerations was examined in this study, with only a select few examples provided in this manuscript. These examples were selected, in part, because motion characteristics were of significantly low amplitude such that effects stemming from RF data line decorrelation would not impact analysis of motion filter performance [9]. However, the velocity and acceleration magnitudes used in this study are representative of magnitudes found in vivo [7], [9]. Additionally, the analyses provided have focused upon removing physiological motion in the lateral and axial dimension, and have ignored motion in the elevation (out-of-plane) dimension. For a 1-D transducer, motion in the elevation dimension has no component in the tissue tracking dimension. Therefore, elevation motion will not create displacement artifacts in images (although it will decorrelate RF data lines used for tracking, thus increasing the variance of the displacement estimate).
In vivo, tissue motion will likely not be of the simplified nature examined in this study. Hence, although the MB motion filter appears suitable for use with most abdominal applications, in practice this may not hold true. However, for the in vivo examples provided in this study, the MB motion filter appears to perform equivalently to, if not better than, the RB filters.
All results presented were for evaluations mimicking realistic abdominal imaging scenarios. The combination of factors such as low transmit frequencies, wide ultrasound beamwidths, and the relatively compliant nature of liver tissue causes tissue recovery times to be longer for this imaging condition than for other situations, such as cardiac or breast imaging. For faster tissue recovery times, RB motion filter performance will improve for a given tissue tracking interval length. Given the results shown in Fig. 7 and Fig. 8, this may have a significant impact on the suitability of the quadratic RB motion filter in certain tissues. Also, for smaller depths of field, the instability of RB motion filter output with depth may become a negligible factor when choosing which motion filter algorithm is most appropriate.
The effectiveness of the MB motion filter is strongly dependent on the accuracy of the FEM model used as input information to the algorithm. Although Fig. 11 indicates that the algorithm can tolerate significant modulus misestimations with minimal performance degradation, severe errors will likely introduce artifacts into output images. Further complications are associated with the application of a homogeneous FEM model to tissue with heterogeneous mechanical properties. As indicated by Fig. 6, performance of both the RB and MB filters suffers locally in heterogeneous regions, where post-excitation tissue dynamics are complex. Specifically, reflected shear waves reentering the tracking region make separation of physiological and radiation force-induced tissue displacement difficult. To our knowledge, the literature does not describe an algorithm that can perform this task adequately given information that is available a priori in a clinical setting.
Utilization of a simplified FEM tissue model may limit the applicability of the MB filter algorithm in cardiac applications. Due to the contraction/relaxation process, local stiffness in cardiac tissue fluctuates throughout the cardiac cycle [19], [23]. Thus, accurate FEM modeling of radiation force-induced tissue dynamics becomes difficult, with a single model not being useful for filtering during all portions of the cycle. The issue is further confounded by the changing thickness of the chamber wall through the cardiac cycle, as precise knowledge of this parameter is required for accurate modeling. Given the degree of acceleration experienced by cardiac tissues (and, generally, rapid tissue recovery from radiation force excitation in this region), the quadratic RB motion filter is likely the most suitable for this application [19].
In practice, choice of motion compensation algorithm will likely depend upon several factors, including target anatomy and the visualization requirements of the imaging protocol. Although greater accuracy may be achieved through use of the MB motion filter, this algorithm is currently not implemented in real-time. Run time for the MB motion filter is about 110× that of linear RB filter and 55× that of the quadratic RB filter. This makes the MB filter algorithm impractical for situations requiring real-time visualization (a feature associated with the linear RB filter), such as device placement guidance during interventional procedures. However, many diagnostic imaging protocols involve offline image analysis that is compatible with the computational requirements of the MB motion filter. For such cases, use of the MB filter could be advantageous.
In conclusion, we have introduced a novel motion compensation algorithm for use with radiation force elasticity imaging and evaluated its performance under a wide range (though not all-inclusive) of operating conditions. For brevity, evaluations were focused upon imaging configurations consistent with abdominal imaging. Despite being limited by inherent assumptions incorporated into its design, the new algorithm performs favorably in many realistic imaging scenarios. Although future efforts are required to determine the suitability of the model-based motion filter for other imaging conditions, it appears that this new algorithm is a practical choice for motion compensation in liver tissue.
ACKNOWLEDGMENT
We thank Siemens Medical Solutions USA, Inc., Ultrasound Division, Mountain View, CA, for their system support.
This work was supported by NIH grants R01-HL-075485 and R01-CA-114093.
Biographies

Brian J. Fahey was born in Lowell, MA, in 1980. He received the B.S. degree in biomedical engineering from Trinity College in Hartford, CT, in 2002. He received the Ph.D. degree in biomedical engineering from Duke University in Durham, NC, in 2007. Following graduate school, Brian was a fellow in the Biodesign Innovation program at Stanford University in Stanford, CA, where he focused upon the development of novel medical technologies. His research interests include elasticity imaging, finite element method modeling, rapid concept development, and medical device innovation.

Stephen J. Hsu was born in Huntsville, AL, in 1980. He received his B.S.E. degree in biomedical and electrical engineering from Duke University, Durham, NC, in 2001. He currently is a Ph.D. graduate student in the Duke University Biomedical Engineering Department.
His research interests include acoustic radiation force impulse imaging and cardiac ultrasound imaging.

Gregg E. Trahey (S’83–M’85) received the B.G.S. and M.S. degrees from the University of Michigan, Ann Arbor, MI, in 1975 and 1979, respectively. He received the Ph.D. degree in biomedical engineering in 1985 from Duke University, Durham, NC. He served in the Peace Corps from 1975 to 1978 and was a project engineer at the Emergency Care Research Institute in Plymouth Meeting, PA, from 1980–1982. He is a professor with the Department of Biomedical Engineering, Duke University.
He is conducting research in adaptive phase correction, radiation force imaging methods, and 2-D flow imaging in medical ultrasound.
REFERENCES
- 1.Kasai C, Koroku N, Koyano A, Omoto R. Real-time two-dimensional blood flow imaging using an autocorrelation technique. IEEE Trans. Sonics Ultrason. 1985;vol. SU-32(no 3):458–463. [Google Scholar]
- 2.Trahey G, Allison J, VonRamm O. Angle independent ultrasonic detection of blood flow. IEEE Trans. Biomed. Eng. 1987;vol. BME-34(no 12):965–967. doi: 10.1109/tbme.1987.325938. [DOI] [PubMed] [Google Scholar]
- 3.O’Donnell M, Skovoroda A, Shapo B, Emelianov S. Internal displacement and strain imaging using ultrasonic speckle tracking. IEEE Trans. Ultrason., Ferroelect., Freq. Contr. 1994;vol. 41(no 3):314–325. [Google Scholar]
- 4.Gao L, Parker K, Lerner R, Levinson S. Imaging of the elastic properties of tissue—A review. Ultrasound Med. Biol. 1996;vol. 22(no 8):959–977. doi: 10.1016/s0301-5629(96)00120-2. [DOI] [PubMed] [Google Scholar]
- 5.Greenleaf JF, Fatemi M, Insana M. Selected methods for imaging elastic properties of biological tissues. Annu. Rev. Biomed. Eng. 2003;vol. 5:57–78. doi: 10.1146/annurev.bioeng.5.040202.121623. [DOI] [PubMed] [Google Scholar]
- 6.Hall TJ. AAPM/RSNA physics tutorial for residents: Topics in US: Beyond the basics: Elasticity imaging with US. Radiographics. 2003;vol. 23(no 6):1657–1671. doi: 10.1148/rg.236035163. [DOI] [PubMed] [Google Scholar]
- 7.Kolen AF, Miller NR, Ahmed EE, Bamber JC. Characterization of cardiovascular liver motion for the eventual application of elasticity imaging to the liver in vivo. Phys. Med. Biol. 2004 Sep.vol. 49(no 18):4187–4206. doi: 10.1088/0031-9155/49/18/001. [DOI] [PubMed] [Google Scholar]
- 8.Chandrasekhar R, Ophir J, Krouskop T, Ophir K. Elastographic image quality vs. tissue motion in vivo. Ultrasound Med. Biol. 2006 Jun.vol. 32(no 6):847–855. doi: 10.1016/j.ultrasmedbio.2006.02.1407. [DOI] [PubMed] [Google Scholar]
- 9.Fahey BJ, Palmeri ML, Trahey GE. The impact of physiological motion on tissue tracking during radiation force imaging. Ultrasound Med. Biol. 2007 Jul.vol. 33(no 7):1149–1166. doi: 10.1016/j.ultrasmedbio.2007.01.007. [DOI] [PMC free article] [PubMed] [Google Scholar]
- 10.Sarvazyan A, Rudenko O, Swanson S, Fowlkes J, Emelianov S. Shear wave elasticity imaging: A new ultrasonic technology of medical diagnostics. Ultrasound Med. Biol. 1998;vol. 24(no 9):1419–1435. doi: 10.1016/s0301-5629(98)00110-0. [DOI] [PubMed] [Google Scholar]
- 11.Nightingale KR, Soo MS, Nightingale RW, Trahey GE. Acoustic radiation force impulse imaging: In vivo demonstration of clinical feasibility. Ultrasound Med. Biol. 2002;vol. 28(no 2):227–235. doi: 10.1016/s0301-5629(01)00499-9. [DOI] [PubMed] [Google Scholar]
- 12.Lizzi FL, Muratore R, Deng CX, Ketterling JA, Alam SK, Mikaelian S, Kalisz A. Radiation-force technique to monitor lesions during ultrasonic therapy. Ultrasound Med. Biol. 2003 Nov.vol. 29(no 11):1593–1605. doi: 10.1016/s0301-5629(03)01052-4. [DOI] [PubMed] [Google Scholar]
- 13.Sandrin L, Fourquet B, Hasquenoph JM, Yon S, Fournier C, Mal F, Christidis C, Ziol M, Poulet B, Kazemi F, Beaugrand M, Palau R. Transient elastography: A new noninvasive method for assessment of hepatic fibrosis. Ultrasound Med. Biol. 2003 Dec.vol. 29(no 12):1705–1713. doi: 10.1016/j.ultrasmedbio.2003.07.001. [DOI] [PubMed] [Google Scholar]
- 14.Bercoff J, Tanter M, Fink M. Supersonic shear imaging: A new technique for soft tissue elasticity mapping. IEEE Trans. Ultrason., Ferroelect., Freq. Contr. 2004 Apr.vol. 51(no 4):396–409. doi: 10.1109/tuffc.2004.1295425. [DOI] [PubMed] [Google Scholar]
- 15.Girnyk S, Barannik A, Barannik E, Tovstiak V, Marusenko A, Volokhov V. The estimation of elasticity and viscosity of soft tissues in vitro using the data of remote acoustic palpation. Ultrasound Med. Biol. 2006 Feb.vol. 32(no 2):211–219. doi: 10.1016/j.ultrasmedbio.2005.11.015. [DOI] [PubMed] [Google Scholar]
- 16.Melodelima D, Bamber JC, Duck FA, Shipley JA, Xu L. Elastography for breast cancer diagnosis using radiation force: System development and performance evaluation. Ultrasound Med. Biol. 2006 Mar.vol. 32(no 3):387–396. doi: 10.1016/j.ultrasmedbio.2005.12.003. [DOI] [PubMed] [Google Scholar]
- 17.Fahey BJ, Nelson RC, Bradway DP, Hsu SJ, Dumont DM, Trahey GE. In vivo visualization of abdominal malignancies with acoustic radiation force elastography. Phys. Med. Biol. 2008;vol. 53(no 1):279–293. doi: 10.1088/0031-9155/53/1/020. [DOI] [PMC free article] [PubMed] [Google Scholar]
- 18.Jensen JA. Estimation of Blood Velocities Using Ultrasound: A Signal Processing Approach. New York: Cambridge University Press; 1996. [Google Scholar]
- 19.Hsu SJ, Bouchard RB, Dumont DM, Wolf PD, Trahey GE. Acoustic radiation force impulse imaging of the cardiac cycle. Circulation. to be published. [Google Scholar]
- 20.Palmeri ML, Sharma AC, Bouchard RR, Nightingale RW, Nightingale KR. A finite-element method model of soft tissue response to impulsive acoustic radiation force. IEEE Trans. Ultrason., Ferroelect., Freq. Contr. 2005 Oct.vol. 52(no 10):1699–1712. doi: 10.1109/tuffc.2005.1561624. [DOI] [PMC free article] [PubMed] [Google Scholar]
- 21.Palmeri ML, McAleavey SA, Trahey GE, Nightingale KR. Ultrasonic tracking of acoustic radiation force-induced displacements in homogeneous media. IEEE Trans. Ultrason., Ferroelect., Freq. Contr. 2006;vol. 53(no 7):1300–1313. doi: 10.1109/tuffc.2006.1665078. [DOI] [PMC free article] [PubMed] [Google Scholar]
- 22.Palmeri ML, McAleavey SA, Fong KL, Trahey GE, Nightingale KR. Dynamic mechanical response of elastic spherical inclusions to impulsive acoustic radiation force excitation. IEEE Trans. Ultrason., Ferroelect., Freq. Contr. 2006 Nov.vol. 53(no 11):2065–2079. doi: 10.1109/tuffc.2006.146. [DOI] [PMC free article] [PubMed] [Google Scholar]
- 23.Fahey BJ, Nightingale KR, McAleavey SA, Palmeri ML, Wolf PD, Trahey GE. Acoustic radiation force impulse imaging of myocardial radiofrequency ablation: Initial in vivo results. IEEE Trans. Ultrason., Ferroelect., Freq. Contr. 2005;vol. 52(no 4):631–641. doi: 10.1109/tuffc.2005.1428046. [DOI] [PubMed] [Google Scholar]
- 24.Fahey BJ, Hsu SJ, Wolf PD, Nelson RC, Trahey GE. Liver ablation guidance with acoustic radiation force impulse imaging: Challenges and opportunities. Phys. Med. Biol. 2006;vol. 51:3785–3808. doi: 10.1088/0031-9155/51/15/013. [DOI] [PMC free article] [PubMed] [Google Scholar]
- 25.Jensen JA, Svendsen NB. Calculation of pressure fields from arbitrarily shaped, apodized, and excited ultrasound transducers. IEEE Trans. Ultrason., Ferroelect., Freq. Contr. 1992;vol. 39(no 2):262–267. doi: 10.1109/58.139123. [DOI] [PubMed] [Google Scholar]
- 26.Palmeri ML, Frinkley KD, Zhai L, Nightingale KR. Unpublished results. [Google Scholar]


