

Abstract
Purpose
To characterize physiologic inter-eye differences in optic nerve head (ONH) architecture within six normal rhesus monkeys and compare them to inter-eye differences within three previously-reported cynomolgus monkeys with early experimental glaucoma (EEG).
Methods
Trephinated ONH and peripapillary sclera from both eyes of six normal monkeys were serial sectioned, 3D reconstructed, 3D delineated and parameterized. For each normal animal, and each parameter, physiologic inter-eye difference (PID) was calculated (both overall and regionally) by converting all OS data to OD configuration and subtracting the OS from the OD value and Physiologic Inter-eye Percent Difference (PIPD) was calculated as the PID divided by the measurement mean of the two eyes. For each EEG monkey, inter-eye (EEG minus normal) differences and percent differences for each parameter overall and regionally were compared to the PID and PIPD Maximums.
Results
For all parameters the PID Maximums were relatively small overall. Compared to overall PID maximums, overall inter-eye differences in EEG monkeys were greatest for laminar deformation and thickening, posterior scleral canal enlargement, cupping and prelaminar neural tissue thickening. Compared to the regional PID Maximums, the lamina cribrosa was posteriorly deformed centrally, inferiorly, inferonasally and superiorly and was thickened centrally. The prelaminar neural tissues were thickened inferiorly, inferonasally and superiorly.
Conclusion
These data provide the first characterization of PID/PIPD maximums for ONH neural and connective tissue parameters in normal monkeys and serve to further clarify the location and character of early ONH change in experimental glaucoma. However, because of the species differences, the findings in EEG need to be confirmed within EEG rhesus monkey eyes.
Keywords: Glaucoma, Physiologic Inter-eye Difference, Optic Nerve Head, Neural Canal, Optic Nerve Head Connective Tissue, Prelaminar Neural Tissue
In the monkey model of unilateral experimental glaucoma (EG), chronic intraocular pressure (IOP) elevation is induced in one eye of an animal, while the contralateral eye is maintained as a normal control1-10. In our laboratory, animals are sacrificed at clinically defined endpoints of early, moderate or severe glaucomatous damage on the basis of longitudinal Confocal Scanning Laser Tomographic (CSLT) imaging of the study eye, and then in a subset of experiments perfusion fixed with both eyes set to 10 mm Hg by anterior chamber manometer11-13. In these experiments, post-mortem histomorphometric11-13 analyses are then carried out in which the differences between the treated and control eyes are assumed to be due to the pathophysiology of glaucomatous damage.
We recently introduced our method for three dimensional (3-D) delineation of 13 optic nerve head (ONH) and peripapillary sclera landmarks, and used it to quantify enlargement and elongation of the neural canal at the onset of CSLT-detected ONH surface change in three monkeys with early experimental glaucoma (EEG) that occurred following moderate levels of IOP elevation in one eye11. In a second report12, we described our method for continuously mapping position and thickness of the lamina cribrosa, scleral flange and peripapillary sclera and used it to report significant posterior deformation and thickening of the lamina cribrosa accompanied by mild posterior deformation of the scleral flange and peripapillary sclera in the same EEG eyes. In a third report13, we introduced our concept of prelaminar and laminar cupping, and used four new, post-mortem 3-D histomorphometric parameters to report that clinical cupping in early glaucoma is primarily due to fixed permanent posterior deformation of the ONH connective tissues and occurs in the setting of prelaminar tissues that are thickened.
The purpose of the current study was to characterize the upper range of physiologic, inter-eye differences (PIDs) and percent differences (PIPDs) in ONH neural and connective tissue architecture within 6 normal monkeys and compare them to inter-eye differences within the three previously-reported monkeys with EEG in one eye11-13 so as to clarify the most important optic nerve head changes in early experimental glaucoma. Once clarified by region and character, and confirmed in a larger number of EEG eyes, (reports in preparation), these changes should become important imaging targets for human patients with moderate levels of ocular hypertension.
Materials and Methods
Animals
All animals were treated in accordance with the Association for Research in Vision and Ophthalmology (ARVO) Statement for the Use of Animals in Ophthalmic and Vision Research. Three male and 3 female normal rhesus monkeys (2 - 10 years old), were used for this study. IOP measured under ketamine and xylazine anesthesia ranged from 8 to 14 mm Hg in both eyes of all six monkeys. The three cynomolgus EEG monkeys and their treatment have been extensively described in our four previous reports11-14.
ONH Surface Compliance Testing and Early Glaucoma
We have previously described our Laser Diagnostic Technologies (LDT, San Diego, CA) Confocal Scanning Laser Tomography (CSLT)-based ONH surface compliance testing strategy and how we use it to detect the onset of EEG.14, 15 Briefly, for each compliance test, animals were initially anesthetized with a combination of 7 mg/kg ketamine and 1 mg/kg xylazine given intramuscularly, then IOP was measured (Tono-Pen XL; Bio-Rad, Glendale, CA) three times for each eye and a contact lens was placed to maintain the corneal surface for CSLT imaging.
In all normal monkeys, both eyes were compliance tested on three to five separate occasions prior to euthanasia under pentobarbital anesthesia. In the early glaucoma monkeys, both eyes of each monkey were imaged on three separate occasions while normal, and then lasering of the trabecular meshwork was begun in one eye of each animal to elevate IOP. CSLT imaging was continued at two-week intervals until the onset of significant permanent posterior deformation of the ONH surface in the lasered eye (the EEG eye), compared to the contralateral eye (the normal eye) using the CSLT-based parameter Mean Position of the Disc.14 See Table 1 and Figure 1 in our previous publication regarding the magnitude and duration of IOP elevation experienced by each animal.14 Briefly EEG monkeys 2 and 3 were euthanized three weeks and monkey 1 six weeks after CSLT detection of ONH surface change. In EEG monkey 1, detected IOP elevation occurred about 1 week prior to sacrifice with the maximum 26 mm Hg (average post-laser IOP 13 mm Hg - IOP not recorded on the day of sacrifice). In EEG monkey 2, detected IOP elevation occurred approximately 3 weeks before death, with the IOP maximum of 37 mm Hg recorded on the day of death (average post-laser IOP of 19 mm Hg). No IOP elevation was detected in EEG monkey 3 (average post-laser IOP 13 mm Hg, 18 mm Hg on the day of sacrifice). Axon counts for each EEG eye range from 16 to 30% as previously reported13.
Monkey Euthanasia and Perfusion Fixation at Prescribed IOP
Both eyes of each monkey were cannulated with a 27-gauge needle under deep pentobarbital anesthesia and the IOP was set to 10 mm Hg using an adjustable saline reservoir. After a minimum of 30 minutes, the monkey was perfusion fixed via the descending aorta with 1 L of 4% buffered hypertonic paraformaldehyde solution followed by 6 L of 5% buffered hypertonic glutaraldehyde solution.14 Following perfusion fixation, IOP was maintained for one hour, then each eye was enucleated, all extraorbital tissues were trimmed, and the anterior chamber was removed 2 to 3 mm posterior to the limbus. By gross inspection, perfusion was excellent for all 12 eyes. The posterior scleral shell with intact ONH, choroid and retina were placed in 5% glutaraldehyde solution for storage.
Generation of the Aligned Serial Section Images for Each ONH and 3-D ONH Reconstruction
These steps have been described in detail within our previous reports11, 14. For this study, all 12 eyes were reconstructed using an enhanced protocol to increase axial and transverse image resolution. Briefly, the ONH and peripapillary sclera were trephinated (6 mm diameter), embedded in paraffin, and mounted to a microtome with the ONH facing out. The fresh block surface was stained with a 1:1 (v/v) mixture of Ponceau S and acid fuchsin stains, imaged at a transverse resolution of 1.5 × 1.5 μm per pixel and serial-sectioned at 1.5 μm increments. Imaging of the stained embedded tissue block surface started at the vitreoretinal interface and ended 200 μm into the retrolaminar orbital optic nerve. The position of the tissue block and camera were recorded by laser displacement sensors (Keyence Corporation, Woodcliff Lake, NJ) at each serial section. All acquired images were then stacked and aligned using the laser position data into a digital 3-D reconstruction consisting of approximately 3400 (width) × 3200 (height) × 500 (depth) voxels (depth ranging from 342 to 665), each 1.5 × 1.5 × 1.5 μm in size.
3-D Delineation of ONH and Peripapillary Scleral Landmark Points
Our 3-D delineation technique has been described in detail in previous reports11-13. Briefly, using custom software based on the Visualization Toolkit (VTK, Clifton Park, NY), the 3-D ONH reconstruction was loaded and the delineator assigned the approximate center of the neural canal as the center of rotation, around which 40, 7-voxel-thick, digital, radial, sagittal slices of the digital 3-D reconstruction were serially served at 4.5° intervals to the delineator's workstation (Figure1A).
Figure 1. 3-D delineation within colorized, stacked-section, 3-D ONH reconstructions and parameters definitions.

(A) A total of 40 serial digital radial sagittal slices, each 7 voxels thick, are served to the delineator at 4.5° intervals. (B) A representative digital sagittal slice, showing the all 13 marks, which are 3-D-delineated using linked, simultaneous, colocalization of the sagittal slice (shown) and the transverse section image through the delineated point (C). (D) Representative 3-D point cloud showing all delineated points for a normal monkey ONH, relative to the posterior serial section image (vitreous top, orbital optic nerve bottom,). (E) BMO zero reference plane (red line) colocalized with neural canal landmarks BMO (red), the anterior scleral canal opening (ASCO, dark blue), the anterior laminar insertion (ALI, dark yellow, hidden behind the ASCO in dark blue), the posterior laminar insertion (PLI, green), the posterior scleral canal opening (PSCO, pink), the anterior-most aspect of the subarachnoid space (ASAS, light blue), the distance from the BMO centroid (offset) and distance from the BMO zero reference plane (depth) are noted for ASAS. (F) Laminar position (green arrow) is defined as the shortest distance from the delineated anterior laminar surface point (white dot) to the BMO zero reference plane. (G) Lamina cribrosa thickness at each delineated anterior surface point is determined by fitting a continuous surface (white line) to all anterior surface points and then measuring the distance along a normal vector of the anterior surface (green arrow) from each anterior delineated point to the posterior surface. (H) The thickness of the scleral flange at each delineated anterior surface point (white dots) is defined as the distance between the neural canal boundary points (green line), along a vector parallel to the PSCO normal vector (blue arrow). (I) Post-BMO total prelaminar volume (light green: a measure of the laminar or connective tissue component of cupping) is the volume beneath the BMO zero reference plane in cyan, above the lamina cribrosa and within the neural canal wall; (J) prelaminar tissue volume (purple) is the volume above the lamina, inside the neural canal and below the internal limiting membrane within the cylinder defined by the BMO projection; and (F) prelaminar tissue thickness (purple with black arrows) which is defined as the distance along a normal vector from each delineated anterior laminar surface point (white dots), to the internal limiting membrane surface (pink line). (J) post-BMO cup volume (pink: a measure of the clinical cup) is the volume (of the clinical cup) beneath BMO zero reference plane but above the ILM.
Within each digital sagittal section, the delineator marked seven landmark surfaces: lamina cribrosa; sclera; neural boundary; Bruch's membrane; internal limiting membrane; central retinal vessels; and subarachnoid space, and six pairs of neural canal landmark points: Bruch's membrane opening (BMO); the anterior scleral canal opening (ASCO); the anterior laminar insertion (ALI); the posterior laminar insertion (PLI); the posterior scleral canal opening (PSCO); and the anterior-most aspect of the subarachnoid space (ASAS) (Figure 1B).
While marking in the sagittal section view window, the delineator simultaneously viewed a slaved window showing the cursor's 3-D location within a digital transverse section image (Figure 1C). The 3-D Cartesian coordinates and category number for each mark were saved, generating a 3-D point cloud that represented each of the marked structures (Figure 1D).
Clinical Alignment of the 3-D Reconstruction
For each ONH, a high-resolution reconstruction of the central retinal vessels was performed and 3-dimensionally overlaid onto a pre-sacrifice clinical photo using the best match of the ONH and retinal vessels. Once preliminarily aligned (using the vessels only) the vessels and BMO points were co-visualized to assess the relationship of the clinically visible optic disc margin to the delineated BMO points. A final 3-D adjustment was then performed to best match BMO to the disc margin while maintaining best vessel alignment.
BMO Zero Reference Plane
For each 3-D ONH reconstruction, a least-squares ellipse was fit to the 80 marks defining BMO, creating a BMO zero reference plane11. The centroid of the BMO ellipse established the center point for all measurements. All quantification of neural canal offset, depth, anterior laminar/scleral position, post-BMO cup volume and post-BMO total prelaminar volume were made relative to this plane.
Parameterization
The definitions and calculation methods of these parameters have been described in detail in our previous reports11-13. In this report we have includes overall and regional quantification of neural canal offset and depth (Figure 1E), lamina cribrosa position (Figure 1 F) and thickness (Figure 1 G), scleral flange thickness (Figure 1 H), peripapillary scleral position and thickness, prelaminar tissue thickness (Figure 1K) and volume (Figure 1 J), post-BMO cup volume (Figure 1L), and post-BMO total prelaminar volume (Figure 1I)., Scleral position and thickness were calculated in a similar way as lamina cribrosa position and thickness.
Parameter Regionalization and Difference Map Generation
Neural canal landmark offset and depth data were pooled for the eight clinical regions demonstrated in Figure 2A and Figure 2B respectively. The S, N, I, and T regions contain all marks within 60° of the ONH centered about the S-I and N-T clinical axes, and the SN, IN, IT, and ST regions contain all marks in 30° radial sections of the ONH centered about the SN-IT and IN-ST axes as shown in Figure 2.
Figure 2. Parameter Regionalization.

Neural canal offset (A) and depth data (B) for each neural canal landmark were pooled for eight anatomic regions, superior (S), superonasal (SN), nasal (N), inferonasal (IN), inferior (I), inferotemporal (IT), temporal (T), and superotemporal (ST). The S, N, I, and T regions contained all marks within 60° sections of the ONH centered about the S-I and N-T clinical axes, and the SN, IN, IT, and ST regions contained all marks in 30° radial sections of the ONH centered about the SN-IT and IN-ST axes. Concentric rings represent the different neural canal landmarks from its internal entrance BMO to its external exit PSCO as shown in the superior region of (A) and (B). Neural canal Depth measurements start with the ASCO rather than BMO.(C) Using the center of BMO,12 radial sections perpendicular to BMO zero reference plane divided the volumetric parameters into 24, 15 radial regions. Then regional volumes were projected onto BMO zero reference plane, color coded by region and overlaid onto a standard ellipse. (D) Within the lamina, position and thickness, prelaminar tissue thickness data were pooled into 17 regions according to the three radial regions (central; MP, middle periphery; P, periphery) and eight quadrants same as in (A) and (B). (E) Peripapillary sclera position data were pooled into 16 regions according to two radial regions (MP, middle periphery, inner boundary starting from ASCO ellipse (dark black line) to an ellipse whose size is 1.62 times of the ASCO ellipse size; P, periphery, inner boundary starting from the outer boundary of the MP regions to an ellipse whose size is 2.34 times of the ASCO ellipse size). (F) Peripapillary scleral thickness data were pooled into 24 regions according to three radial regions (F, flange thickness, covered area from ASCO to PSCO; MP, middle periphery region, inner boundary starting from PSCO to an ellipse whose size is 1.62 times of the ASCO ellipse size; P, periphery regions are the same as peripapillary scleral position periphery regions).
Lamina cribrosa position and thickness, prelaminar tissue thickness data were assigned to 17 sub-regions as shown in Figure 2D. Scleral position data were pooled into 16 sub-regions as shown in figure 2E. Scleral thickness data were pooled into the same 24 sub-regions, but also include flange thickness (the innermost 8 sub-regions) as shown in Figure 2F.
Post-BMO cup volume, post-BMO total prelaminar volume and prelaminar tissue volume were divided into 24, 15 degree, radial regions using the BMO centroid as the center and BMO normal sections as cutting planes as shown in Figure 2C.
PID (PIPD) range and maximum for the Six Normal Monkeys
For each eye, overall and regional values for each parameter were calculated. For each animal, Physiologic Inter-eye Difference (PID) was calculated for each parameter (both overall and regionally) by converting all OS data to OD configuration, subtracting the OS from the OD parameter value and taking the absolute value. Physiologic Inter-eye Percent Difference (PIPD) was calculated for each parameter as the PID divided by the absolute mean of the measurement values of the two eyes. For all six animals, the measurement mean (both overall and regionally) for each parameter was calculated as the mean value of the six right eyes of each animal. The PID range was the range of PID values among the 6 animals and the PID Maximum was the largest PID (the upper range) among the six animals. The PIPD range was the range of PIPD values among the 6 animals and the PIPD Maximum was the largest PIPD (the upper range) among the six animals.
EEG animal Inter-eye differences and comparison to the PID and PIPD Maximum
EEG minus normal eye differences and percent differences (the inter-eye difference divided by the normal eye value) for each parameter overall and regionally were calculated for each previously-reported EEG monkey and compared to the PID/PIPD Maximums established by the 6 Normal animals. Parameter change for each EEG animal required the inter-eye difference and percent difference (overall or regionally) to exceed the PID and PIPD Maximum for that parameter.
Results
Descriptive Data for the six normal rhesus monkeys and the histomorphometric optic disc size for each eye are reported in Table 1. Descriptive data for the three previously-reported cynomolgus EEG monkeys is contained within our previous reports14.
Table 1. Animal and Eye Data.
| Histomorphometric Optic Disc Size | |||||||||||||
|---|---|---|---|---|---|---|---|---|---|---|---|---|---|
| Monkey | Optic Disc Dimension (μm)2 | Optic Disc Area (mm2) | |||||||||||
| # | ID | Weight (kg) | Age (y) | Sex | Eye | IOP1 (mm Hg) | Number of serial Section Images | Vertical3 | Vertical PID4 (PIPD %5) | Horizontal6 | Horizontal PID (PIPD %) | Area7 | Area PID (PIPD%) |
| 1 | 99R1753 | 3 | 4 | Male | Right | 11 | 342 | 1636 | 26 (1.6) | 1193 | 14 (1.2) | 1.532 | 0.007 (0.4) |
| Left | 11 | 434 | 1662 | 1179 | 1.539 | ||||||||
| 2 | 97R0793 | 5 | 6 | Male | Right | 14 | 491 | 1444 | 3 (0.2) | 1060 | 17 (1.7) | 1.201 | 0.023 (1.9) |
| Left | 14 | 456 | 1447 | 1077 | 1.224 | ||||||||
| 3 | 23540 | 5.3 | 9 | Female | Right | 13 | 524 | 1520 | 10 (0.7) | 1072 | 16 (1.4) | 1.280 | 0.027 (2.1) |
| Left | 10 | 665 | 1530 | 1088 | 1.307 | ||||||||
| 4 | 23533 | 3.68 | 8 | Female | Right | 8 | 607 | 1355 | 18 (1.3) | 984 | 25 (2.6) | 1.048 | 0.014 (1.3) |
| Left | 8 | 528 | 1373 | 959 | 1.034 | ||||||||
| 5 | 23510 | 4.86 | 10 | Female | Right | 12 | 561 | 1439 | 40 (2.8) | 1044 | 18 (1.7) | 1.180 | 0.012 (1.0) |
| Left | 11 | 558 | 1479 | 1026 | 1.192 | ||||||||
| 6 | 25341 | 5.4 | 2 | Male | Right | 13 | 484 | 1420 | 14 (1.0) | 1076 | 21 (1.9) | 1.199 | 0.036 (3.0) |
| Left | 12 | 478 | 1434 | 1097 | 1.235 | ||||||||
Mean IOP of all N = 3 to 5 baseline measurements under ketamine/xylazine anesthesia
Optic disc dimension as determined by the clinical visible optic disc margin which is Bruch's Membrane Opening in these monkey eyes-see Appendix figures 2 and 3
Vertical length as determined by the major length of the BMO ellipse
Physiologic inter-eye difference (PID) is the absolute difference between right eye measure and left eye measure
Physiologic inter-eye percent difference (PIPD) is the PID divided by the mean measurement magnitude of the two eyes
Horizontal length as determined by the minor length of the BMO ellipse
Disc Area is determined by the area of the BMO ellipse
Optic Disc Size
Bruch's membrane opening (BMO) vertical length ranged from 1355 μm to 1662 μm and horizontal length ranged from 959 μm to 1193 μm. The PID Maximum for BMO vertical length was 40 μm and the PID Maximum for BMO horizontal length was 25 μm. Disc area ranged from 1.034 mm2 to 1.539 mm2 while its PID Maximum was 0.036 mm2.
Qualitative Inspection of Quantitative 3-D Neural Canal Size and Shape Data by Monkey
The size and shape of the clinical disc as defined by BMO and the neural canal landmark points of both eyes of each monkey were overlaid and presented in right eye configuration in online Appendix Figure 1. For all 6 animals, the two eyes demonstrated remarkably similar neural canal size, shape, enlargement (the degree to which the PSCO is bigger than the BMO) and obliqueness (the degree to which the PSCO is off-center relative to BMO). However, there were clear differences in the size and shape of the anterior-most aspect of the subarachnoid space in 3 of the monkeys especially within the inferior and inferior-nasal regions.
Qualitatively, BMO within the two eyes of each monkey was almost identical (online Appendix Figure 1) and in each eye BMO closely co-localized to the clinically visible optic disc margin when the retinal and ONH vessels were used to maximize the co-localization (online Appendix Figures 2 and 3)
Overall Measurement Mean and Range of Each Parameter
The measurement mean and range (for n=6 right eyes of n=6 animals) for each parameter are listed in Table 2 left hand portion.
Table 2. Overall Measurements Means, PIDs and PIPDs for all Parameters within Six Bilaterally Normal Rhesus Monkeys.
| Optic Disk Size | Measurement Mean 1 | Measurement Range | PID2 Range | PIPD3 Range (%) |
|---|---|---|---|---|
| Vertical Length (μm) | 1469 | 1355 – 1636 | 3 – 40 | 0.2 – 2.8 |
| Horizontal Length (μm) | 1071 | 984 – 1193 | 14 – 25 | 1.2 – 2.6 |
| Disk Area (mm2) | 1.240 | 1.048 – 1.532 | 0.007 – 0.036 | 0.4 – 3.0 |
| Neural Canal Architecture | ||||
| BMO Offset (μm) | 623 | 573 – 694 | 1 – 9 | 0.1 – 1.5 |
| ASCO Offset (μm) | 716 | 652 – 778 | 5 – 16 | 0.7 – 2.1 |
| ALI Offset (μm) | 720 | 650 – 784 | 5 – 16 | 0.7 – 2.2 |
| PLI Offset (μm) | 808 | 753 – 848 | 2 – 18 | 0.3 – 2.1 |
| PSCO Offset (μm) | 840 | 789 – 893 | 1 – 22 | 0.1 – 2.7 |
| ASAS Offset (μm) | 936 | 892 – 992 | 2 – 18 | 0.2 – 2.1 |
| ASCO Depth (μm) | 31 | 19 – 49 | 1 – 15 | 2.8 – 100.9 |
| ALI Depth (μm) | 36 | 21 – 50 | 1 – 20 | 2.8 – 89.6 |
| PLI Depth (μm) | 121 | 90 – 181 | 4 – 20 | 3.3 – 16.8 |
| PSCO Depth (μm) | 143 | 93 – 196 | 4 – 27 | 3.1 – 17.1 |
| ASAS Depth (μm) | 162 | 97 – 234 | 1 – 25 | 0.5 – 19.4 |
| ONH Connective Tissue | ||||
| Lamina Cribrosa Position (μm) | -84 | -103 – -68 | 6 – 16 | 6.1 – 21.1 |
| Peripapillary Scleral Position4 (μm) | -11 | -39 – 32 | 0 – 21 | 0 – 400 |
| Lamina Cribrosa Thickness (μm) | 104 | 81 – 136 | 1 – 16 | 0.7 – 18 |
| Peripapillary Scleral Thickness4 (μm) | 160 | 137 – 195 | 0 – 11 | 0 – 7.1 |
| Sclera Flange Thickness (μm) | 66 | 54 – 101 | 3 – 5 | 4.6 – 8.8 |
| Mid-Peripapillary Scleral Position5 (μm) | -16 | -38 – 14 | 2 – 18 | 5.4 – 180 |
| Mid-Peripapillary Scleral Thickness5 (μm) | 147 | 121 – 179 | 1 – 14 | 0.8 – 9.2 |
| ONH Prelaminar Neural Tissue and Cupping | ||||
| Prelaminar Tissue Thickenss4 (μm) | 160 | 95 – 193 | 1 – 15 | 0.5 – 8.9 |
| Post-BMO Cup Volume6 (mm3) | 0.0081 | 0.0030 – 0.0159 | 0.0018 – 0.0056 | 13.1 – 174.4 |
| Post-BMO Total Prelaminar Volume (mm3) | 0.1358 | 0.1084 – 0.1870 | 0.0052 – 0.0440 | 3.7 – 28.4 |
| Prelaminar Tissue Volume4 (mm3) | 0.2255 | 0.1682 – 0.2543 | 0.0098 – 0.0334 | 3.8 – 18.1 |
Measurement Mean is the mean value of the six right eyes
Physiologic inter-eye difference (PID) is the absolute difference between right eye measure and left eye measure
Physiologic inter-eye percent difference (PIPD) is the PID divided by the mean measurement magnitude of the two eyes
Data for only five animal (animal 2 - animal 6) are available for this measurement
Overall measurements for the middle periphery region only (this is the same region as our previous three EEG monkeys11-13)
Data for only four animals ( animal 2, 3, 5. 6 ) are available for this measurement
Overall PID and PIPD Maximum for Each Parameter
For all six animals considered together, the PID and PIPD Maximum for each parameter are listed in the right hand portion of Table 2. The PID Maximum for neural canal offset and depth parameters were as little as 9 μm for BMO offset to 27 um for PSCO depth. The PID Maximum for prelaminar, laminar and scleral position and thickness data were also small varying from 5 um for scleral flange thickness to 21 um for peripapillary scleral position. The PID Maximum for all volumetric parameters varied from 0.0056 mm3 for post-BMO cup volume to 0.0440 mm3 for post-BMO total prelaminar volume.
Regional Measurement Means
The measurement mean (for n=6 right eyes of n=6 animals) and the PID and PIPD Maximum (for n=6 animals) are reported for all regional parameters in Figures 3 - 9.
Figure 3. Regional Neural Canal Landmark Offset and Depth Measurement Means, PID Maximums and PIPD (%) Maximums.

Concentric rings represent the different neural canal landmarks from its internal entrance (BMO) to its external exit (PSCO) as depicted in Figure 2 (BMO, ASCO, ALI, PLI, PSCO, ASAS, respectively). Depth measurements start with the ASCO rather than BMO, because the BMO points form the BMO zero reference plane for these measurements. Within each region, measurement mean is the mean of the n=6 right eye measurements for each animal and is grey scale mapped in micrometers. Physiologic inter-eye difference (PID) maximum is the upper range of the PID within each region for the n=6 PID values (from the n=6 animals) and is grey scale mapped in micrometers. Physiologic inter-eye percent difference (PIPD) maximum is the upper range of the PIPD within each region (expressed as percent (%)) for the n=6 PID values (from the n=6 animals) and is nested next to the PIPD value inside the bracket. All data are plotted in right eye configuration. S, superior; SN, superonasal; N, nasal; IN, inferonasal; I, inferior; IT, inferotemporal; T, temporal; ST, superotemporal. See Figure 2 for a detailed description of regionalization.
Figure 9. Regional Post-BMO Cup Volume (in cubic millimeters) Measurement Means, PID Maximums and PIPD (%) Maximums.

Post-BMO Cup Volume (Figure 1L) is a measure of the clinical cup defined as the volume of space beneath the BMO zero reference plane but above the internal limiting membrane (ILM). Within each region, measurement mean is the mean of the n=6 right eyes of each animal and is grey scale mapped in cubic micrometers on the left. Physiologic inter-eye difference (PID) Maximum is the upper range of the PID within each region for the n=6 PID values (from the n=6 animals) and is grey scale mapped in cubic micrometers in the middle. Physiologic inter-eye percent difference (PIPD) Maximum is the upper range of the PIPD within each region (expressed as percent (%)) for the n=6 PIPD values (from the n=6 animals) and is grey scale mapped on the right. The 15° radial region maps (Figure 2) are presented in right eye configuration. S, superior; N, nasal; I, inferior; T, temporal.
Regional Neural Canal Landmark Offset and Depth Measurement Means and PID Maximum (Figure 3)
The regional PID Maximum for neural canal landmark offset varied from 12 μm within the inferior regions of BMO to 109 μm within the inferonasal region of the ASAS. The regional PID Maximum for neural canal landmark depth varied from 7 μm within the superior region of BMO to 65 μm within the nasal region of the ASAS. Neural Canal landmark offset and depth PID Maximums were least within the inner canal landmarks (BMO and ASCO) and greatest within the outer canal landmarks (the PSCO and ASAS).
Regional Lamina Cribrosa Position and Thickness Measurement Means and PID Maximums (Figure 4)
Figure 4. Regional Lamina Cribrosa Position and Thickness Measurement Means, PID Maximums and PIPD (%) Maximums.
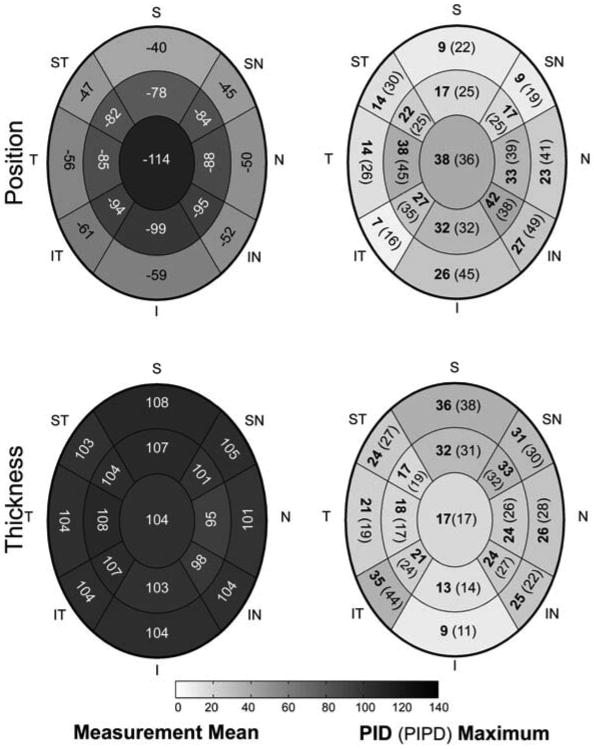
Measurement Means are the mean of the n=6 right eyes of each animal and are negative for laminar position (upper left) because the position of lamina cribrosa surface is below the BMO zero reference plane. Within each region, measurement mean is the mean of the n=6 right eye measurements for each animal and is grey scale mapped in micrometers. Physiologic inter-eye difference (PID) Maximum is the upper range of the PID within each region for the n=6 PID values (from the n=6 animals) and is grey scale mapped in micrometers. Physiologic inter-eye percent difference (PIPD) Maximum is the upper range of the PIPD within each region (expressed as percent (%)) for the n=6 PIPD values (from the n=6 animals) and is nested next to the PID value inside the bracket. Laminar position and thickness data are pooled into 17 concentric regions as described in Figure 2. All data are plotted in right eye configuration. S, superior; SN, superonasal; N, nasal; IN, inferonasal; I, inferior; IT, inferotemporal; T, temporal; ST, superotemporal.
The PID Maximum varied from 7 μm to 42 μm for laminar position and 9 μm to 36 μm for laminar thickness. In general, regional PID Maximums for laminar position were greatest centrally and inferior-nasally, while laminar thickness PID Maximums were greatest within the peripheral regions.
Regional Post-BMO Total Prelaminar Volume Measurement Means and PID Maximums (Figure 5)
Figure 5. Regional Post-BMO Total Prelaminar Volume (in cubic millimeters) Measurement Means, PID Maximums and PIPD (%) Maximums.

Post–BMO Total Prelaminar volume (Figure 1I) is a volumetric parameter that attempts to capture both the posterior deformation of the lamina and the expansion of the neural canal that are central to a “glaucomatous” or “laminar” form of cupping (see Figure 1 for an explanation of these relationships). It incorporates features of (and is related to) the laminar position and neural canal offset parameters outlined in Figures 3 and 4, above. Within each region, measurement mean is the mean of the n=6 right eyes of each animal and is grey scale mapped in cubic micrometers on the left. Physiologic inter-eye difference (PID) Maximum is the upper range of the PID within each region for the n=6 PID values (from the n=6 animals) and is grey scale mapped in cubic micrometers. Physiologic inter-eye percent difference (PIPD) Maximum is the upper range of the PIPD within each region (expressed as percent (%) ) for the n=6 PIPD values (from the n=6 animals) and is grey scale mapped on the right. The 15° radial region maps (Figure 2) are presented in right eye configuration. S, superior; N, nasal; I, inferior; T, temporal.
The regional PID Maximums for Post-BMO total prelaminar volume (a volumetric parameter that incorporates features of (and is related to) the laminar position and neural canal offset parameters outlined above) varied from 0.0012 mm3 to 0.0038 mm3 and was greatest superiorly and inferior-nasally.
Regional Peripapillary Scleral Position and Thickness Measurement Means and PID Maximums (Figure 6)
Figure 6. Regional Peripapillary Scleral Position and Thickness Measurement Means, PID Maximums and PIPD (%) Maximums.

Measurement Means are the mean of the n=6 right eyes of each animal and are negative or positive for peripapillary scleral position (upper left) because its position is above or below the BMO zero reference plane depending upon the region. Within each region, measurement mean is the mean of the n=6 right eye measurements for each animal and is grey scale mapped in micrometers. Physiologic inter-eye difference (PID) Maximum is the upper range of the PID within each region for the n=6 PID values (from the n=6 animals) and is grey scale mapped in micrometers. Physiologic inter-eye percent difference (PIPD) Maximum is the upper range of the PIPD within each region (expressed as percent (%)) for the n=6 PIPD values (from the n=6 animals) and is nested next to the PID value inside the bracket. Peripapillary scleral position data are pooled into 16 concentric regions and scleral flange and peripapillary thickness data are pooled into 24 concentric regions as described in Figure 2. All data are plotted in right eye configuration. S, superior; SN, superonasal; N, nasal; IN, inferonasal; I, inferior; IT, inferotemporal; T, temporal; ST, superotemporal.
The regional PID Maximums for peripapillary scleral position varied from 17 to 64 μm and was greatest peripherally, superiorly, inferiorly and nasally. The PID Maximum for scleral flange and peripapillary scleral thickness varied from 16 to 57 μm, and was greatest peripherally, inferior nasally.
Regional Prelaminar Tissue Thickness and Volume Measurement Means and PID Maximums (Figure 7 and Figure 8)
Figure 7. Regional Prelaminar Tissue Thickness Measurement Means, PID Maximums and PIPD (%) Maximums.

Within each region, measurement mean is the mean of the n=6 right eye measurements for each animal and is grey scale mapped in micrometers. Physiologic inter-eye difference (PID) Maximum is the upper range of the PID within each region for the n=6 PID values (from the n=6 animals) and is grey scale mapped in micrometers. Physiologic inter-eye percent difference (PIPD) Maximum is the upper range of the PIPD within each region (expressed as percent (%) ) for the n=6 PIPD values (from the n=6 animals) and is nested next to the PID value inside the bracket. All data are plotted in right eye configuration. S, superior; SN, superonasal; N, nasal; IN, inferonasal; I, inferior; IT, inferotemporal; T, temporal; ST, superotemporal.
Figure 8. Regional Prelaminar Tissue Volume (in cubic millimeters) Measurement Means, PID Maximums and PIPD (%) Maximums.

Within each region, measurement mean is the mean of the n=6 right eyes of each animal and is grey scale mapped in cubic micrometers on the left. Physiologic inter-eye difference (PID) Maximum is the upper range of the PID within each region for the n=6 PID values (from the n=6 animals) and is grey scale mapped in cubic micrometers in the middle. Physiologic inter-eye percent difference (PIPD) Maximum is the upper range of the PIPD within each region (expressed as percent (%)) for the n=6 PIPD values (from the n=6 animals) and is grey scale mapped on the right. The 15° radial region maps (Figure 2) are presented in right eye configuration. S, superior; N, nasal; I, inferior; T, temporal.
The regional PID Maximums for prelaminar tissue thickness varied from 23 μm to 62 μm, and were greatest inferiorly and superior-temporally. The PID Maximums for prelaminar tissue volume varied from 0.0011 mm3 to 0.0050 mm3 and were greatest superiorly-nasally and inferiorly.
Regional Post-BMO Cup Volume Measurement Means and PID Maximums (Figure 9)
Regional PID Maximums for post-BMO cup volume varied from 0.0001 mm3 to 0.0013 mm3 and were greatest superior-nasally and nasally.
Comparison of Overall PID and PIPD Maximums to Overall Inter-eye Differences within the 3 Previously-reported EEG Animals
Data to make these comparisons are reported in Table 3. While overall laminar thickness differences exceeded the PID Maximum in all three EEG monkeys, their percent differences exceeded PIPD Maximum in only Monkeys 1 and 3 (equaling but not exceeding the PIPD Maximum in Monkey 2). EEG to normal eye differences exceeded the overall PID and PIPD Maximums in all three EEG monkeys for parameters related to laminar deformation, posterior scleral canal enlargement, cupping, and prelaminar neural tissue thickening, only.
Table 3. Normal Eye Range and Treatment Eye Differences for Three Previously Reported Cynomolgus EEG monkeys11-13 Compared the PID (PIPD) Maximum.
| Optic Disk Size | Normal Eye Range of EEG Monkeys | EEG Monkey 1 ΔEEG (ΔEEG/N%)1 |
EEG Monkey 2 ΔEEG (ΔEEG/N%) |
EEG Monkey 3 ΔEEG (ΔEEG/N%) |
PID (PlPD%) Maximum2 |
|---|---|---|---|---|---|
| Vertical Length3 (μm) | 1337 – 1459 | 108 (8.1) | 1 (0.1) | 3 (0.2) | 40 (2.8) |
| Horizontal Length3 (μm) | 1017 – 1055 | 47 (4.6) | 2 (0.2) | 68 (6.5) | 25 (2.6) |
| Disk Area3 (mm2) | 1.068 – 1.209 | 0.140 (13.1) | 0.001 (0.1) | 0.081 (6.7) | 0.036 (3) |
| Neural Canal Architecture | |||||
| BMO Offset (μm) | 579 – 615 | 39* (6.7) | 2 (0.3) | 21 (3.4) | 9 (1.5) |
| ASCO Offset (μm) | 648 – 724 | 71* (9.8) | 11 (1.7) | 1 (0.1) | 16 (2.1) |
| ALI Offset (μm) | 649 – 736 | 70* (9.6) | 11 (1.7) | 4 (0.5) | 16 (2.2) |
| PLI Offset (μm) | 721 – 904 | 99* (11.0) | 39* (5.4) | 54* (6.5) | 18 (2.1) |
| PSCO Offset (μm) | 743 – 940 | 85* (9.0) | 19* (2.6) | 30* (3.5) | 22 (2.7) |
| ASAS Offset (μm) | 831 – 1038 | 98* (9.4) | 39* (4.7) | 74* (7.5) | 18 (2.1) |
| ASCO Depth (μm) | 22 – 53 | 7 (31.8) | 4 (13.8) | 2 (3.8) | 15 (100.9) |
| ALI Depth (μm) | 22 – 64 | 7 (31.8) | 18* (47.4) | 14* (21.9) | 20 (89.6) |
| PLI Depth (μm) | 86 – 166 | -5 (5.8) | 39* (23.5) | 14* (9.7) | 20 (16.8) |
| PSCO Depth (μm) | 104 – 181 | -9 (8.7) | 25* (13.8) | 7 (4.6) | 27 (17.1) |
| ASAS Depth (μm) | 125 – 185 | -25* (20.0) | 9 (4.9) | -36* (24.7) | 25 (19.4) |
| ONH Connective Tissue | |||||
| Lamina Cribrosa Position (μm) | -111 – -105 | -118* (115.7) | -97* (87.4) | -79* (75.2) | 16 (21.1) |
| Lamina Cribrosa Thickness (μm) | 83 – 128 | 61* (59.2) | 23* (18.0) | 26* (31.3) | 16 (18.0) |
| Sclera Flange Thickness (μm) | 60 – 76 | 7 (10.1) | 1 (1.3) | 8 (13.3) | 5 (8.8) |
| Mid-Peripapillary Sclera Position (μm) | -14 – 45 | 21* (46.7) | 3 (21.4) | 35* (94.6) | 18 (180) |
| Mid-Peripapillary Sclera Thickness (μm) | 113 – 136 | -4 (2.94) | -32* (25.4) | 1 (0.9) | 14 (9.2) |
| ONH Prelaminar Neural Tissue and Cupping | |||||
| Prelaminar Tissue Thickness (μm) | 95 – 110 | 82* (74.5) | 47* (47) | 58* (61.1) | 15 (8.9) |
| Post-BMO Cup Volume3 (mm3) | 0.010 – 0.054 | 0.127 (235.2) | 0.058 (446.2) | 0.090 (900) | 0.0056 (174.4) |
| Post-BMO Total Prelaminar Volume3 (mm3) | 0.159 – 0.231 | 0.308 (133.3) | 0.122 (76.7) | 0.191 (119.4) | 0.0440 (28.4) |
| Prelaminar Tissue Volume3 (mm3) | 0.232 – 0.289 | 0.167 (62.3) | 0.025 (10.8) | 0.002 (0.692) | 0.0334 (18.1) |
The treatment difference (ΔEEG) using overall EEG eye data minus normal eye data for three EEG monkeys and also expressed as percent treatment difference (difference magnitude divided by the normal eye measurement magnitude). Neural canal architures, ONH connective tissue and prelaminar neural tissue and cupping parameters data od the 3 EEG monkeys were adapted from previous reports11-13
PID/PIPD maximum is the upper limit of the PID/PIPD range reported in table 2 for each parameter
ANOVA (analysis of variance) were not applicable to these measurements in the 3 EEG monkeys
EEG eye value was significant different (P< 0.05 ANOVA) from the contralateral normal eye
 Dark grey signifies both treatment difference magnitude and percent treatment difference exceeded the PID/PIPD maximums in the region
 Light grey signifies only treatment difference magnitude exceeded the PID/PIPD maximum in the region
Comparison of Regional PID and PIPD Maximums to Regional Inter-eye Differences within the 3 Previously-reported EEG Animals
Data to make these comparisons are reported in Figure 10. Compared to the regional PID Maximums, while regional inter-eye differences within each of the 3 EEG monkeys was substantial for parameters related to laminar thickening, and posterior scleral canal enlargement when considered individually (data not shown)11-13, only inferior, inferonasal, and superior inter-eye differences for laminar deformation, cupping, and prelaminar tissue thickening and central laminar deformation and thickening were present in all three 3 EEG monkeys considered together.
Figure 10. Regional Inter-eye differences within 3 Previously-reported Early Experimental Glaucoma (EEG) Monkeys that exceeded the PID Maximum and PIPD Maximum in 6 Bilateral Normal Monkeys.

For each EEG animal, inter-eye (EEG minus Normal) difference and percent difference (inter-eye difference divided by the normal eye measurement value) for each parameter was calculated within the above regions and compared to the regional PID and PIPD Maximum reported in Figures 3-9, above. Dark grey regions are those in which the regional inter-eye differences (magnitude) in all three EEG monkeys exceeded the regional PID and PIPD Maximum.
Discussion
The purpose of the current study was to characterize PIDs in ONH neural and connective tissue architecture within 6 normal monkeys and compare them to inter-eye differences within three previously-reported monkeys with early experimental glaucoma in one eye11-13. The principal findings of this report are as follows. First, for all parameters considered overall, the PID Maximums within these six normal animals were relatively small. EEG to normal eye differences in all three previously-reported EEG monkeys consistently and substantially exceeded these overall PID and PIPD Maximums for parameters related to laminar deformation, posterior scleral canal enlargement, cupping and prelaminar neural tissue thickening. Second, regional PID and PIPD Maximums were greater than the overall PID and PIPD Maximums for most parameters. Only parameters related to laminar deformation and thickening within the central region and laminar deformation and prelaminar neural tissue thickening within the inferior, inferonasal, and superior regions exceeded these Maximums in all three EEG animals.
That our overall PID and PIPD Maximum data focuses attention on the parameters related to laminar deformation, posterior scleral canal enlargement, cupping and prelaminar neural tissue thickening in EEG is important for two reasons. First, it establishes that at least for these 3 EEG monkeys relative to these 6 bilateral normal monkeys, the model and our methods are sensitive enough to detect similar forms of early damage within all 3 EEG eyes. Second, it suggests that these processes may not just be the most detectable in our model/method system, but rather that they may be the most consistent early processes in experimental glaucomatous damage to the monkey ONH that occurs at moderate levels of IOP elevation.
Our regional PID Maximums create a more conservative benchmark for the detection of early glaucomatous damage and further clarify that in these three EEG animals the earliest changes are laminar deformation and thickening within the central region and laminar deformation and prelaminar neural tissue thickening within the inferior, inferior-nasal and superior regions. While the human and monkey optic nerve heads may fundamentally differ in their clinical behaviors, we propose that these changes, (now clarified by region and character), suggest important new imaging targets for human patients with moderate levels of ocular hypertension. A study assessing these findings in a larger group of EEG monkeys is nearing completion and will be the subject of a future report.
Apart from our principal findings, several additional points bear discussing. First, while we report both the PID and PIPD Maximums for each overall and regional parameter, we emphasize the PID Maximum without extensively discussing it as a percent difference (PIPD). We believe that the PID value alone is most relevant to the monkey experimental glaucoma model for cross-sectional detection of change within one eye compared to its contralateral normal control. While PID estimates contain the variability inherent to our method, PID data is not variability data and at 1.5 micrometer voxel resolution, the accuracy of our method is adequate to detect these differences between the eyes of bilaterally normal and early glaucomatous monkeys. As such, we propose that requiring that the inter-eye difference in a given parameter exceed the upper range of its PID value is a valid benchmark for change detection within the early glaucoma eye of an animal whether it is 0.1% or 50% of the measurement value in the contralateral normal eye.
However, we have included PIPD data (and used it as a criteria for change that is likely to be important) because in so doing the data we report may be more applicable to similar measurements made with a clinical instrument in which the exact scale of the measurement can not be certain. In the case of laminar position as measured by clinical Spectral Domain Optical Coherence Tomography (SD-OCT) in both eyes of an animal, the PIPD Maximum for overall or regional laminar position conservatively estimates the percent difference (between the treated and contralateral normal eye of a study animal) required to exceed the highest percent difference that occurred among these 6 pairs of bilaterally normal eyes.
While we report measurement means and their range for each parameter, we do not extensively discuss their significance as these data will soon be supplemented by the report of measurement means, 95% CI, and upper and lower range for each parameter within 41 normal eyes of 41 monkeys, ranging from 2 to 31 years of age, all perfusion fixed at IOP 10 mm Hg. These data will form the most comprehensive characterization of normal monkey ONH neural and connective tissue architecture to date and provide the source dimensions for parameterized finite element models which will characterize the most important determinants of IOP-related stress and strain at all levels of IOP16-20.
Our report should be considered within the context of the following limitations. First, the true range of physiologic inter-eye variation would be best characterized within hundreds of pairs of normal eyes and include groups designed to assess the effects of species, age and asymmetries in ocular dimensions and refractive errors. While we did not pre-select these animals, that we happened to study six rhesus monkeys in which the two eyes of each animal were very similar, does not mean that more marked inter-eye differences are not present in some or even the majority of normal rhesus monkeys. We therefore view our report as preliminary, and hope to gradually add to these data through additional post-mortem 3D histomorphometric reconstruction of dedicated bilaterally normal animals as well as clinical SD-OCT ONH reconstructions21 of bilaterally normal monkeys prior to the their inclusion into our longitudinal studies of experimental glaucoma.
Due to circumstances beyond our control, we were forced to establish PID and PIPD Maximums in rhesus monkeys which may not directly apply to the three cynomolgus EEG monkeys of our previous reports.11-13 While there may be differences in measurement means between the species, we believe that important species differences in PID and PIPD Maximum are unlikely. By gross comparison, the right eye measurement ranges of all parameters for the six rhesus monkeys (Table 2) are very similar to the normal eye ranges of the three cynomolgus EEG monkeys (Table 3). However, without having studied a large population of animals, the species difference between our normal and EEG groups add to the preliminary nature of our findings.
The measurement means and PID values reported herein are not the actual physiologic dimensions of the living monkey prior to sacrifice due to uncharacterized tissue shrinkage effects (from both fixation and embedding) associated with our 3-D histomorphometric technique. However, since both eyes of each animal were treated identically (i.e. at the same time and within the same dehydration solutions), comparisons between the two eyes of each monkey should still be valid. It is within this context that the PIPD Maximum we report may have the greatest relevance to any future study in which a consistent but uncertain shrinkage or measurement artifact is present.
It is possible that the acute IOP lowering to 10 mm Hg thirty minutes before perfusion fixation induced the prelaminar tissue thickening seen in all three EEG eyes. However, we think this is unlikely for the following reasons. First, IOP was lowered to 10 mm Hg slowly, (over 1–2 minutes) and second in those eyes in which it was measured, IOP was not that high on the day of sacrifice. IOP on the day of sacrifice was 37 mm Hg in the EEG eye of monkey 2, 18 mm Hg in the EEG eye of monkey 3, and not measured in the EEG eye of monkey 1 (but the maximum IOP ever detected for that monkey was 26 mm Hg and IOP was 22 mm Hg four days before sacrifice). Although it is possible that the change from 37 to 10 mm Hg caused the prelaminar thickening in EEG monkey 2, we doubt that the IOP change in EEG monkeys 1 and 3 accounts for this finding. It should also be noted that when we discussed these same data in our previous publication13 we erroneously reported which animal had no IOP data on the day of sacrifice (monkey 3 instead of monkey 1) and the highest IOP recorded (32 mmHg instead of 37 mm Hg). However, our interpretation of these data remains unchanged from that report13. We predict that longitudinal SD-OCT imaging of prelaminar tissue volume and thickness (once clinically available), will confirm this finding in hypertensive human and monkey eyes.
Finally, previous studies have demonstrated that intraocular pressures in ketamine anesthetized normal monkeys (mean ± SD, 14.9 ± 2.1 mm Hg)22 are similar to normal humans (mean ± SD, 15.5 ± 2.6 mm Hg).23 However, our intraocular pressure measurements in these normal animals were made under a combination of intramuscular ketamine and xylazine, and the IOP in our animals (ranged from 8 mm Hg to 14 mm Hg) are overall slightly lower than the above mean IOP. There are two possible reasons for the lower IOP measurements: 1) the effects of ketamine can be time dependent24-26, thus IOP may have become more variable and lower than actual pressures in both the normal and glaucomatous monkey eye in our experimental settings; and 2) there may be an additional pressure lowering effect of xylazine, which has been previously reported to significantly reduce IOP in rabbits, cats, and monkeys.27
In conclusion, this paper rigorously characterizes the range of PID and PIPD Maximums in ONH neural and connective tissue architecture within six normal rhesus monkeys. The PID and PIPD Maximums of this report serve to clarify our previous studies in early experimental glaucoma and will now be used as reference values for a series of articles on inter-eye differences in ONH architecture within bilaterally normal as well as early, moderate and severe experimental glaucoma monkeys perfusion fixed with each eye at either identical or differing levels of intraocular pressure.
Supplementary Material
Acknowledgments
The authors gratefully acknowledge the following individuals for their assistance with this study. Jonathon Grimm and Juan Reynaud for their assistance with software for volumetric and thickness quantification, Michael Roberts for his assistance with Matlab software, Galen Williams for his help with delineation, Wenxia Wang for her help with animal testing, Hillary Thompson and Stuart Gardiner for statistical consultation, and Joanne Couchman for her assistance with manuscript preparation and figures.
Supported in part by USPHS grants R01EY011610 (CFB) from the National Eye Institute, National Institutes of Health, Bethesda, Maryland; a grant from the American Health Assistance Foundation, Rockville, Maryland (CFB); a grant from The Whitaker Foundation, Arlington, Virginia (CFB); a Career Development Award (CFB); The Legacy Good Samaritan Foundation, Portland, Oregon; and the Sears Trust for Biomedical Research, Mexico, and Missouri.
Footnotes
Presented in part at the Association for Research in Vision and Ophthalmology annual meeting, Fort Lauderdale, Florida, May 2008.
Proprietary Interest Category: N
References
- 1.Burgoyne CF, Quigley HA, Thompson HW, et al. Early changes in optic disc compliance and surface position in experimental glaucoma. Ophthalmology. 1995;102:1800–1809. doi: 10.1016/s0161-6420(95)30791-9. [DOI] [PubMed] [Google Scholar]
- 2.Derick RJ, Pasquale LR, Pease ME, et al. A clinical study of peripapillary crescents of the optic disc in chronic experimental glaucoma in monkey eyes. Arch Ophthalmol. 1994;112:846–850. doi: 10.1001/archopht.1994.01090180146049. [DOI] [PubMed] [Google Scholar]
- 3.Gaasterland D, Tanishima T, Kuwabara T. Axoplasmic flow during chronic experimental glaucoma. 1. Light and electron microscopic studies of the monkey optic nervehead during development of glaucomatous cupping. Invest Ophthalmol Vis Sci. 1978;17:838–846. [PubMed] [Google Scholar]
- 4.Pederson JE, Gaasterland DE. Laser-induced primate glaucoma. I. Progression of cupping. Arch Ophthalmol. 1984;102:1689–1692. doi: 10.1001/archopht.1984.01040031373030. [DOI] [PubMed] [Google Scholar]
- 5.Quigley HA, Addicks EM. Chronic experimental glaucoma in primates. I. Production of elevated intraocular pressure by anterior chamber injection of autologous ghost red blood cells. Invest Ophthalmol Vis Sci. 1980;19:126–136. [PubMed] [Google Scholar]
- 6.Quigley HA, Addicks EM. Chronic experimental glaucoma in primates. II. Effect of extended intraocular pressure elevation on optic nerve head and axonal transport. Invest Ophthalmol Vis Sci. 1980;19:137–152. [PubMed] [Google Scholar]
- 7.Dandona L, Hendrickson A, Quigley HA. Selective effects of experimental glaucoma on axonal transport by retinal ganglion cells to the dorsal lateral geniculate nucleus. Invest Ophthalmol Vis Sci. 1991;32:1593–1599. [PubMed] [Google Scholar]
- 8.Quigley HA, Sanchez RM, Dunkelberger GR, et al. Chronic glaucoma selectively damages large optic nerve fibers. Invest Ophthalmol Vis Sci. 1987;28:913–920. [PubMed] [Google Scholar]
- 9.Hayreh SS, Pe'er J, Zimmerman MB. Morphologic changes in chronic high-pressure experimental glaucoma in rhesus monkeys. J Glaucoma. 1999;8:56–71. [PubMed] [Google Scholar]
- 10.Quigley HA, Hohman RM. Laser energy levels for trabecular meshwork damage in the primate eye. Invest Ophthalmol Vis Sci. 1983;24:1305–1307. [PubMed] [Google Scholar]
- 11.Downs JC, Yang H, Girkin C, et al. Three Dimensional Histomorphometry of the Normal and Early Glaucomatous Monkey Optic Nerve Head: Neural Canal and Subarachnoid Space Architecture. Invest Ophthalmol Vis Sci. 2007;48:3195–3208. doi: 10.1167/iovs.07-0021. [DOI] [PMC free article] [PubMed] [Google Scholar]
- 12.Yang H, Downs JC, Girkin C, et al. 3-D Histomorphometry of the Normal and Early Glaucomatous Monkey Optic Nerve Head: Lamina Cribrosa and Peripapillary Scleral Position and Thickness. Invest Ophthalmol Vis Sci. 2007;48:4597–4607. doi: 10.1167/iovs.07-0349. [DOI] [PMC free article] [PubMed] [Google Scholar]
- 13.Yang H, Downs JC, Bellezza AJ, et al. 3-D Histomorphometry of the Normal and Early Glaucomatous Monkey Optic Nerve Head: Prelaminar Neural Tissues and Cupping. Invest Ophthalmol Vis Sci. 2007;48:5068–5084. doi: 10.1167/iovs.07-0790. [DOI] [PubMed] [Google Scholar]
- 14.Burgoyne CF, Downs JC, Bellezza AJ, et al. Three-dimensional reconstruction of normal and early glaucoma monkey optic nerve head connective tissues. Invest Ophthalmol Vis Sci. 2004;45:4388–4399. doi: 10.1167/iovs.04-0022. [DOI] [PubMed] [Google Scholar]
- 15.Bellezza AJ, Rintalan CJ, Thompson HW, et al. Deformation of the lamina cribrosa and anterior scleral canal wall in early experimental glaucoma. Invest Ophthalmol Vis Sci. 2003;44:623–637. doi: 10.1167/iovs.01-1282. [DOI] [PubMed] [Google Scholar]
- 16.Sigal IA, Flanagan JG, Tertinegg I, et al. Finite element modeling of optic nerve head biomechanics. Invest Ophthalmol Vis Sci. 2004;45:4378–4387. doi: 10.1167/iovs.04-0133. [DOI] [PubMed] [Google Scholar]
- 17.Sigal IA, Flanagan JG, Tertinegg I, et al. Reconstruction of human optic nerve heads for finite element modeling. Technol Health Care. 2005;13:313–329. [PubMed] [Google Scholar]
- 18.Sigal IA, Flanagan JG, Ethier CR. Factors influencing optic nerve head biomechanics. Invest Ophthalmol Vis Sci. 2005;46:4189–4199. doi: 10.1167/iovs.05-0541. [DOI] [PubMed] [Google Scholar]
- 19.Sigal IA, Flanagan JG, Tertinegg I, et al. Modeling individual-specific human optic nerve head biomechanics. Part II: influence of material properties. Biomech Model Mechanobiol. 2008 doi: 10.1007/s10237-008-0119-0. [DOI] [PubMed] [Google Scholar]
- 20.Sigal IA, Flanagan JG, Tertinegg I, et al. Modeling individual-specific human optic nerve head biomechanics. Part I: IOP-induced deformations and influence of geometry. Biomech Model Mechanobiol. 2008 doi: 10.1007/s10237-008-0120-7. [DOI] [PubMed] [Google Scholar]
- 21.Strouthidis NG, Yang H, Fortune B, et al. Detection of the Optic Nerve Head Neural Canal Opening within Three-Dimensional Histomorphometric and Spectral Domain Optical Coherence Tomography Data Sets. Invest Ophthalmol Vis Sci. 2008 doi: 10.1167/iovs.08-2302. In Press. [DOI] [PMC free article] [PubMed] [Google Scholar]
- 22.Bito LZ, Merritt SQ, DeRousseau CJ. Intraocular pressure of rhesus monkey (Macaca mulatta). I. An initial survey of two free-breeding colonies. Invest Ophthalmol Vis Sci. 1979;18:785–793. [PubMed] [Google Scholar]
- 23.Schottenstein EM. Intraocular Pressure and Tonometry. In: Ritch R, Schields MB, Krupin T, editors. The Glaucomas. St. Louis: Mosby; 1996. [Google Scholar]
- 24.Blumberg D, Congdon N, Jampel H, et al. The effects of sevoflurane and ketamine on intraocular pressure in children during examination under anesthesia. Am J Ophthalmol. 2007;143:494–499. doi: 10.1016/j.ajo.2006.11.061. [DOI] [PubMed] [Google Scholar]
- 25.Ausinsch B, Rayburn RL, Munson ES, et al. Ketamine and intraocular pressure in children. Anesth Analg. 1976;55:773–775. doi: 10.1213/00000539-197611000-00005. [DOI] [PubMed] [Google Scholar]
- 26.Peuler M, Glass DD, Arens JF. Ketamine and intraocular pressure. Anesthesiology. 1975;43:575–578. doi: 10.1097/00000542-197511000-00018. [DOI] [PubMed] [Google Scholar]
- 27.Burke JA, Potter DE. The ocular effects of xylazine in rabbits, cats, and monkeys. J Ocul Pharmacol. 1986;2:9–21. doi: 10.1089/jop.1986.2.9. [DOI] [PubMed] [Google Scholar]
Associated Data
This section collects any data citations, data availability statements, or supplementary materials included in this article.