

Abstract
Objectives
To examine the cost-effectiveness of the Fast Track intervention, a multi-year, multi-component intervention designed to reduce violence among at-risk children. A previous report documented the favorable effect of intervention on the highest-risk group of ninth-graders diagnosed with conduct disorder, as well as self-reported delinquency. The current report addressed the cost-effectiveness of the intervention for these measures of program impact.
Design
Costs of the intervention were estimated using program budgets. Incremental cost-effectiveness ratios were computed to determine the cost per unit of improvement in the 3 outcomes measured in the 10th year of the study.
Results
Examination of the total sample showed that the intervention was not cost-effective at likely levels of policymakers' willingness to pay for the key outcomes. Subsequent analysis of those most at risk, however, showed that the intervention likely was cost-effective given specified willingness-to-pay criteria.
Conclusions
Results indicate that the intervention is cost-effective for the children at highest risk. From a policy standpoint, this finding is encouraging because such children are likely to generate higher costs for society over their lifetimes. However, substantial barriers to cost-effectiveness remain, such as the ability to effectively identify and recruit such higher-risk children in future implementations.
Despite recent declines in juvenile delinquency and violence, conduct problems among children and youth remain a serious problem. Particularly problematic are “early starters,” children or youth whose conduct problems emerge early in life,1 as such problems often lead to personal and social costs later. Those costs include criminal activities, substance use and abuse, and problems associated with early sexual debut, such as unwanted pregnancies and sexually transmitted diseases.2,3
The costs of a life of crime include government expenditures for criminal justice investigation, arrest, adjudication, and incarceration; costs to victims, such as medical costs, time missed from work, the value of stolen property, as well as loss of life; and costs that accrue to the criminal and his or her family, such as lost wages. In the most comprehensive analysis of its kind, Cohen4 estimates that high-risk youth may generate social costs approaching $2 million (current dollar value). This value is averaged across a range of likely values and based on the costs to society of 3 categories of individuals: career criminal ($1.3-$1.5 million), heavy drug user ($370 000-$970 000), and high-school dropout ($243 000-$388 000).
The high costs of conduct problems— and the fact that a small proportion of children and youth account for a disproportionate share of crime and delinquency—suggest that society should consider devoting considerable resources to targeted prevention. As Russell5 argues, however, several features of prevention work against cost-effectiveness, even for effective programs. First, by its very nature, prevention involves expenditures in the present while the benefits accrue in the future. Because money now is worth more than money later, a dollar spent today has to generate more than a dollar's worth of benefits in the future. Second, because of imperfect targeting, prevention often expends resources on those who may not develop the problem or illness of interest. Those expenditures raise the costs of the program but generate little or perhaps even no return.
These characteristics are especially applicable in the prevention of conduct problems. As noted, research suggests that intervention toward those at risk for these problems should begin early in life, before a series of self-reinforcing mechanisms become entrenched.6,7 Starting early may be necessary, but at the same time, doing so raises the bar for cost-effectiveness. Many of the costs of problem behaviors are realized during adolescence, so intervening early lengthens the time between when expenditures are made and when their payoff is realized.
Furthermore, other research suggests that effective interventions target multiple aspects of a child's life (A.E. Olchowski, unpublished data, 2006).7,8 Selective interventions for higher-risk youth that have shown the most promise in the short-term are those that involve multiple components, such as Tremblay's Program and the Coping Power Program.9-11 While stacking intervention components may raise the likelihood of effectiveness, the effect on cost-effectiveness is uncertain.
This article examines the cost-effectiveness of the Fast Track program: an intensive, multi-component intervention targeted to the prevention of aggression in young children. This project identified children at early ages and provided a range of intervention services during a 10-year period. Outcome analyses using an intent-to-treat design reveal that during the first 5 years the intervention was moderately successful in achieving its proximal goals of altering developmental processes related to conduct disorder, with effect sizes in the range of 0.2 to 0.5 standard deviations.12-15 By the end of ninth grade, however, the favorable effects of intervention were limited to the highest-risk group of youth. Among the highest-risk group, the youth assigned to the intervention had fewer than half as many cases of psychiatrically diagnosed conduct disorder as did the control group youth (Conduct Problems Prevention Research Group, unpublished data, 2006). Among the more moderate-risk youth, the differences between the intervention and control groups were not significant. While these effects of intervention are encouraging, the intervention is quite costly. The next section describes the intervention and the methodology used to estimate those costs. The following section presents incremental cost-effectiveness ratios for the measures of conduct disorder, interpersonal violence, and index crimes. Finally, a discussion considers the public policy implications.
Methods
In this section we describe the intervention and the budget evaluation that provided data for these analyses. We also describe our cost-effectiveness methodology.
Fast Track Intervention
The Fast Track project is a randomized trial designed to evaluate a comprehensive intervention. Intervention components are delivered in first through 10th grade and target multiple critical determinants of development: parenting, peer relations, and social-cognitive and cognitive skills. During the elementary-school phase of the intervention, all families were offered parent training with home visiting, academic tutoring, and social skill training. Parent and child group interventions were conducted during a 2-hour enrichment program held at the school building on Saturdays or weekday evenings. During the first 60 to 90 minutes of this enrichment program, target at-risk children met in groups of 5 or 6, called friendship groups, which were led by educational coordinators and coleaders, while parents met in a group led by family coordinators to discuss parenting strategies that would support their child's school adjustment and improve child behavior. In the next 30 minutes, parent-child pairs participated in positive cooperative activities and practiced positive parenting skills with staff support (parent-child sharing time). Academic tutoring to promote reading skills was provided by paraprofessional tutors in the last 30 minutes of the group meeting and twice more each week during school hours to all children in first grade.
Group meetings were held weekly during first grade for 22 sessions, biweekly during second grade for 14 sessions, monthly during third through fifth grade for 9 sessions each year, and 4 times during sixth grade. In addition to the group meetings, individual support was provided through peer pairing and home visiting to children and parents to help them generalize the skills presented in the group setting and to address individual needs. Tutors provided a weekly session for pairing with popular peers to enhance friendships. Children and families received a standard level of services in first grade, to the extent that they could be delivered. In subsequent years, criterion-referenced assessments were used to adjust the dosage of some of these components to match the level of functioning of each family and child. In second grade and beyond, each child was assessed by the teacher for reading performance in the classroom. Children who scored in the lowest one third of the classroom were targeted for reading tutoring. Similar assessments and individualized services were completed for other types of tutoring, home visiting, peer coaching, mentoring, and after-school programming. A mentoring program was added in fourth grade to provide same-gender, same-race role models to promote children's positive identity development, if indicated by criterion-referenced assessments. Monthly group sessions for parents and youth continued in fifth and sixth grade to deal with the challenges of transitioning into middle school, resisting drug use, and sexual development. In seventh and eighth grade, workshops relating to identity and vocational goal setting were held.
In addition to indicated interventions, a universal intervention was provided to the classrooms in which targeted youth were located. This curriculum, which was an adaptation of the PATHS Curriculum,16 was designed to promote a more competent and less aggressive social ecology, focusing on social and emotional development. The curriculum started with teaching adolescents to recognize their own emotions and the emotions of others; moved to teaching social-problem solving, impulse control, and reflective thought; and grew to address student-specific social dilemmas in later grades. Teachers implemented this classroom-level program throughout grades first through fifth, teaching an average of 2 to 3 lessons per week. In addition, the universal intervention included weekly consultation with teachers, during which classroom behavior management issues were addressed. From seventh through 10th grades, individualized intervention plans were developed and implemented with each youth, based on triannual assessments of risk and protective factors. Further details on intervention components are provided elsewhere.12
Evaluation of the Intervention
The intervention is being evaluated through a multi-cohort, multi-site, multi-year study of program participants and comparable children and youth in similar schools, and that study provides the data for these analyses (Conduct Problems Prevention Research Group, unpublished data, 2006).12-15 In particular, schools within 4 sites (Durham, NC; Nashville, Tenn; Seattle, Wash; and rural central Pennsylvania) were identified as high risk based on crime and poverty statistics of the neighborhoods they served. Within each site, the schools were divided into sets matched for demographics (size, percentage of free or reduced lunches, ethnic composition); the sets were then randomly assigned to intervention and control conditions.
Within participating schools, evaluation participants were identified using a multiple-gating procedure. For each of 3 annual cohorts, all kindergarteners in 54 schools (9594 total children) were screened for classroom conduct problems by teachers. Those children scoring in the top 40 percent within the cohort and site were then solicited for the next stage of screening for home behavior problems by the parents, and 91% agreed (n = 3274).17 The teacher and parent screening scores were then standardized and combined into a sum score, based on the screening of a representative sample of about 100 children within each site (which also served as a normative comparison). These summed scores represented a total severity-of-risk screen score. Children were selected for inclusion into the study based on this screen score, moving from the highest score downward until desired sample sizes were reached within sites, cohorts, and conditions. Deviations were made when a child failed to matriculate in the first grade at a core school (n = 59) or refused to participate (n = 75), or to accommodate a rule that no child would be the only girl in an intervention classroom. Ninety-five percent of the selected sample scored in the top 20% on both the parent- and teacher-screening measures. The outcome was that 891 children (n = 445 intervention, n = 446 control) participated. Note that these levels of problems are defined relative to other children in these high-risk schools. On the kindergarten teacher's report form of the Child Behavior Checklist, which provides national norms, the average externalizing T-score (available for 88% of the high-risk sample) was 66.4. Seventy-six percent of these children scored in the clinical range (T-scores of 60 or higher).
The study has collected data from a range of people—the youth themselves, caregivers, teachers, and peers—and has obtained key archival data as well (such as school records). Over time, rates of attrition have been modest; 83% continued to provide data at the 10th year of follow-up.
Participation was defined as attendance at 1 or more group sessions. Ninety-six percent of parents and 98% of children participated during first grade (or year 2 of the project). Of these families, 79% of parents and 90% of children attended at least 50% of all sessions. In second grade, 88% of parents and 92% of children participated, with 79% of parents and 87% of children attending at least 50% of all sessions. In third grade, 80% of parents and 86% of children participated, with 78% of parents and 84% of children attending at least 50% of all sessions. The proportion of families unable to participate in the intervention increased modestly across the years, primarily because of moves out of the area. In the last year of the group sessions (sixth grade), 43 of the 445 intervention families (10%) did not participate but had still received the majority of the services in previous years.
Key Measures
The cost-effectiveness analyses focus on 3 key long-term outcomes. The first is a diagnosis of conduct disorder, defined as “a repetitive and persistent pattern of behavior in which the basic rights of others or major age-appropriate societal norms or rules are violated.”18 This diagnosis was determined using the Diagnostic Interview Schedule for Children,19 which provides a highly structured, laptop computer–administered, clinical interview to assess DSM-IV psychiatric disorders in children and adolescents aged 6 to 17 years. Interviewers not informed about intervention status were trained to criterion. Administration took place during the summer preceding 10th grade in the child's home with the primary caregiver (usually the mother). The primary outcome of interest was the diagnosis of conduct disorder.
The second and third outcomes were derived from the Self-Report of Delinquency.20 This measure was administered to youth during the summer prior to 10th grade. This instrument yields a primary 13-item scale called Index Criminal Offenses that includes items such as “stolen an item greater than a hundred dollars in value” and “sold heroin or LSD,” and a 6-item scale called Interpersonal Violence that includes items such as “attacked someone with intent to hurt” and “had sex with someone against their will.”
The cost-effectiveness ratios presented below represent the costs per case of conduct disorder averted, index criminal offense avoided, and act of interpersonal violence avoided.
Costs of the Intervention
The costs of the intervention were estimated using the principles of economic evaluation.21,22 The perspective from which costs were assessed was that of a payer, such as a state department of mental health. Costs were estimated for the period of intervention delivery (fall of 1991 through summer of 2003) and were culled either from annual budget records or, for early years of the intervention, projected from detailed analyses of April, July, and October costs.1
A key task in this process involved identifying the portion of total project costs that were used for intervention delivery. The principal resource for the intervention involved personnel, so the first step in estimating these costs was documenting salary/amount paid per person who had worked for Fast Track in any year. These amounts were then allocated based on the degree to which each person was involved with intervention services rather than research. Those who were exclusively involved in administrative or research tasks were not included in personnel dollar sums. Amounts for individuals in shared positions were allocated based on the principal investigators' estimation of how duties were divided (for instance, educational coordinators were allocated at 20% intervention during the summer months when research interviews were occurring). Fringe amounts were either explicitly available or calculated from obtained fringe rates.
Nonpersonnel amounts were recorded from budget accounts and marked as intervention-related or other (ie, research or administrative related). If information was not available to identify the exact amount, costs were allocated according to percentage of total (personnel) salary devoted to intervention. For instance, costs with unidentified purpose (eg, miscellaneous supplies) were assumed to occur proportionally to the percentage of total Fast Track personnel working for the intervention component during that month.
If overhead costs such as rent were absorbed by the university overseeing research at each site, then overhead amounts were added to these estimates. Unless other information was available, a standard 20% was added to represent these costs. This figure was calculated as the difference between the on-campus and off-campus rates. Our sense was that the discount the university gives for leaving campus reflects the costs of being on campus (ie, of rent and utilities).
All costs were adjusted for inflation and expressed in 2004 US dollars. Reflecting that these funds were expended over time, we discounted all expenditures back to the first year of the study using a discount rate of 5%. Averaging across sites and cohorts, these tabulations produced a per-child estimate of $58 283 in 2004 US dollars. In the analyses below, we allowed for differences across cohorts in the intervention costs. Those costs were $62 323, $56 581, and $55 946 for cohorts 1 through 3, respectively.2
Cost-Effectiveness Methodology
Traditional methods of cost-effectiveness analysis revolve around incremental cost-effectiveness ratios (ICERs).21,23 The ICER is constructed as follows: the numerator represents the differences in costs for the contrasted interventions, and the denominator represents the difference in average effect sizes. (This formula simplifies to a ratio of program costs to intervention effects in this paper since the usual treatment is assumed to be that no intervention was delivered. Intervention effects are measured as the difference in effect size for the given outcome between intervention and control groups.)
The key question is whether the ICER of a new intervention, relative to an existing one, exceeds a policymaker's or society's willingness to pay (λ) for improvements in the outcome of interest. If the ICER is less than λ, then the new technology or intervention is desirable.
Because of sampling error, this inequality is probabilistic, and thus some measure of this uncertainty is needed. This uncertainty was gauged using bootstrapping,24 which involves taking numerous subsamples of the full data to estimate variation in group estimates. (For our estimates, we generated 1000 bootstrapped samples.) An advantage of bootstrapping is that error variation due to sampling does not rely on distributional assumptions for the outcomes of interest.
One measure of a policymaker's willingness to pay is the potential reductions in the costs of crime stemming from the program. Cohen25 estimates that the public and private costs of a life of crime exceed $1 million. For an index crime, like armed robbery, Cohen reports that willingness to pay is roughly $150 000; for an act of interpersonal violence, such as serious assault, willingness to pay equals $50 000. Updating the figures in Cohen into 2004 US dollars, we have set λ at $1 million for the conduct disorder outcome, $160 000 for the index crime, and $50 000 for the act of interpersonal violence.4 (These amounts were determined after converting to current US dollars, discounting backward 9 years from the onset of the costs of a life of crime (at age 14 years) to the start of the intervention (at age 6 years) at a discount rate of 5%, and then rounding to the nearest $5000.)
Results
Fast Track Sample
Table 1 describes the Fast Track sample used in these analyses. The table columns provide figures separately for intervention and control cases as well as by level of initial risk, where higher-risk children are those above the 90th percentile on screening measures, and lower-risk children are those recruited into the intervention sample despite being less at risk (between the 70th and 90th percentile). As discussed above, initial risk has been identified as a significant moderator of intervention impact.
Table 1. Sample Composition by Level of Initial Risk and Intervention Status.
| Level of Initial Risk | |||||||||
|---|---|---|---|---|---|---|---|---|---|
| Lower* | Higher† | Total | |||||||
| Control | Intervention | Total | Control | intervention | Total | Control | intervention | Total | |
| Male | |||||||||
| Mean | 0.64 | 0.67 | 0.65 | 0.70 | 0.77 | 0.74 | 0.66 | 0.71 | 0.69 |
| SD | 0.48 | 0.47 | 0.48 | 0.46 | 0.42 | 0.44 | 0.47 | 0.45 | 0.46 |
| Sample size | 192 | 203 | 395 | 142 | 142 | 284 | 334 | 345 | 679 |
| African American | |||||||||
| Mean | 0.51 | 0.61 | 0.56 | 0.46 | 0.49 | 0.47 | 0.49 | 0.56 | 0.52 |
| SD | 0.50 | 0.49 | 0.50 | 0.50 | 0.50 | 0.50 | 0.50 | 0.50 | 0.50 |
| Sample size | 192 | 203 | 395 | 142 | 142 | 284 | 334 | 345 | 679 |
| Cohort 1 | |||||||||
| Mean | 0.34 | 0.37 | 0.36 | 0.40 | 0.35 | 0.37 | 0.37 | 0.36 | 0.37 |
| SD | 0.48 | 0.49 | 0.48 | 0.49 | 0.48 | 0.48 | 0.48 | 0.48 | 0.48 |
| Sample size | 192 | 203 | 395 | 142 | 142 | 284 | 334 | 345 | 679 |
| Cohort 2 | |||||||||
| Mean | 0.39 | 0.38 | 0.38 | 0.33 | 0.33 | 0.33 | 0.37 | 0.36 | 0.36 |
| SD | 0.49 | 0.49 | 0.49 | 0.47 | 0.47 | 0.47 | 0.48 | 0.48 | 0.48 |
| Sample size | 192 | 203 | 395 | 142 | 142 | 284 | 334 | 345 | 679 |
| Cohort 3 | |||||||||
| Mean | 0.27 | 0.25 | 0.26 | 0.27 | 0.32 | 0.30 | 0.27 | 0.28 | 0.27 |
| SD | 0.44 | 0.43 | 0.44 | 0.44 | 0.47 | 0.46 | 0.44 | 0.45 | 0.45 |
| Sample size | 192 | 203 | 395 | 142 | 142 | 284 | 334 | 345 | 679 |
Lower = below the 90th percentile on screening measures.
Higher = above the 90th percentile on screening measures.
ICERs for the 3 Outcomes
The top section of Table 2 presents the ICERs for the entire sample for the 3 outcomes. Each is calculated as the costs of the program divided by the incremental impact of the program. The first of these represents the cost of the program per case of conduct disorder averted ($3 481 433). The second represents the cost per (index) crime averted ($423 480). The third represents cost per act of interpersonal violence averted ($736 010). The resulting standard errors for all 3 estimates are large and were determined using bootstrapping.
Table 2. ICERs by Outcome and Initial Risk Status.
| ICER (SE), $ | p1* | p2† | |
|---|---|---|---|
| Entire intervention sample | |||
| Conduct disorder | 3 481 433 (81 000 000) | 0.01 | 0.18 |
| Index crime | 423 480 (11 000 000) | 0.01 | 0.08 |
| Interpersonal violence | 736 010 (38 700 000) | 0.00 | 0.07 |
| Lower-risk group only | |||
| Conduct disorder | −2 059 828 (75 100 000) | 0.00 | 0.94 |
| Index crime | −1 786 032 (40 400 000) | 0.00 | 0.61 |
| Interpersonal violence | −9 046 977 (12 900 000) | 0.00 | 0.54 |
| Higher-risk group only | |||
| Conduct disorder | 752 103 (3 588 311) | 0.69 | 0.01 |
| Index crime | 150 738 (787 270) | 0.57 | 0.01 |
| Interpersonal violence | 283 542 (5 153 761) | 0.00 | 0.01 |
Abbreviations: ICER, incremental cost-effectiveness ratio; SE, standard error.
p1 represents the probability that the incremental cost-effectiveness ratio is positive and below the societal willingness to pay.
p2 represents the probability that the incremental cost-effectiveness ratio is negative.
The sampling variability exhibited in Table 2 must be acknowledged when considering the ICER estimates. A useful approach here is to consider the probability that the intervention was cost effective. Table 2 provides the cost-effectiveness probabilities (p1) in the fourth column, derived as the proportion of bootstrapped samples with ICERs below willingness-to-pay thresholds listed. Using these criteria, the estimated probability of cost-effectiveness among the full Fast Track sample was either 1% (for conduct disorder and index crime outcomes) or zero (for the interpersonal violence outcome). While not cost-effective, the positive ICERs are indicative that the program was effective for these outcomes. The probability of an effective result can be determined from the fifth column in Table 2, which provides the probability of a negative ICER (p2). Based on all bootstrapped sample estimates, the probability that the intervention was effective (ie, a positive ICER, but not necessarily cost-effective) is calculated as 82% for the conduct disorder outcome, 92% for the index crime outcome, and 93% for the interpersonal violence outcome (these are the same as 1 – p2 in Table 2).
Variation in Cost-Effectiveness by Initial Risk Status
As noted, prior analyses have detected a substantial interaction of intervention impact with initial risk status (Conduct Problems Prevention Research Group, unpublished data, 2006). Reflecting those analyses, we considered differential cost-effectiveness. The middle and lower sections of Table 2 present the ICERs for the lower- and higher-risk groups, respectively. The lower-risk group has negative ICERs for all 3 outcomes. In contrast, the higher-risk children have positive ICERs for all 3 outcomes. For the conduct disorder and index crime outcomes among the higher-risk group, the ICERs are cost-effective (less than the $1 million and $160 000 thresholds, respectively). The interpersonal crime outcome is not cost-effective for the higher-risk group as defined by the criteria in this study.
Considering all bootstrapped observations for the higher-risk group, the estimated probability of cost-effectiveness (ie, probability that the ICER is less than defined willingness-to-pay values) is 69% for the conduct disorder outcome, 57% for the index crime outcome, and 0% for the interpersonal violence outcome. Among the low-risk group, none of the bootstrapped samples yielded a cost-effective outcome. The contrast between lower- and higher-risk groups is also apparent for overall effectiveness rates. The low-risk group demonstrates higher probabilities for negative effects (negative ICERs) whereas the probability for intervention effectiveness (positive ICERs) is calculated as 99% (or 1 – 0.01) for all 3 outcomes among the higher-risk group.
Using the so-called cost-effectiveness plane, the Figure provides a visual representation of the relationship between costs and effects. For simplicity, we only present this for the diagnosis of conduct disorder. The figure plots these estimates for all youth in the study and for those at higher and lower risk as defined by behavior problems at baseline. The dashed lines at 0 (incremental) costs and no impact divide the plane into 4 quadrants. (The bottom 2 are irrelevant in this case as the intervention was more costly.) The vertical (dashed) line at 0 incremental effectiveness provides a threshold for whether or not the intervention is effective (reduces or increases conduct disorder). For each point, the slope of a line from that point to the origin equals the ICER.
Figure.
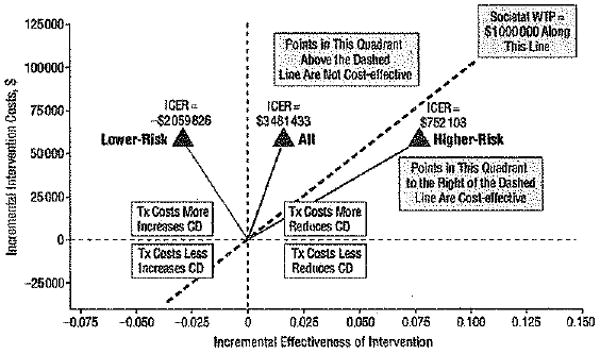
Incremental cost-effectiveness ratios (ICERs) for Fast Track sample and subsamples (lower- and high-risk): incremental cost per case of conduct disorder (CD) averted. Each point represents the costs and effects of intervention/treatment (Tx) on the cost-effectiveness plane. The slope of the corresponding line is the incremental cost-effectiveness ratio. Effectiveness measure scaled such that the x-axis is the increase in nondisordered cases. Abbreviation: WTP, willingness to pay.
A key feature of this figure is the visual representation of society's willingness to pay to avert a case of conduct disorder (λ in the discussion above). The willingness-to-pay line on this graph represents the limit for how much society is willing to pay in incremental intervention costs given a certain effect size of the intervention. Points to the right of that dashed line represent samples for which the intervention is cost-effective. The ICERs that fall in the area above the willingness-to-pay line but in the northeast quadrant represent samples for which the intervention is beneficial but not cost-effective (for a given value of λ).
The triangle labeled “All” represents the ICER calculated using the full sample: $3.48 million per case averted (as in Table 2). This figure is above $1 million and indicates that the intervention is likely not cost-effective. As noted, given the standard error for the ICER, the chance that the ICER is less than $1 million is 1%. The difference between the 2 subgroups is also represented. The ICER for the lower-risk group is to the left of the vertical line at 0, indicating that the intervention was not effective for those children. In sharp contrast, the higher-risk group shows positive intervention effects and is to the right of the willingness-to-pay (cost-effective) line.
The Figure does not take into account sampling variation. This is especially important given the location of the ICERs relative to key thresholds. For instance, it is not likely that all samples from the same population would result in a cost-effective ICER estimate for the higher-risk group on the conduct disorder outcome given the standard errors indicated by bootstrapping (to the right of the willingness-to-pay line in the Figure). At the same time, not all samples would result in negative ICERs for the low-risk group. Figures showing the bootstrapped samples are available from the first author.
Comment
This article suggests that expensive interventions still may be cost-effective, but the intervention must target a population that is particularly costly to society when left untreated. A condition such as conduct disorder (and the subsequent violent behavior that often results from it) creates enormous public costs, so societal willingness to pay is likely quite high. Of course, this condition is necessary but not sufficient for an intervention to be cost-effective.
Our analyses suggest that the likelihood of cost-effectiveness for reducing conduct disorder for those most at risk approaches 70%. As noted throughout the text, this finding depends on a series of assumptions, such as the discount rate used to measure future program costs and benefits. A sensitivity analysis suggests that a 3% rate would produce very similar results.
It is also important to note that the intervention produced no benefits for a substantial portion of the sample. This finding is rather striking given that these youth were still at heightened risk for long-term problems—they live in high-poverty neighborhoods and manifested greater problems at younger ages than did their peers. One possibility for these youth might be to intervene earlier. Earlier intervention may help those at the highest risk, as well. However, intervening even earlier creates additional barriers to cost-effectiveness. The benefits of the intervention still will be incurred during adolescence, and those benefits will be discounted even further. In addition, identifying these children before they enter school may prove rather challenging. One possibility would be to work with day care or prekindergarten programs. As more children, especially poor children, enter such programs, early identification and intervention may become more cost-effective.
Another possibility is that the intervention actually was too early rather than too late. Most evaluations of the early starter model use age 14 years as the cut-off point for early and late starters, which is roughly the age of the sample when these outcomes were measured.26 The data from parents on conduct disorder diagnoses at the end of ninth grade would support this conclusion to some extent, since both the lower-risk intervention and control groups have lower rates than the higher-risk intervention group. By including these lower-risk children in the sample, some children who did not really fit the early starter profile may have been added to the sample. It is possible that more of these lower-risk youth will enter the heightened delinquency phase of adolescence in subsequent years because they live in high-poverty neighborhoods and will be subject to the pressures and temptations to engage in delinquent acts. If this is true, a better test of effectiveness with these lower-risk youth may be made in a few years. The other conclusion that could be reached about this lower-risk group is that the intervention simply was not appropriate for them, for reasons that cannot be known at this point.
The likelihood of cost-effectiveness critically depends on whether conduct disorder manifests itself in delinquency and crime over time. That the likelihood of cost-effectiveness was lower for index offenses and absent for interpersonal violence during the course of the study must temper claims for cost-effectiveness.
The probability of cost-effectiveness might be improved in several ways. Fast Track was designed to be an effective program, not (necessarily) a cost-effective program. Thus investigators were focused on maximizing intervention effectiveness. A future trial might improve the cost-effectiveness of the intervention by eliminating or reducing intervention components. Removing costly components that do not contribute to intervention effects will clearly improve results. More generally, reducing the program's costs can improve the intervention's cost-effectiveness even while reducing its overall effectiveness. This area is one for future research.
Limitations
The study has several limitations. First, the outcomes used to gauge cost-effectiveness are from parent- and youth-report measures and thus reliant on the accuracy of the respondent. Respondents face some incentive to under-report offenses, especially those for which they have not been punished. There is no reason to believe that under-reporting would differ between the intervention and control groups, although it may be that respondents in the intervention were more honest with interviewers because of their familiarity with the project.
Second, judgment of intervention effectiveness was based on 1 year of assessment. These analyses assume that the intervention effects will persist and that the measures considered here are good proxies or at least strong predictors for the life-of-crime outcome. To the extent that this relationship is weaker or uncertain, the likelihood of cost-effectiveness may very well be lower than that reported here. On the other hand, age 14 years is still on the early side of the adolescent delinquency curve and more solid evidence on who can be projected for long-term criminal activity may emerge from subsequent assessment. Additionally, it is important to note that the relationship between conduct disorder and a life of crime is likely strongest for those individuals most at risk initially. These are the individuals likely targeted by a future implementation of the program.
Third, the measure of willingness to pay is based on the experiences of other individuals in other studies. The uncertainty surrounding those figures can be reduced by measuring the public and social costs of the behaviors of these particular individuals. Such work would lead naturally to a full benefit-cost analysis and is under way.
That analysis might include a broader range of outcomes than those considered here. The discussion of willingness to pay focuses on the public and social costs of crime. However, youth with conduct disorders are at risk for a range of other negative outcomes, such as school failure. Our analyses here focused on crime and delinquency, because such behavior was the focus of the intervention. However, those behaviors may mediate the effect of the intervention on other outcomes, further raising societal willingness to pay for a program reducing them. Thus, results presented here are best judged as conservative.
Targeting
These analyses highlight the importance of targeting the intervention to those most at risk. For those individuals, the intervention appears more effective. Societal willingness to pay is likely even larger for these individuals, further increasing (the likelihood of) cost-effectiveness. Even among all individuals in the targeted groups, these individuals likely account for a disproportionate share of violent and other crimes.
Targeting, however, has other implications. In particular, cutting the scale of the program in half may raise costs still higher. One way to keep those costs down might be to combine cohorts. For example, one might allow children to enter the program when aged 5 or 6 years. Program size also might be increased by drawing children and youth from a larger geographic area. Such an expansion, however, would have to be carefully planned. Increasing the catchment area might draw in lower-risk youth. The screening method used in this study defined participants in terms of relative risk, and so changing the population sampled might change the overall level of absolute risk as well.
Furthermore, such an expansion might raise travel and time costs for program participants. Because the perspective is that of a public payer, these costs were not included in the estimate of intervention costs presented here. However, they are still relevant for predicting and understanding program participation.27
An added issue related to program scale involves effectiveness. It is not clear whether the participation of the lower-risk children in the intervention was important to producing the program's benefits for those initially at greater risk. Such a relationship seems more likely for the group-based components of the intervention.
Barriers to Broader Implementation
In summary, these findings suggest that a costly intervention can be cost-effective. However, for the program to reach its public health potential, several barriers must be overcome. Primary among these is the sheer magnitude of program costs. On an annual basis, Fast Track is comparable in costs to alternative early intervention programs, such as Early Head Start, and comparable to or cheaper than programs treating children and youth after becoming long-term offenders (eg, boot camp or multisystemic therapy).28
Nonetheless, the resources required to provide such an intervention on a large scale are substantial. At any given time, there are about 2.1 million 5-year-olds living in the United States. If 5 percent of these youth are at risk of conduct disorder,29 then an outlay of $6.72 billion would be required to provide the intervention to these youth during a 10-year period. (One can think of this figure as representing total outlays for a cohort of children over time or the annual, ongoing costs to serve 10 cohorts in a given year.)
Clearly, such financial resources would require an unprecedented commitment to violence prevention. Nonetheless, this figure is not so large in comparison to other possible uses of the funds, such as incarceration. The costs of running state prisons alone exceeded $38 billion in 2001.30 Diverting those expenditures from treating problems after they occur to prevention will require strong leadership. Those constituencies within state or local government losing money to other uses will likely oppose such shifts. However, economic analysis offers great possibilities for documenting the need for such shifts. Washington State, for example, now directly compares the cost-effectiveness of a broad span of policy alternatives, ranging from nursing home visits to Scared Straight programs.28
Finally, it is worth noting that economic analysis is unlikely to show that a program like Fast Track will ever be self-financing—ie, that they can generate cost savings that completely cover the costs of the program. Many of the benefits of the program involve reduced tangible or intangible costs borne by other members of society. Those savings will never appear in public budgets. Of course, the same is true of other government programs, such as public education. These programs generate public and private benefits that accrue over time; that some of the returns may not appear in public budgets is irrelevant. Society recognizes the responsibility for educating young people. The same could be said for providing troubled young people with the skills they need to avoid a lifetime of failure.
Acknowledgments
Funding/Support: This work was supported by National Institute of Mental Health (NIMH) grants R18MH48043, R18MH50951, R18MH50952, and R18MH50953. The Center for Substance Abuse Prevention and the National Institute on Drug Abuse also have provided support for Fast Track through a memorandum of agreement with NIMH. This work was also supported in part by Department of Education grant S184U30002 and NIMH grants K05MH00797 and K05MH01027. The economic analysis of the Fast Track project is supported through NIMH grant R01MH62988.
Footnotes
Financial Disclosure: Drs Dodge, Greenburg, and McMahon have a contract with Oxford Univeristy Press to publish Fast Track curriculum.
References
- 1.Moffitt TE. Adolescence-limited and life-course-persistent antisocial behavior: a developmental taxonomy. Psychol Rev. 1993;100:674–701. [PubMed] [Google Scholar]
- 2.Brook JS, Whiteman M, Finch SJ, Cohen P. Young adult drug use and delinquency: childhood antecedents and adolescent mediators. J Am Acad Child Adolesc Psychiatry. 1996;35:1584–1592. doi: 10.1097/00004583-199612000-00009. [DOI] [PubMed] [Google Scholar]
- 3.Capaldi DM, Crosby L, Stoolmiller M. Predicting the timing of first sexual intercourse for at-risk adolescent males. Child Dev. 1996;67:344–359. [PubMed] [Google Scholar]
- 4.Cohen M. The monetary value of saving a high-risk youth. J Quant Criminol. 1998;14:5–30. [Google Scholar]
- 5.Russell S. Is Prevention Better Than the Cure? Washington, DC: Brookings Institution; 1986. [Google Scholar]
- 6.Webster-Stratton C, Taylor T. Nipping early risk factors in the bud: preventing substance abuse, delinquency, and violence in adolescence through interventions targeted at young children (0–8 years) Prev Sci. 2001;2:165–192. doi: 10.1023/a:1011510923900. [DOI] [PubMed] [Google Scholar]
- 7.Conduct Problems Prevention Research Group. A developmental and clinical model for the prevention of conduct disorders:the Fast Track Program. Dev Psychopathol. 1992;4:509–527. [Google Scholar]
- 8.Henggeler SW, Schoenwald SK, Borduin CM, Rowland MD, Cunningham PB. Multisystemic Treatment of Antisocial Behavior in Children and Adolescents. New York, NY: Guilford Press; 1998. [Google Scholar]
- 9.Lochman JE, Wells KC. Effectiveness study of Coping Power program and of classroom intervention with aggressive children at 1-year follow-up. Behav Ther. 2003;34:493–515. [Google Scholar]
- 10.Pepler DJ, King G, Craig W, Byrd W, Bream L. The development and evaluation of a multisystem social skills group training program for aggressive children. Child Youth Care Forum. 1995;24:297–313. [Google Scholar]
- 11.Tremblay RE, Pagani-Kurtz L, Masse LC, Vitaro F, Pihl RO. A bi-modal preventive intervention for disruptive kindergarten boys: its impact through mid-adolescence. J Consult Clin Psychol. 1995;63:560–568. doi: 10.1037//0022-006x.63.4.560. [DOI] [PubMed] [Google Scholar]
- 12.Conduct Problems Prevention Research Group. Initial impact of the Fast Track prevention trial for conduct problems, I: the high-risk sample. J Consult Clin Psychol. 1999;67:631–647. [PMC free article] [PubMed] [Google Scholar]
- 13.Conduct Problems Prevention Research Group. Initial impact of the Fast Track prevention trial for conduct problems, II: classroom effects. J Consult Clin Psychol. 1999;67:648–657. [PMC free article] [PubMed] [Google Scholar]
- 14.Conduct Problems Prevention Research Group. Evaluation of the first 3 years of the Fast Track prevention trial with children at high risk for adolescent conduct problems. J Abnorm Child Psychol. 2002;30:19–35. doi: 10.1023/a:1014274914287. [DOI] [PubMed] [Google Scholar]
- 15.Conduct Problems Prevention Research Group. The effects of the Fast Track program on serious problem outcomes at the end of elementary school. J Clin Child Adolesc Psychol. 2004;33:650–661. doi: 10.1207/s15374424jccp3304_1. [DOI] [PMC free article] [PubMed] [Google Scholar]
- 16.Kusche CA, Greenberg MT. The PATHS Curriculum. Seattle, Wash: Developmental Research and Programs; 1993. [Google Scholar]
- 17.Lochman JE, Conduct Problems Prevention Research Group Screening of child behavior problems for prevention programs at school entry. J Consult Clin Psychol. 1995;63:549–559. doi: 10.1037//0022-006x.63.4.549. [DOI] [PubMed] [Google Scholar]
- 18.American Psychiatric Association. Diagnostic and Statistical Manual of Mental Disorders, Fourth Edition-TR. Washington, DC: American Psychiatric Association; 2000. [Google Scholar]
- 19.Shaffer D, Fisher P. National Institute of Mental Health—Diagnostic Interview Schedule for Children: Parent Informant. New York, NY: New York State Psychiatric Institute; 1997. [Google Scholar]
- 20.Elliott D, Huizinga D, Ageton SS. Explaining Delinquency and Drug Use. Beverly Hills, Calif: Sage; 1985. [Google Scholar]
- 21.Gold MR, Russell LB, Siegel JE, Weinstein MC, editors. Cost-effectiveness in Health and Medicine. New York, NY: Oxford University Press; 1996. [Google Scholar]
- 22.Haddix AC, Teutsch SM, Corso PS, editors. Prevention Effectiveness: A Guide to Decision Analysis and Economic Evaluation. 2nd. Oxford, England: Oxford University Press; 2003. [Google Scholar]
- 23.Drummond MF, Stoddart GL, Torrance GW. Methods for the Economic Evaluation of Health Care Programmes. 2nd. Oxford, England: Oxford University Press; 1997. [Google Scholar]
- 24.Briggs AH, Wonderling DE, Mooney CZ. Pulling cost-effectiveness analysis up by its bootstraps: a non-parametric approach to confidence interval estimation. Health Econ. 1997;6:327–340. doi: 10.1002/(sici)1099-1050(199707)6:4<327::aid-hec282>3.0.co;2-w. [DOI] [PubMed] [Google Scholar]
- 25.Cohen MA. The Costs of Crime and Justice. London, England: Routledge; 2005. [Google Scholar]
- 26.Reid JB, Patterson GR, Snyder JJ. Antisocial Behavior in Children and Adolescents: A Developmental Analysis and the Oregon Model for Intervention. Washington, DC: American Psychological Association; 2002. p. xi.p. 337. [Google Scholar]
- 27.Foster EM, Shelton-Johnson D, Taylor T. Measuring time costs in psychosocial interventions: how and why. Am J Community Psychol. doi: 10.1007/s10464-007-9125-0. in press. [DOI] [PMC free article] [PubMed] [Google Scholar]
- 28.Aos S, Lieb R, Mayfield J, Miller M, Pennucci A. Benefits and Costs of Prevention and Early Intervention Programs for Youth. Seattle, Wash: Washington State Public Policy Institute; 2004. [Google Scholar]
- 29.Hinshaw SP, Anderson CA. Conduct and oppositional defiant disorders. In: Mash EJ, Barkley RA, editors. Child Psychopathology. New York, NY: Guilford Press; 1996. pp. 113–149. [Google Scholar]
- 30.Bureau of Justice Statistics. State Prison Expenditures, 2001. Washington, DC: US Dept of Justice, Office of Justice Programs; 2004. [Google Scholar]