Abstract
Transgenic mouse models of Marfan Syndrome (MFS) provide insight into the type and extent of vascular abnormalities manifested in this disease. Inclusion of the mgR mutation causes the otherwise normal extracellular matrix protein fibrillin-1 to be under-expressed at ~25% of its normal value, a condition seen in MFS. Aortas in patients with MFS are generally less distensible and may experience dissecting aneurysms that lead to premature death. In this study, mouse carotid arteries heterozygous (mgR HET) and homozygous (mgR KO) for the mgR mutation were studied under biaxial loading and compared to wild-type controls (mgR WT). Carotids from WT and HET mice exhibited similar mechanical characteristics whereas those from KO mice were only slightly stiffer in the circumferential direction. The most significant difference in the KO arteries was primarily in the axial direction where axial stiffness was greater and the in vivo axial prestretch was less than in WT and HET counterparts. Stress-stretch data were fit by a four-fiber family constitutive model for each mouse genotype using the simplex method of parameter estimation where a lower value of a parameter typically ascribed to the elastin-dominated amorphous matrix. In conclusion, it appears that changes in axial mechanical properties may afford vessels a means to compensate, in part, for the loss of important structural constituents as they attempt to maintain mechanical homeostasis.
Keywords: Fibrillin-1 (Fbn-1), mgR, knockout, dissecting aneurysm, stress-strain properties
INTRODUCTION
Marfan syndrome (MFS), affecting approximately one out of every 5,000 people,1 is characterized by abnormal bone growth, lens dislocation, and aortic dilation and dissection. This disease results from a variety of mutations in the gene coding for the elastin-associated extracellular matrix protein fibrillin-1 (Fbn-1) and spans a wide range of phenotypes.2 Sherratt et al.3 suggest that fibrillin microfibrils act as stiff reinforcing filaments in elastic tissues, possibly limiting extension of elastin,4 that protect elastic fibers from a fatigue-like damage; Fbn-1 is thus important to tissue homeostasis.5–7 In addition, recent studies5,6 show that these microfibrils are biologically active and play a role in regulating transforming growth factor– β (TGF-β), a key modulator of extracellular matrix integrity.
Mice homozygous for the mgR mutation produce normal Fbn-1 at levels one-fourth of normal7 and develop Marfan-like vascular abnormalities. These mice are born with apparently normal vascular elastic lamina, but develop obvious focal calcifications as early as 6 weeks.7 Further study showed breakdown of elastic lamina within the media as well as an increased synthetic phenotype among the smooth muscle cells (SMCs), infiltration of inflammatory cells, and increased matrix metalloproteinase (MMP) levels.8,9
Due to the devastating effects of aortic dilation and dissection, the aorta has been studied extensively in MFS. Ultrasound measurements by Jeremy et al.10 suggest that ascending aortas in MFS are substantially stiffer than those of age-matched controls. Similar results were found by Marque et al.11 in homozygous mgR mice. Using magnetic resonance imaging, Groenink et al.12 measured decreased distensibility both in the aortic arch and near the aortic bifurcation, as well as increased pulse wave velocities along the aorta, indicating that the entire vessel stiffens in MFS.
As Marfan patients live longer due to improved treatment, they will likely face many other vascular complications that affect the normal population, such as hypertension and atherosclerosis. It is imperative, therefore, to gather biomechanical data from the entire Marfan vasculature so that clinicians can predict the effects of vascular complications in Marfan patients and develop appropriate methods of treatment. Although the aortas in both human patients and animal models of MFS are stiffer than controls,10,11,13 there has been little research on other arteries. This paper compares the mechanical response of common carotid arteries from wild-type animals and mice heterozygous or homozygous for the mgR mutation, a commonly used mouse model of MFS.
MATERIALS AND METHODS
Animals and Surgery
A breeding pair of mice heterozygous for mgR, obtained from Dr. Francesco Ramirez, were used to produce mgR wild-type +/+ (WT), mgR heterozygous +/− (HET), and mgR homozygous −/− (KO) mice for study. Animals were cared for by the Texas A&M University Laboratory Animals Resources and Research (LARR) program. Common carotid arteries were harvested from male mice between the ages of 8 and 14 weeks. Surgical procedures, housing, and experimental protocols were approved by the University Laboratory Animal Care Committee (ULACC).
Mice were restrained by holding the tail with one hand and firmly grabbing the skin behind the neck (scruffing) with the index finger and thumb of the other hand. An intraperitoneal injection of sodium pentobarbital (125 mg/kg) was used as anesthesia and when the mouse was deeply under, an incision was made from the chest to the neck to expose the thoracic cavity and neck around the esophagus. Both carotid arteries were excised via incisions at the aortic arch and carotid bifurcation. Vessels were separated and cleaned of excess perivascular tissue. Carotids were placed in warm media, cannulated on 300 μm diameter custom-pulled glass pipettes, and secured using braided 6-0 silk suture.
Mechanical Testing
Cannulated vessels were mounted in a circulating adventitial bath contained within an isolated, temperature controlled chamber. The bath consisted of Dulbecco’s Modified Eagle’s Media, containing 2% heat inactivated fetal bovine serum, 2% L-glutamine, 1000 units/L penicillin, and 1000 g/L streptomycin. A steady flow of 95% air – 5% CO2 controlled media pH. A peristaltic pump separately provided adventitial and luminal flow of media, with lumen pressure controlled independently by regulating the air-CO2 pressure on the surface of a media reservoir. A side-mounted, calibrated CCD camera measured vessel diameter D, while precision stepper motors controlled the vessel’s length. A force transducer was connected to the distal cannula and measured the applied axial force, fT. Further detail on the biaxial testing device can be found in Gleason et al.14
Unloaded dimensions were measured interactively by identifying the length at which the vessel began to bend at zero pressure. Circumferential and axial stretches were calculated based on these dimensions. The vessel was stretched to its predetermined in vivo value (see below) and preconditioned through three cycles of pressurization from 0 to 140 mmHg to minimize hysteresis. The computer then performed a pre-programmed routine to achieve various axial stretch and pressure set-points. Wall volume remains nearly constant over short periods (i.e., without growth and remodeling), thus inner radius ri and wall thickness h were calculated from incompressibility via14–16
| (1,2) |
where V̄ is the mean wall volume, ℓ the current length, and ra the outer radius. Wall volume was estimated based on 12–15 measurements of inner and outer radius at multiple static pressures and lengths. Equation 1 thus allowed inner radius to be determined at any pressure and stretch based on known V̄ and ℓ and on-line measurements of outer radius via an edge detection algorithm in LabView.
Mechanical testing consisted of cycling pressures from 0 to 140 mmHg (KO) or 160 mmHg (WT and HET) twice at each of three fixed axial stretches , 1.75, 1.85 and , 1.65, 1.70. Next, the program tested the load-length response at each of three fixed pressures (P =60, 100, 140 or 160 mmHg) while the axial load was varied twice from 0 to 8.8 mN (0.9 g). The mechanical results at a fixed pressure of 140 mmHg were interpolated for WT and HET using a three-point interpolation from the 60, 100 and 160 mmHg tests. Based on pilot results, the KO set-points for stretch and peak pressures were set lower than the WT and HET to protect cells from possible damage due to overstretching. As a result, group-to-group comparisons were based on interpolations across a range of axial stretches with the only common stretch set-point at λz =1.65.
Following mechanical testing, we evaluated both endothelial and smooth muscle functionality. Phenylephrine (10−5 M) was added to the adventitial bath and the diameter was allowed to equilibrate for 15 (WT and HET) or 30 (KO) minutes to determine smooth muscle contractility. The knockout vessels were generally less responsive to phenylephrine, possibly due to alterations in cell phenotype as described in Bunton et al.8 For WT and HET groups, 30 percent contraction was considered functional. Next carbamycholine chloride (10−5 M) was added to test for endothelial-dependent smooth muscle relaxation and the vessel was allowed to equilibrate for 15 minutes. A 10% relaxation was considered functional for all groups. Sodium nitroprusside (10−4 M), which tests endothelial-independent relaxation, was then added to the bath and the vessel allowed to equilibrate for 15 minutes. Finally, the media was replaced with Hank’s Balanced Salt Solution (HBSS) without calcium and magnesium but containing sodium nitroprusside (10−5 M) and EGTA (2×10⁻³ M) to ensure full smooth muscle relaxation. Mechanical testing described above was repeated for the passive state.
Data Analysis
Stress is an important measure in arterial biomechanics because it correlates well with many aspects of growth and remodeling.17,18 Mean circumferential and axial wall stresses were estimated by16,19,20
| (3,4) |
where P is the transmural pressure, fT the axial force measured by the transducer, and ra, ri the inner and outer radii, respectively. Stretch ratios were calculated at the mid-wall where rmid = (ra + ri)/2. The basal (b) or passive (p) circumferential , axial , and radial stretches were calculated from unloaded basal and loaded basal and passive states via
| (5,6,7) |
where ρ and L are radii and axial length in the unloaded basal configuration, respectively.
Note that the unloaded basal configuration can be mapped mathematically into either a loaded basal or a loaded passive configuration through the deformation gradients Fb and Fp (Fig. 1). We referred the passive loaded configuration to the basal unloaded configuration instead of the passive unloaded configuration simply to facilitate comparisons of data. Of course, a stress free configuration (R, Θ, Z) could also be used as a reference, but this is only needed for 3-D stress analyses and would require a stress relieving radial cut that causes the vessel to spring open.21 Such a “stress-free” state still has residual stresses, due to elastin in tension22,23 and collagen in compression, which could in turn be reduced using elastase or collagenase. Because residual stresses tend to yield homogeneous transmural distributions of stress, which thus render mean values (equations 3,4) as good estimates of wall stress, and because we did not attempt to quantify smooth muscle phenotype as a function of radius across the wall, the unloaded basal state was used as a reference herein.
Figure 1.
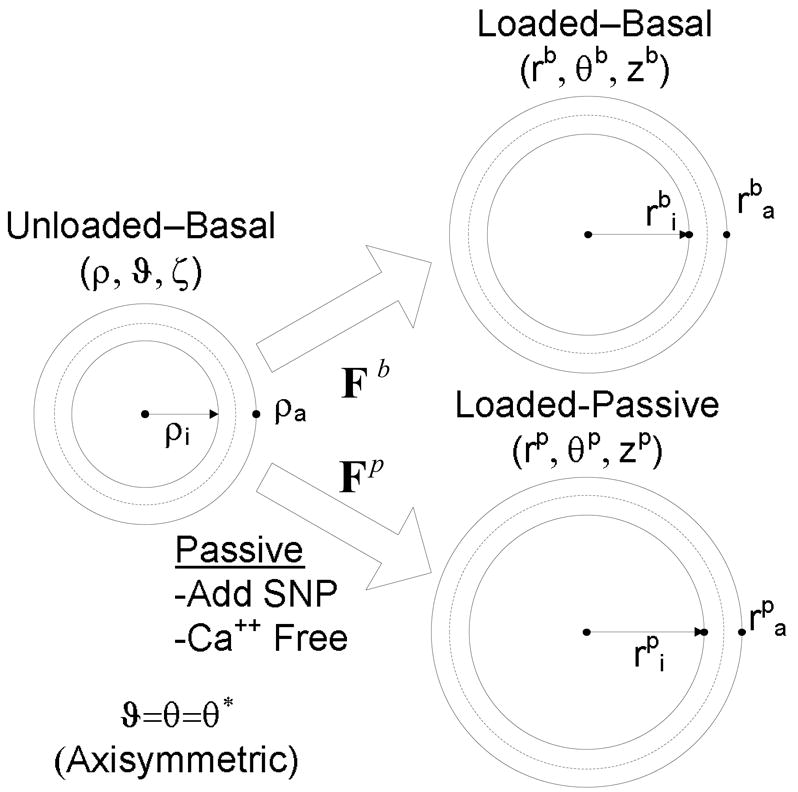
Unloaded and loaded basal configurations and loaded passive configurations. For convenience, all loaded configurations were referred back to the unloaded basal configuration to quantify deformations during biaxial testing.
Four-Fiber Family Model
Constitutive modeling can be used to describe and predict the stress response of tissue. A 2-D representation of Cauchy stress in the circumferential and axial directions is24
| (8,9) |
where σr ≪ σθ and σr ≪ σθ and W is the strain energy function. We employed a structurally motivated strain energy function that incorporates the isotropic contributions of the elastin-dominated amorphous matrix and anisotropic contributions of families of oriented collagen fibers (and possibly passive smooth muscle). Specifically, consider a four-fiber family model of the form25
| (10) |
where c, and are material parameters found through nonlinear regression and k represents a fiber family. I1is the first principal invariant of the right Cauchy-Green tensor such that . λk is the stretch of the kth fiber family represented by
| (11) |
where is the angle of the kth fiber family with respect to the axial direction of the blood vessel in the reference configuration. Fiber angle can be determined either via nonlinear regression of the mechanical data or via nonlinear optical microscopy (NLOM) to measure mean fiber angles directly.
To find the unknown parameters, constrained multidimensional nonlinear minimization (simplex method) was performed on the biaxial stress data for the WT, HET, and KO carotid vessels. An objective function was used that minimizes the error,16,25
| (12) |
where N is the number of data points within each set. The experimental (exp) stress represents the mean wall stress in the circumferential and axial directions defined by equations 3–4 whereas the model (mod) stress is determined by equations 8 to 11.
Statistical analysis
A one-way ANOVA using the built-in MATLAB function ANOVA1 was employed to assess statistical differences between the three genotypes in each of the tests. Pressure, axial force, or stress was considered the independent variable and differences between the dependent variables were calculated. A value of p< 0.05 was considered significant. Multiple linear regression analysis using the built in MATLAB function REGRESS was used to identify any relationship between a mouse’s weight or age and the dependent variables for each data point.
RESULTS
Pressure and Force
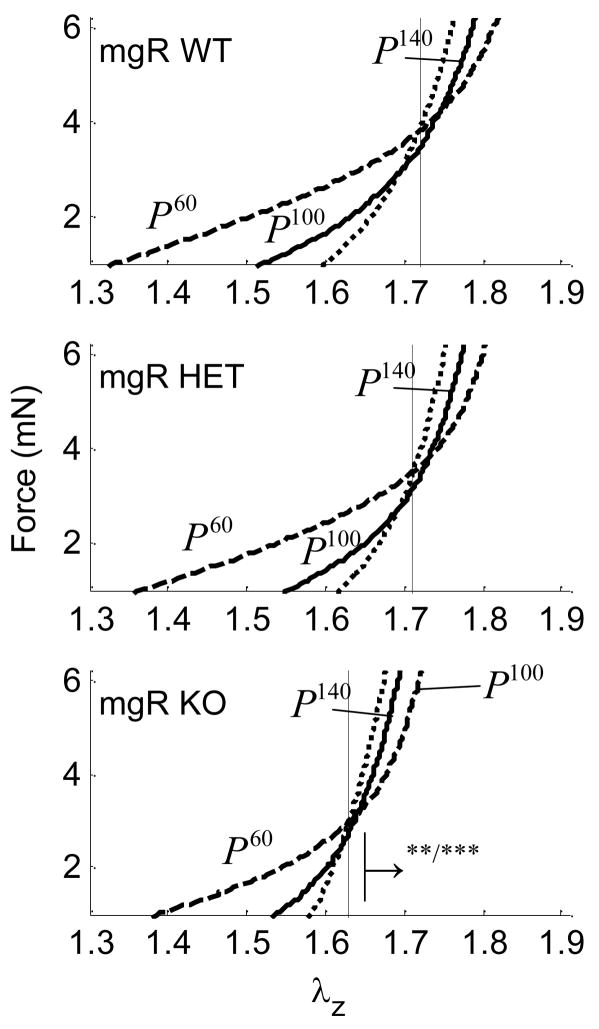
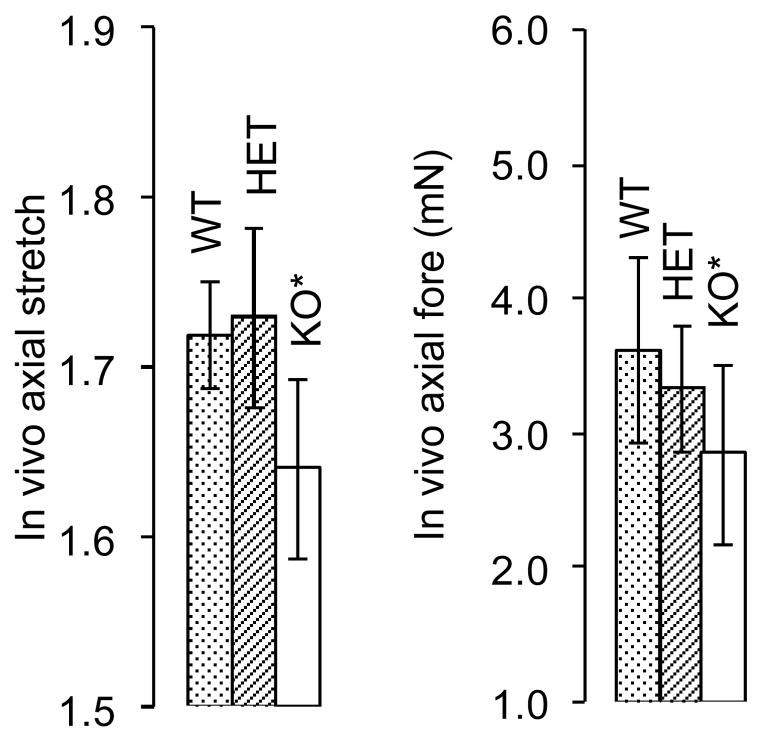
Intersections of axial force-stretch curves at different fixed pressures estimate the in vivo axial stretch.16,26–30 This stretch may help to optimize the vessel against buckling during normal movement and is a crucial measure used to compare vessels in vitro.29 Averaged, basal, in vivo axial stretches for WT, HET, and KO mice were , 1.72 and 1.63, respectively (Fig. 2, a–c and Fig. 12, a), and passive axial stretches were similarly , 1.73 and 1.64 (i.e., there was no statistical difference between basal and passive values). Note, however, that the in vivo axial stretch for KO was significantly less that that for both WT and HET. Basal values of the associated in vivo force for WT, HET, and KO mice were fT =3.63, 3.34 and 2.85 (mN), respectively (Fig. 2, a–c and Fig. 12, b), and mean, passive axial forces were , 3.67 and 2.40 (mN). Again, the in vivo value for the KO was statistically different from WT and HET, which were not statistically different from one another.
Figure 2.
Averaged axial force-stretch data at with basal smooth muscle tone at fixed pressures of 60, 100, and 140 for Wild-type (WT), Heterozygous (HET), and Knockout (KO). Note that cross over points/intersections estimate the in vivo axial stretch (vertical lines). The → indicates the direction of statistical significance for the KO from the WT mouse at (**) P=100 or (***) P=140 mmHg.
Figure 12.
Passive in vivo axial stretch a) for Wild-type (WT; 1.72), Heterozygous (HET; 1.73), and Knockout (KO; 1.64) and similarly for force b) Wild-type (WT; 3.63 mN), Heterozygous (HET; 3.34 mN), and Knockout (KO; 2.85 mN) mouse types. (*) indicates that there is statistical significance between the basal and passive condition.
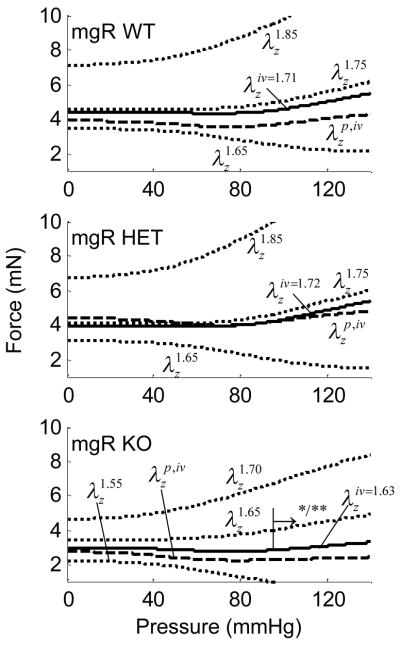
Averaged axial force-pressure data (Fig. 3, a–c) show that the in vivo estimation for the WT and HET carotids yielded a relatively flat relation at as expected.28 These data indicate that WT and HET mice can be considered mechanically similar in the axial direction (Figure 12a,b). That the magnitude of the in vivo axial force was lower for the KO (2.4 mN) compared to both WT and HET vessels (~3.5 mN) is also seen easily in Figure 3. Axial force, however, was not significantly influenced by smooth muscle contractility because the cells are oriented primarily in the circumferential direction.
Figure 3.
Averaged axial force-pressure results at fixed axial stretches including basal and passive conditions. Also shown are interpolated data at the in vivo axial stretch for the Wild-type (WT), Heterozygous (HET), and Knockout (KO). The → indicates the direction of statistical difference for the KO relative to WT at (*) and (**) .
Pressure and Diameter
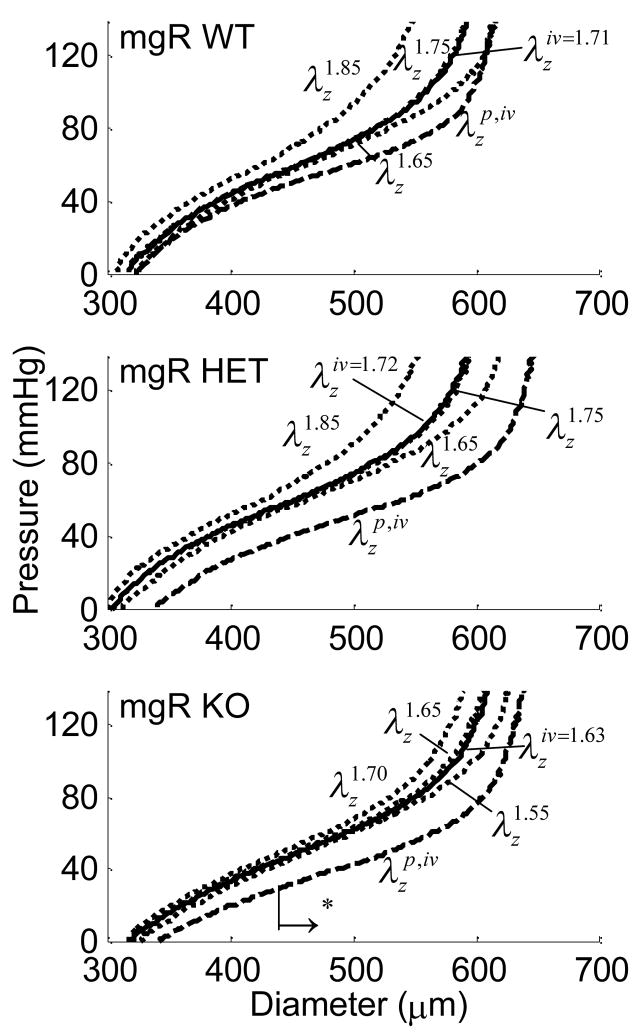
Cyclic testing at a common axial stretch of 1.65 allowed direct numerical comparison amongst all three genotypes. Further testing was performed at stretches above and below the in vivo ( ) stretch, with the behavior interpolated at (not known a priori). All fixed pressure and axial stretch testing was performed with basal and then passive smooth muscle tone. Figure 4 shows characteristic changes in diameter as the pressure increased. The KO vessel appeared to be slightly dilated; statistical analysis only revealed differences, however, between the WT/HET and KO groups for pressures over 40 mmHg in the passive state. For example, the slope of the pressure-diameter data for the passive KO vessel in this pressure range was steeper than that for the passive WT and HET groups, thus indicating a circumferentially stiffer structure.
Figure 4.
Averaged pressure-diameter results at fixed axial stretches including basal and passive conditions, with those at the in vivo axial stretch interpolated from the other data for the Wild-type (WT), Heterozygous (HET), and Knockout (KO). The → indicates the direction of statistical significance for the KO from the WT mouse at (*) in the passive state.
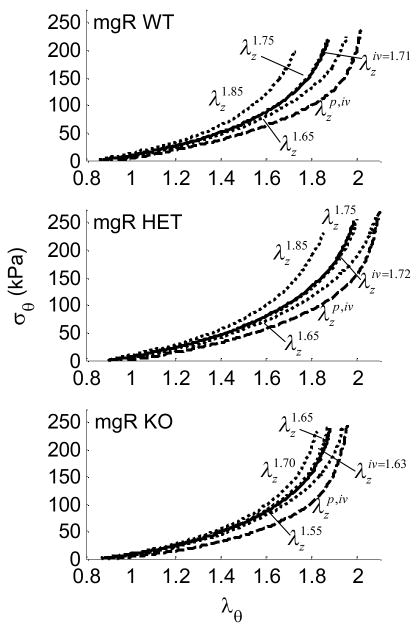
Stress
Altered states of stress may be initiators or indicators of disease. Although differences between groups did not reach statistical significance for the circumferential direction, the stress-stretch curves for the HET carotids were shifted slightly to the right (less stiff) compared to those for the WT. This may have been due to an altered compensatory mechanism not available in the KO carotids. As expected, smooth muscle relaxation resulted in vessel dilatation at any given pressure causing distinct shifts in pressure - diameter (Fig. 4, a–c) and σθ − λθ plots (Fig. 5, a–c) relative to basal responses.
Figure 5.
Averaged circumferential stress-stretch results at fixed axial stretches including basal and passive conditions, plus interpolated results for the in vivo axial stretch in the Wild-type (WT), Heterozygous (HET), and Knockout (KO) mice.
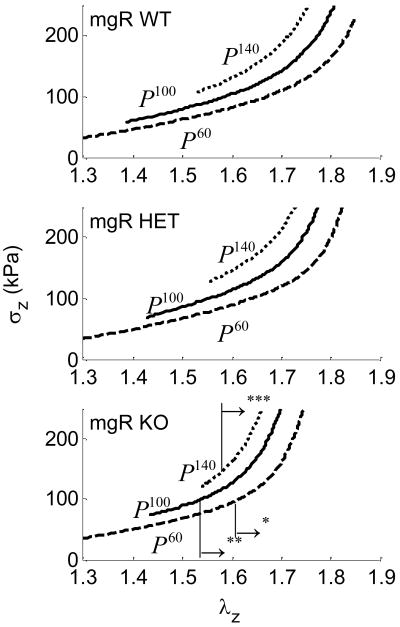
Carotids from WT and HET mice exhibited similar axial stress responses (Fig. 6, a–c). Figure 6, a,b shows the axial stress as a WT and HET were stretched axially at fixed pressures of 60, 100, and 140 mmHg. Figure 6, c shows the axial stress for KO vessels at 60 and 100, and 140 mmHg indicating that the KO vessel experienced greater values of axial stress for similar axial stretches.
Figure 6.
Averaged axial stress-stretch results for basal smooth muscle tone at fixed pressures of 60, 100 and 140 mmHg for Wild-type (WT), Heterozygous (HET), and Knockout (KO). The → indicates the direction of statistical difference for the KO from the WT mouse at (*) P=60, (**) P=100, or (***) P=140 mmHg.
A representative dose response curve for one vessel with all of the vasoreactants is shown in Figure 7. Phenylephrine (10−5 M) was added to the adventitial bath at point (a) to test for smooth muscle contractility and point (b) represents the vessel in its “maximum” contractile state. Carbamycholine chloride (10−5 M) was added at point (b) to test for endothelial-dependent smooth muscle relaxation. As nitric oxide (NO) was depleted, the diameter returned to its contractile status: points (c)–(d). Sodium nitroprusside (10−4 M) was then added to the bath to elicit endothelial-independent smooth muscle relaxation at point (d). The media was replaced with Hank’s Balanced Salt Solution (HBSS) without calcium or magnesium but containing sodium nitroprusside (10−5 M) and EGTA (2×10⁻³ M) to ensure full smooth muscle relaxation by depleting intracellular and extracellular stores of calcium at point (e). The gap in diameter data between points (e) and (f) occurred during the exchanging of media for HBSS.
Figure 7.
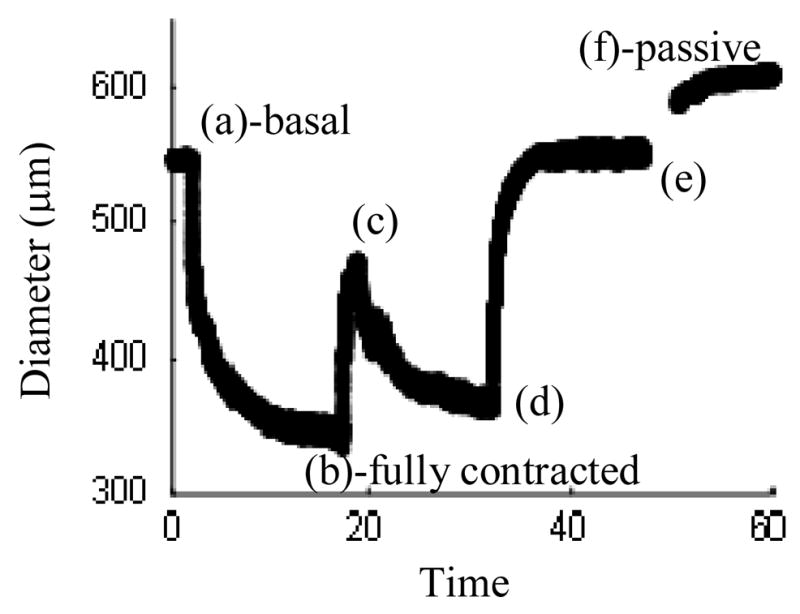
Representative diameter dose-response for the addition of (a) Phenylephrine at 10−5 M, (b) Carbamycholine chloride at 10−5 M, (d) Sodium nitroprusside at 10−4 M, and (e) Hank’s Balanced Salt Solution (HBSS) containing sodium nitroprusside (10−5 M) and EGTA (2×10⁻³ M), with maximally contracted and fully passive states at (b) and (f).
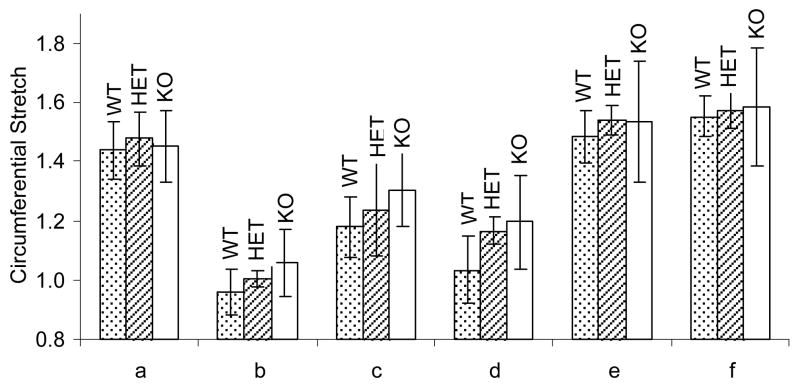
Mean values of distension for each mouse type (WT, HET and KO) at each smooth muscle cell function reference point (a)–(f) can been seen in Figure 8. By comparing the fully passive state (f) to the basal one (a), one observes that the “basal” state of all vessels had very little smooth muscle tone. KO vessel circumferential stretch changed less than WT and HET for all levels of smooth muscle activation.
Figure 8.
Average circumferential stretch values for the addition of (a) Phenylephrine at 10−5 M, (b) Carbamycholine chloride at 10−5 M, (d) Sodium nitroprusside at 10−4 M, and (e) Hank’s Balanced Salt Solution (HBSS) containing sodium nitroprusside (10−5 M) and EGTA (2×10⁻³ M), with maximally contracted and fully passive states at (b) and (f).) for Wild-type (WT), Heterozygous (HET) and Knockout (KO) vessels
Four-Fiber Family Model
The unknown parameters in the four-fiber family strain energy function (Equations 10–11) were determined via minimization of the objective (error) function described by equation (12) for each vessel in the passive state. Fiber families 1 and 2 are considered to be primarily axial with deg and circumferential with deg. Furthermore, for the diagonal families was represented by one angle αo. Results of the parameter estimation for the WT, HET and KO can be seen in Supplemental Table 1. Illustrative fitted results with experimental data for one mouse in each data set is shown in Figure 9.
Figure 9.
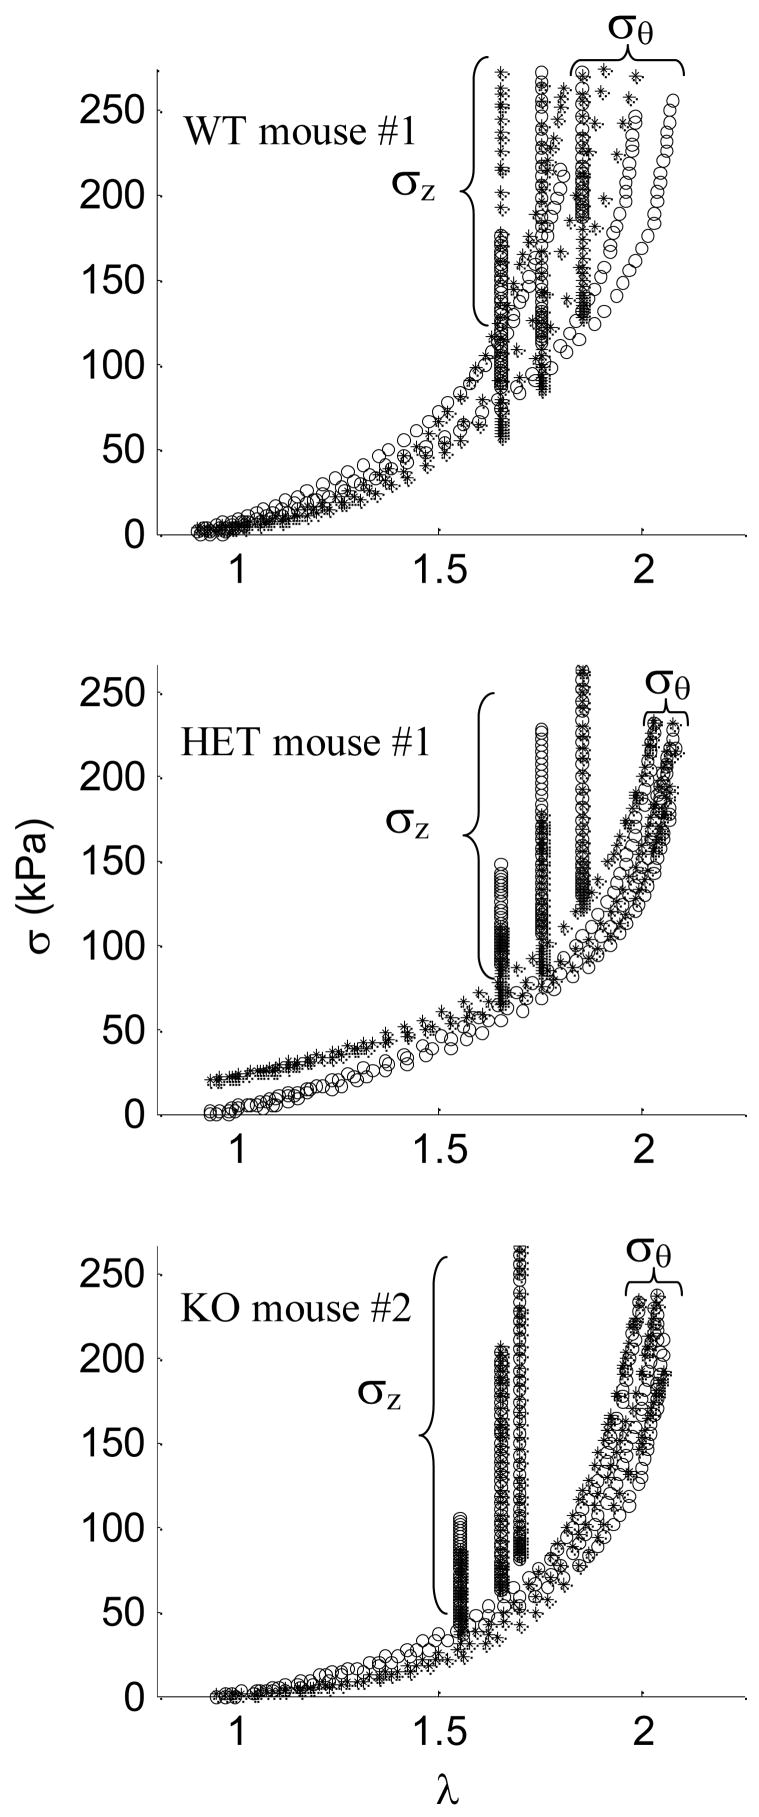
Constitutive fits (*) for experimental data (○) at three axial stretches for a) Wild-type (WT) mouse #1 with c = 2.081 kPa,, , αo = 27.58 deg., b) Heterozygous (HET) mouse #1 with c = 20.656 kPa, and αo = 32.00 deg., and c) Knockout (KO) mouse #2 with c = 0.234 kPa, and αo = 30.86 deg.
DISCUSSION
We characterized, for the first time, the biaxial mechanical behaviors of common carotid arteries in homozygous (knockout, KO) and heterozygous (HET) mouse models of reduced, extracellular matrix protein Fibrillin-1 (Fbn-1) and compared the results to otherwise normal wild-type (WT) mice. Our results revealed that carotids from 9.5 week old mice homozygous for the mgR mutation, which reduces fibrillin-1 content ~25%, exhibited altered mechanical properties while those from heterozygous mice were similar to their wild-type controls. Differences were primarily in the axial direction where the in vivo axial stretch was lower and axial stresses were higher in KO than HET and WT for a common value of axial stretch (Figure 12). When vessels were normalized to their individual in vivo stretches, however, both axial force and axial stress were lower in KO vessels than in HET and WT, perhaps suggesting a slight overcompensation. KO vessels showed only slight increases in circumferential stiffness and diameter in the passive state without the degree of dilation found in studies of the aorta.
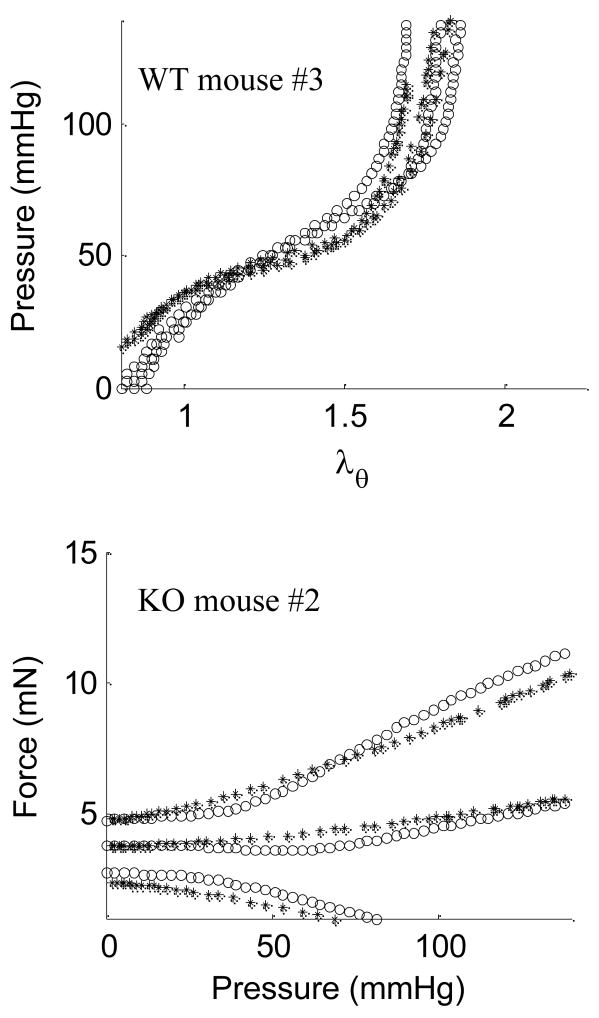
The parameter estimation and fitting of data (Figure 9) demonstrated the utility of a four-fiber family constitutive model to describe mean stresses at three axial stretches for WT, HET, and KO carotids. Minimal hysteresis was exhibited during loading and unloading cycles at 0.01 Hz (data not shown), further justifying the use of an elastic model. We found, however, that the model had difficulty predicting stress when prescribed axial stretches yielded wide variations in σθ − λθ. Whereas minimization of the objective function e (equation 12) was based directly on stress, other mechanical quantities can be calculated using the constitutive model and best-fit parameters. For example, Figure 10 shows predicted versus measured results for pressure-distension for WT mouse #3 and force-pressure for KO mouse #7. Although reasonable, these predictions reflected varying degrees of goodness since they are secondary calculations with additional free variables.
Figure 10.
Estimated (*) and experimental (○) a) diameter vs. pressure for passive Wild-type (WT) mouse #3 with c = 24.292 kPa,, , αo = 39.98 deg., or b) force vs. pressure for passive Knockout (KO) mouse #2 with c= 0.234 kPa, and α= 30.86 deg.
In the parameter estimations, the angle αo for the families of diagonal fibers was left free to vary within the model to help minimize the objective function. Such fiber angles may change with vessel remodeling and disease and can be measured directly, however. One way to compare such modeling results to actual fiber angles is to use nonlinear optical microscopy (NLOM) 31 to visualize intramural collagen (via 2nd harmonic generation) throughout the wall (Figure 11). Fiber direction was quantified using NLOM and a mean fiber angle αexp (in the current configuration) was determined at each 0.5 μm increment. Taking geometry and deformation into consideration, mean fiber angles in the reference configuration were calculated using
Figure 11.

Nonlinear optical microscopic image of a representative vessel with fibrillar collagen illuminated using 2nd harmonic generation. a) Wild-type, b) Heterozygous (HET), and c) Knockout (KO) vessels. Due to out-of-plane imaging, the left side of the HET and KO images show part of the lumen.
| (13) |
where is the fiber angle in the unloaded state similar to estimated values. For one additional specimen for each genotype, mean fiber angles in the unloaded state were found via NLOM to be deg, deg, and deg for three fixed axial extensions and a pressure of 100 mmHg. These values were prescribed in the four-fiber family constitutive model for that data set having the closest fiber angle found through parameter estimation, and best-fit parameters were determined again. The resulting error was slightly higher when fiber angle was fixed (see Supplemental Table 1) for WT test #2a, HET test #5a and KO test #6a, but otherwise similar thus suggesting the utility of prescribing the mean angle based directly on data when available.
Fibrillin-1 is one of many micro-fibrils involved in supporting elastin,32–34 but its precise role in the vasculature remains unknown. These micro-fibrils may help transfer load to and orient the elastic fibers along the direction of stress.35 Others suggest that Fbn-1 may act as a protective sheath that prevents elastin from over-extending.3,4 Fbn-1 is also known to down-regulate TGF-β,5,6 a growth factor frequently found with higher expression at sites of aortic aneurysms. Chung et al.9 studied the thoracic aorta in Fbn-1 deficient mice with and without aneurysm and found further that MMP production was upregulated in those with aneurysms. They suggest that Fbn-1 fragments may stimulate MMP production, thus causing a vicious cycle that leads to aneurysm. Smooth muscle cells are both the sensor and effector of remodeling and are improperly linked to the extracellular matrix in models of MFS.36 Cellular remodeling of matrix (e.g., via production, removal, and reorientation of collagen) may thus be compromised in MFS. Our data showed that smooth muscle contractility was affected only slightly by partial removal of extracellular matrix protein Fbn-1 (Figure 8), possibly due to an increased synthetic phenotype as noted by Bunton.8
It is possible that changes in the in vivo axial stretch implicate a compensatory mechanism available during development (cf. Figure 2). Some suggest however, that Fbn-1 has a maintenance role for existing elastic fibers rather than being involved in early assembly.7 Fbn-1 deficient mice are similar to wild-type mice at birth, but gradually develop defects. Marque et al.11 showed that a reduction in Fbn-1 causes an accelerated, aged-related fragmentation of elastin, rather than affecting elastognesis. If there is an adaptation during development, it may compensate for the reduced Fbn-1 (e.g., by up-regulating other micro-fibrils) rather than for poorly cross-linked elastin. There is clearly a need for further study.
The biomechanical properties of Fbn-1 deficient carotid arteries resembled those of normally aged vessels wherein elastin has a reduced mass fraction,20,37 noting that associated decreases in overall arterial elasticity may render individuals at higher risk for aneurysm.38 An analogy can thus be made to the findings of Pezet et al.39 who showed that aortas from mice with heterozygous mutations in the elastin gene ELN (6 months) exhibit some characteristics similar to those of aged (24 months) wild-type mice. Specifically, decreased elastin results in reduced elasticity, vessel lengthening, extracellular matrix accumulation, and decreased endothelial derived vasomotor response in addition to systemic hypertension. Elastin is highly stable and deposited primarily during development despite continued demand from perturbations in stress. Aged vessels experience a decreased in vivo axial stretch40 and often become stiffer and tortuous22,23 resulting from vessel lengthening and extracellular matrix accumulation. Age did not have consistent correlation with any mechanical parameters but might be significant for the KO mouse (Age SD=0.91) at ages beyond the scope of our test (10 wks for KO) as disease characteristics are known to intensify. Further, weight correlated only with diameter, force and thickness, not stress.
The literature shows that aortas from MFS patients have reduced distensibility.10,13,41 Although both the carotid artery and the aorta are classified as elastic, Jondeau et al.41 found that carotid artery diameters were not different in human MFS patients compared to normal samples at either diastole or systole. Our results similarly show that changes in basal diameter from diastole to systole in mouse carotids (Table 2) held at an in vivo axial stretch are comparable to the WT and KO. Some feel that vessel failure in MFS may result from cyclic fatigue.10,41 Marque et al.11 reported WT and KO blood pressures to be 124/91 and 131/88 respectively, at similar heart rates. Circumferential stresses across these blood pressures range from 117 to 188 kPa for the WT mouse and 127 to 222 for the KO, demonstrating that KO vessels experience a greater increase in stress throughout the cardiac cycle. Cyclic loading may be important to age related fragmentation of elastin. Furthermore, the ratio of circumferential stress to axial stress at in vivo axial stretch at diastole was greater for the KO than the WT or HET but not at systole (Table 2). It is not known how such ratios might play a role although Jackson et al.36 showed that cells can distinguish between loadings in two different directions resulting in independent oriented remodeling.
Table 2.
Mechanical parameters across the cardiac cycle for carotid arteries of mgR WT, HET and KO mice.
| WT | KO | |
|---|---|---|
| Blood Pressure (mmHg)† | 124/91 | 131/88 |
| Mean Wall Thickness (μm) | 24.8 | 23.2 |
| Outer Diameter (μm) Systole/Diastole | 584/544 | 607/567 |
| Circ. Wall Stress (kPa) Systole/Diastole | 188/117 | 222/127 |
| Axial Wall Stress (kPa) Systole/Diastole | 220/168 | 197/137 |
| Mean Circ. To Axial Wall stress Ratio | 0.86/0.97 | 1.13/0.93 |
Blood pressures from Marque et al.11
Average best-fit values for the isotropic stress parameter (c) were 8 to 9 times greater for the WT and HET mice than the KO (Supplemental Table 1). The elastin-dominated amorphous matrix has a nearly isotropic response, thus the KO vessel probably had decreased elastin effectiveness. Mathematically, however, some of the isotropic response could be accommodated by increasing the value of the parameters of fiber families (1) and (2), which are controlled primarily by collagen accumulating and orientating to optimize stress. The reduction of in vivo axial stretch could be the byproduct of a decrease in axially oriented elastin fibers as a result of fragmentation. The elastic recoil of arteries upon excision indicates an axial tension in vivo, but the associated unloaded state has residual stresses. Zeller and Skalak,23 showed by applying elastase and collagenase to otherwise unloaded cross sections of rat saphenous arteries and observing the change in opening angle and circumference, that elastin is in tension in the circumferential direction in unloaded segments. The same is expected for the axial direction where elastin provides a retraction force that is equilibrated by compressing other constituents in the unloaded state,40 primarily GAG-sequestered water and smooth muscle, bound by collagen fibers. If the elastin is fragmented, the retraction force could decrease and the vessel elongate. When the vessel is excised the decreased force would limit the degree of retraction and show a vessel with a decreased axial prestrech compared to healthy vessels as observed herein.
Current treatments of MFS symptoms seek primarily to prevent dilation and dissection.1,6 Hence, β-blocker therapy and limiting exhaustive exercise are used for their negative chronotropic and inotropic effects. These therapeutic methods reduce the hemodynamic stress on the aortic wall in an attempt to avoid an initial insult that may lead to aneurysm. Most elastic arteries experience only minimal cyclic axial extensions from the rhythmic pulsations of the heart with the exceptions of the pulmonary artery and ascending aorta due to their close proximity to the heart, yet all elastic vessels experience marked cyclic changes in diameter as a result of the variations in blood pressure and flow throughout the cardiac cycle. Aortic dissection occurs frequently in the ascending aorta, which could be due to the unusual cyclic changes in length (axial stress) known to occur here. Hence, cyclic loading may be important to MFS arterial stability. β-blocker therapy and reduced exhaustive exercise may also limit the axial stresses experienced by the ascending aorta. Coincidentally, during early stages of in vitro testing we observed dissecting carotid aneurysms following acute overstretching in the axial direction (data not shown). Recently, TGF-β neutralizing antibodies and the angiotension II receptor antagonist, Losartan, have demonstrated promising results for preventing aneurysms in a different mouse model for Marfan Syndrome9 (Fbn1C1039FG/+)by reducing TGF-β (a growth factor known to be involved in developing aneurysms in MFS). Angiotension II receptor antagonists also reduce hemodynamic stress by decreasing blood pressure, but its action as a vasodilator complicates its utility if used in adulthood.
By examining vessels in vitro, our findings illustrate the importance of axial extension in studying effects of MFS on arteries. In vivo determination using MRI, ultrasound, or catheter mounted pressure transducers to infer arterial stiffness by pulse wave velocity cannot reveal axial changes in stiffness, and thus only approximates overall macroscopic characteristics. The structural integrity of Fbn-1 deficient arteries is sensitive to perturbations in axial extension and may contribute to the fatal consequence of this disease, dissecting aneurysm. The carotid arteries of KO mice show a greater stress for comparable axial stretches. These findings could be a result of changes in the unloaded configuration, which can evolve in the diseased state. This disease model is further evidence that the mechanisms of growth and remodeling are three-dimensional and precise tracking of axial changes must eventually be identified.
Supplementary Material
Table 1.
Summary of tests on mgR WT, HET, and KO mice with (n) given separately for basal, passive data.
| Genotype (mgR) | Group Size (n) | Avg. Weight (g) | Mean Age (wks) | |
|---|---|---|---|---|
| Fixed Press. | WT (+/+) | 8, 7 | 23.83 | 11.5 |
| HET (+/−) | 8, 6 | 23.57 | 11.1 | |
| KO (−/−) | 7, 9 | 20.60 | 9.5 | |
| Fixed Stretch | WT (+/+) | 7, 7 | 23.25 | 12.1 |
| HET (+/−) | 6, 6 | 24.24 | 12.0 | |
| KO (−/−) | 7, 9 | 20.59 | 9.7 | |
Acknowledgments
This work was supported, in part, by grants from the NIH (HL-64372, EB-004106). We also thank Professor F. Ramirez, UMDNJ-Robert Wood Johnson Medical School for supplying breeding pairs for the fibrillin-1 deficient mice and for the technical assistance of K. Miller and R. Gleason. Finally Q. Wu and Prof. A.T. Yeh provided the NLOM images reported herein.
References
- 1.Milewicz DM, Dietz HC, Miller DC. Treatment of aortic disease in patients with Marfan syndrome. Circulation. 2005;111:e150–7. doi: 10.1161/01.CIR.0000155243.70456.F4. [DOI] [PubMed] [Google Scholar]
- 2.Pyeritz R. The Marfan syndrome. Annu Rev Med. 2000;51:481–510. doi: 10.1146/annurev.med.51.1.481. [DOI] [PubMed] [Google Scholar]
- 3.Sherratt MJ, Baldock C, Haston JL, Holmes DF, Jones CJ, Shuttleworth CA, Wess TJ, Kielty CM. Fibrillin microfibrils are stiff reinforcing fibres in compliant tissues. J Mol Biol. 2003;332:183–93. doi: 10.1016/s0022-2836(03)00829-5. [DOI] [PubMed] [Google Scholar]
- 4.Carton RW, Dainauskas J, Clark JW. Elastic properties of single elastic fibers. J Appl Physiol. 1962;17:547–551. doi: 10.1152/jappl.1962.17.3.547. [DOI] [PubMed] [Google Scholar]
- 5.Neptune ER, Frischmeyer PA, Arking DE, Myers L, Bunton TE, Gayraud B, Ramirez F, Sakai LY, Dietz HC. Dysregulation of TGF-β activation contributes to pathogenesis in Marfan syndrome. Nat Genet. 2003;33:407–411. doi: 10.1038/ng1116. [DOI] [PubMed] [Google Scholar]
- 6.Habashi JP, Judge DP, Holm TM, Cohn RD, Loeys BL, Cooper TK, Myers L, Klein EC, Liu G, Calvi C, Podowski M, Neptune ER, Halushka MK, Bedja D, Gabrielson K, Rifkin DB, Carta L, Ramirez F, Huso DL, Dietz HC. Losartan, an AT1 antagonist, prevents aortic aneurysm in a mouse model of Marfan syndrome. Science. 2006;312:117–121. doi: 10.1126/science.1124287. [DOI] [PMC free article] [PubMed] [Google Scholar]
- 7.Pereira L, Lee SY, Gayraud B, Andrikopoulos K, Shapiro SD, Bunton T, Biery NJ, Dietz HC, Sakai LY, Ramirez F. Pathogenetic sequence for aneurysm revealed in mice underexpressing fibrillin-1. Proc Natl Acad Sci U S A. 1999;96:3819–3823. doi: 10.1073/pnas.96.7.3819. [DOI] [PMC free article] [PubMed] [Google Scholar]
- 8.Bunton TE, Biery NJ, Myers L, Gayraud B, Ramirez F, Dietz HC. Phenotypic alteration of vascular smooth muscle cells precedes elastolysis in a mouse model of Marfan syndrome. Circ Res. 2001;88:37–43. doi: 10.1161/01.res.88.1.37. [DOI] [PubMed] [Google Scholar]
- 9.Chung AW, Au Yeung K, Sandor GG, Judge DP, Dietz HC, van Breemen C. Loss of Elastic Fiber Integrity and Reduction of Vascular Smooth Muscle Contraction Resulting From the Upregulated Activities of Matrix Metalloproteinase-2 and -9 in the Thoracic Aortic Aneurysm in Marfan Syndrome. Circ Res. 2007 doi: 10.1161/CIRCRESAHA.107.157776. [DOI] [PubMed] [Google Scholar]
- 10.Jeremy RW, Huang H, Hwa J, McCarron H, Hughes CF, Richards JG. Relation between age, arterial distensibility, and aortic dilatation in the Marfan syndrome. Am J Cardiol. 1994;74:369–373. doi: 10.1016/0002-9149(94)90405-7. [DOI] [PubMed] [Google Scholar]
- 11.Marque V, Kieffer P, Gayraud B, Lartaud-Idjouadiene I, Ramirez F, Atkinson J. Aortic wall mechanics and composition in a transgenic mouse model of Marfan syndrome. Arterioscler Thromb Vasc Biol. 2001;21:1184–1189. doi: 10.1161/hq0701.092136. [DOI] [PubMed] [Google Scholar]
- 12.Groenink M, de Roos A, Mulder BJ, Verbeeten BJ, Timmermans J, Zwinderman AH, Spaan JA, van der Wall EE. Biophysical properties of the normal-sized aorta in patients with Marfan syndrome: evaluation with MR flow mapping. Radiology. 2001;219:535–540. doi: 10.1148/radiology.219.2.r01ma01535. [DOI] [PubMed] [Google Scholar]
- 13.Groenink M, de Roos A, Mulder BJ, Spaan JA, van der Wall EE. Changes in aortic distensibility and pulse wave velocity assessed with magnetic resonance imaging following beta-blocker therapy in the Marfan syndrome. Am J Cardiol. 1998;82:203–8. doi: 10.1016/s0002-9149(98)00315-4. [DOI] [PubMed] [Google Scholar]
- 14.Gleason RL, Gray SP, Wilson E, Humphrey JD. A multiaxial computer-controlled organ culture and biomechanical device for mouse carotid arteries. J Biomech Eng. 2004;126:787–795. doi: 10.1115/1.1824130. [DOI] [PubMed] [Google Scholar]
- 15.Gleason RL, Humphrey JD. Effects of a sustained extension on arterial growth and remodeling: a theoretical study. J Biomech. 2005;38:1255–61. doi: 10.1016/j.jbiomech.2004.06.017. [DOI] [PubMed] [Google Scholar]
- 16.Humphrey JD. Cardiovascular Solid Mechanics: Cells, Tissues, and Organs. New York: Springer; 2002. [Google Scholar]
- 17.Humphrey JD, Rajagopal KR. A constrained mixture model for arterial adaptations to a sustained step change in blood flow. Biomech Model Mechanobiol. 2003;2:109–26. doi: 10.1007/s10237-003-0033-4. [DOI] [PubMed] [Google Scholar]
- 18.Baek S, Rajagopal KR, Humphrey JD. A theoretical model of enlarging intracranial fusiform aneurysms. J Biomech Eng. 2006;128:142–9. doi: 10.1115/1.2132374. [DOI] [PubMed] [Google Scholar]
- 19.Gleason RL, Wilson E, Humphrey JD. Biaxial biomechanical adaptations of mouse carotid arteries cultured at altered axial extension. J Biomech. 2007;40:766–776. doi: 10.1016/j.jbiomech.2006.03.018. [DOI] [PubMed] [Google Scholar]
- 20.Gleason RL, Humphrey JD. A 2D constrained mixture model for arterial adaptations to large changes in flow, pressure and axial stretch. Math Med Biol. 2005;22:347–69. doi: 10.1093/imammb/dqi014. [DOI] [PubMed] [Google Scholar]
- 21.Chuong CJ, Fung YC. On residual stresses in arteries. J Biomech Eng. 1986;108:189–92. doi: 10.1115/1.3138600. [DOI] [PubMed] [Google Scholar]
- 22.Davis EC. Elastic lamina growth in the developing mouse aorta. J Histochem Cytochem. 1995;43:1115–23. doi: 10.1177/43.11.7560894. [DOI] [PubMed] [Google Scholar]
- 23.Zeller PJ, Skalak TC. Contribution of individual structural components in determining the zero-stress state in small arteries. J Vasc Res. 1998;35:8–17. doi: 10.1159/000025560. [DOI] [PubMed] [Google Scholar]
- 24.Gleason RL, Taber LA, Humphrey JD. A 2-D model of flow-induced alterations in the geometry, structure, and properties of carotid arteries. J Biomech Eng. 2004;126:371–81. doi: 10.1115/1.1762899. [DOI] [PubMed] [Google Scholar]
- 25.Hu JJ, Baek S, Humphrey JD. Stress-strain behavior of the passive basilar artery in normotension and hypertension. J Biomech. 2007;40:2559–63. doi: 10.1016/j.jbiomech.2006.11.007. [DOI] [PubMed] [Google Scholar]
- 26.Han HC, Fung YC. Longitudinal strain of canine and porcine aortas. J Biomech. 1995;28:637–641. doi: 10.1016/0021-9290(94)00091-h. [DOI] [PubMed] [Google Scholar]
- 27.Weizsacker H, Lambert H, Pascale K. Analysis of the passive mechanical properties of rat carotid arteries. J Biomech. 1983;16:703–715. doi: 10.1016/0021-9290(83)90080-5. [DOI] [PubMed] [Google Scholar]
- 28.Van Loon P, Klip W, Bradley EL. Length-force and volume-pressure relationships of arteries. Biorheology. 1977;14:181–201. [PubMed] [Google Scholar]
- 29.Brossollet LJ, Vito RP. An alternate formulation of blood vessel mechanics and the meaning of the in vivo property. J Biomech. 1995;28:679–687. doi: 10.1016/0021-9290(94)00119-o. [DOI] [PubMed] [Google Scholar]
- 30.Dye WW, Gleason RL, Wilson E, Humphrey JD. Altered biomechanical properties of carotid arteries in two mouse models of muscular dystrophy. J Appl Physiol. 2007;103:664–72. doi: 10.1152/japplphysiol.00118.2007. [DOI] [PubMed] [Google Scholar]
- 31.Wicker BKH, Wu HP, Yeah QAT, Humphrey JD. Comput Methods Biomech Biomed Eng. 2008. Normal basilar artery structure and biaxial mechanical behavior. accepted. [DOI] [PubMed] [Google Scholar]
- 32.Charbonneau NL, Ono RN, Corson GM, Keene DR, Sakai LY. Fine tuning of growth factor signals depends on fibrillin microfibril networks. Birth Defects Res. 2004;72:37–50. doi: 10.1002/bdrc.20000. [DOI] [PubMed] [Google Scholar]
- 33.Arteaga-Solis E, Gayraud B, Ramirez F. Elastic and collagenous networks in vascular diseases. Cell Struct Funct. 2000;25:69–72. doi: 10.1247/csf.25.69. [DOI] [PMC free article] [PubMed] [Google Scholar]
- 34.Ramirez F, Pereira L. The fibrillins. Int J Biochem Cell Biol. 1999;31:255–9. doi: 10.1016/s1357-2725(98)00109-5. [DOI] [PubMed] [Google Scholar]
- 35.Lillie MA, David GJ, Gosline JM. Mechanical role of elastin-associated microfibrils in pig aortic elastic tissue. Connect Tissue Res. 1998;37:121–41. doi: 10.3109/03008209809028905. [DOI] [PubMed] [Google Scholar]
- 36.Jackson ZS, Gotlieb AI, Langille BL. Wall tissue remodeling regulates longitudinal tension in arteries. Circ Res. 2002;90:918–25. doi: 10.1161/01.res.0000016481.87703.cc. [DOI] [PubMed] [Google Scholar]
- 37.Langille BL. Remodeling of developing and mature arteries: endothelium, smooth muscle, and matrix. J Cardiovasc Pharmacol. 1993;21(Suppl 1):S11–7. doi: 10.1097/00005344-199321001-00003. [DOI] [PubMed] [Google Scholar]
- 38.Kouchoukos NT, Dougenis D. Surgery of the thoracic aorta. N Engl J Med. 1997;336:1876–88. doi: 10.1056/NEJM199706263362606. [DOI] [PubMed] [Google Scholar]
- 39.Pezet M, Jacob MP, Escoubet B, Gheduzzi D, Tillet E, Perret P, Huber P, Quaglino D, Vranckx R, Li DY, Starcher B, Boyle WA, Mecham RP, Faury G. Elastin Haplo insufficiency Induces Alternative Aging Processes in the Aorta. Rejuvenation Res. 2008 doi: 10.1089/rej.2007.0587. [DOI] [PMC free article] [PubMed] [Google Scholar]
- 40.Dobrin PB. Mechanical properties of arterises. Physiol Rev. 1978;58:397–460. doi: 10.1152/physrev.1978.58.2.397. [DOI] [PubMed] [Google Scholar]
- 41.Jondeau G, Boutouyrie P, Lacolley P, Laloux B, Dubourg O, Bourdarias JP, Laurent S. Central pulse pressure is a major determinant of ascending aorta dilation in Marfan syndrome. Circulation. 1999;99:2677–81. doi: 10.1161/01.cir.99.20.2677. [DOI] [PubMed] [Google Scholar]
Associated Data
This section collects any data citations, data availability statements, or supplementary materials included in this article.


