

Abstract
Thalamocortical (TC) afferents relay sensory input to the cortex by making synapses onto both excitatory regular-spiking principal cells (RS cells) and inhibitory fast-spiking interneurons (FS cells). This divergence plays a crucial role in coordinating excitation with inhibition during the earliest steps of somatosensory processing in the cortex. Although the same TC afferents contact both FS and RS cells, FS cells receive larger and faster excitatory inputs from individual TC afferents. Here, we show that this larger thalamic excitation of FS cells occurs via GluR2-lacking AMPA receptors (AMPARs), and results from a fourfold larger quantal amplitude compared with the thalamic inputs onto RS cells. Thalamic afferents also activate NMDA receptors (NMDARs) at synapses onto both cells types, yet RS cell NMDAR currents are slower and pass more current at physiological membrane potentials. Because of these synaptic specializations, GluR2-lacking AMPARs selectively maintain feedforward inhibition of RS cells, whereas NMDARs contribute to the spiking of RS cells and hence to cortical recurrent excitation. Thus, thalamic afferent activity diverges into two routes that rely on unique complements of postsynaptic AMPARs and NMDARs to orchestrate the dynamic balance of excitation and inhibition as sensory input enters the cortex.
Introduction
Sensory information is transmitted from the thalamus to the cortex via thalamocortical (TC) afferents. TC afferents thus provide an essential gateway for the cortical processing of sensory stimuli by setting the initial information available to the cortex. To accomplish this task, TC afferents make the majority of their synapses in cortical layer 4, where they distribute information to both excitatory and inhibitory cells. In fact, even an individual TC afferent can contact both inhibitory interneurons and excitatory principal cells (Gabernet et al., 2005; Inoue and Imoto, 2006; Cruikshank et al., 2007).
The divergence of TC fibers onto interneurons and principal cells forms the basis of a disynaptic feedforward inhibitory circuit that is critical in coordinating excitation with inhibition during the initial phases of cortical sensory processing (Agmon and Connors, 1991; Swadlow and Gusev, 2000; Wehr and Zador, 2003; Gabernet et al., 2005; Wilent and Contreras, 2005). In the rodent somatosensory barrel cortex, TC afferents initiate feedforward inhibition by providing monosynaptic input to both fast-spiking interneurons (FS cells, a category that include several distinct GABAergic interneuron subtypes) and excitatory regular-spiking spiny stellate and star pyramidal cells (RS cells) (Simons and Woolsey, 1984; McCormick et al., 1985; Feldmeyer et al., 1999). In response to sensory stimuli, thalamic afferent activity recruits FS cells with high probability, leading to a large disynaptic inhibition of RS cells (Agmon and Connors, 1991; Swadlow and Gusev, 2000). This inhibition has been shown to restrict the time window for RS cells to integrate EPSPs (Gabernet et al., 2005), allowing them to respond with high temporal fidelity to sensory stimuli (Kyriazi et al., 1994; Pinto et al., 2000; Petersen et al., 2001; Wilent and Contreras, 2004). Thus, the feedforward inhibition provided by FS cells is a critical functional property of the TC microcircuit.
To ensure reliable feedforward inhibition of RS cells in response to thalamic activity, several elements of this disynaptic circuit appear to have established “fail-safe” properties. TC afferents converge onto FS cells with a higher probability than onto RS cells (Inoue and Imoto, 2006; Cruikshank et al., 2007). Each FS cell also targets a large fraction of neighboring RS cells (Swadlow and Gusev, 2002; Gabernet et al., 2005; Inoue and Imoto, 2006) where they elicit large unitary inhibitory conductances (Gabernet et al., 2005; Sun et al., 2006). Perhaps more importantly, however, single TC afferents provide much stronger and faster monosynaptic excitation to FS cells than to RS cells (Gibson et al., 1999; Gabernet et al., 2005; Inoue and Imoto, 2006; Cruikshank et al., 2007). As a result of these specializations, any stimulus of sufficient strength to activate an RS cell is also likely to rapidly recruit FS cells, thereby resulting in fast, precisely timed feedforward inhibition of RS cells. It has remained unknown, however, what synaptic mechanisms underlie the differential excitation of FS and RS cells by individual TC afferents.
Here, we compare TC inputs onto electrophysiologically defined FS and RS cells to reveal that larger quantal responses mediated by GluR2-lacking AMPA receptors (AMPARs) account for the larger excitation of FS cells by TC afferents. Furthermore, although TC inputs activate NMDA receptors (NMDARs) at both FS and RS cells, the NMDARs at synapses onto RS cells pass more current at physiological potentials. As a direct consequence of this differential excitation of FS and RS cells by thalamic afferents, we show that GluR2-lacking AMPARs selectively mediate cortical feedforward inhibition, whereas NMDARs play a critical role in cortical recurrent excitation.
Materials and Methods
Slices.
Acute TC slices (400 μm) of the somatosensory barrel cortex were prepared from ICR white mice (p14–25) according to published protocols (Agmon and Connors, 1991; Porter et al., 2001). Mice were anesthetized with isoflurane. Slices were incubated on an interface chamber for 30 min at 35°C with an artificial CSF equilibrated with 95% O2 and 5% CO2, containing (in mm): 119 NaCl, 2.5 KCl, 1.3 NaH2PO4, 1.3 MgCl2, 2.5 CaCl2, 26 NaHCO3, and 20 glucose (pH 7.3, osmolarity 310). After incubation, slices were kept in the same chamber at room temperature for 0–6 h until being transferred to a submerged chamber where electrophysiological recordings were made at 31−34°C.
Recordings.
Whole-cell recordings of layer IV cells (infrared DIC videomicroscopy and water-immersion 40× objective) were obtained with patch pipettes (2–5 MΩ) pulled from borosilicate capillary glass with a Sutter P-97 horizontal puller. Pipette solution contained (in mm): 142 K-gluconate, 4 KCl, 5 HEPES, 1.1 EGTA, 0.5 MgCl2, 10 phosphocreatine, and biocytin (0.1–0.5%). Some experiments (I–V curves) requiring depolarized or positive membrane potentials were performed in Cs+ (substituting Cs-gluconate for K-gluconate) and QX 314-Cl (3 mm), and all experiments examining rectification of AMPAR currents included 100 μm spermine in the patch pipettes. Internal solution pH was adjusted to 7.2 with KOH or CsOH. Data were recorded with a Multiclamp 700B amplifier (Axon Instruments), digitized at 10–20 kHz with a Digidata 1332 (Axon Instruments), filtered at 2 kHz, and analyzed off-line. Series resistance was monitored in all recordings with a 5 mV hyperpolarizing pulse, and only recordings which remained stable over the period of data collection were used. For AMPAR current–voltage relationships where gabazine was used, 100 nm NBQX was also included in 6 of 16 FS cell experiments and 6 of 14 RS cell experiments to prevent epileptic bursts after TC stimulation. This manipulation did not change AMPAR current–voltage relationships (data not shown). We did not observe any age-dependent changes in synaptic or intrinsic electrophysiological parameters for the cells measured in this study (supplemental Fig. 1, available at www.jneurosci.org as supplemental material). All drugs were purchased from Sigma-Aldrich or Tocris.
Stimulating thalamic inputs to cortical barrels.
Connectivity between the thalamus and the cortex was assessed with a field-recording electrode (2 m NaCl) placed in layer 4 of the barrel cortex, and a stimulation electrode (monopolar steel microelectrodes; stimulus duration, 100 μs) was placed near the thalamic ventrobasal nucleus (VB). VB also receives axons originating from layer 6 pyramidal neurons (Sherman and Guillery, 1996), and these send collaterals to layer 4 (Zhang and Deschênes, 1998). Thus, to ensure the “correct” orthodromic activation of the TC projection, three electrophysiological parameters were used to discriminate between orthodromic and antidromic responses: short response latency (<3 ms), depressing paired pulse ratio, and response with no supernormality. These parameters are well characterized (Ferster and Lindström, 1985; Beierlein and Connors, 2002; Gabernet et al., 2005). TC afferents were stimulated at 0.1 Hz.
Identifying the cortical neurons receiving thalamic inputs.
FS and RS cells were identified according to their spiking pattern in response to pulses of depolarizing current, their membrane time constant, the kinetics of their EPSCs, their input resistance, and their morphology under DIC optics. In response to depolarizing current injection, FS cells produce trains of narrow action potentials (AP half-width, FS: 0.40 ± 0.10 ms, n = 6; RS: 1.86 ± 0.20 ms, n = 5) with little frequency adaptation (steady-state spike frequency normalized by peak spike frequency; spiking was elicited by 800-ms-long depolarizing pulses) (FS: 0.63 ± 0.05%, RS: 0.24 ± 0.01%). FS cells also have a lower input resistance (FS: 90 ± 10 MΩ, RS: 226 ± 31 MΩ), a shorter membrane time constant (FS: 8 ± 1 ms, RS: 20 ± 3 ms), and faster rising EPSCs (FS: 450 ± 70 μs, RS: 860 ± 80 μs). We did not observe a significantly different TC paired-pulse ratio (PPR) between FS and RS cells in paired recordings (FS: 0.62 ± 0.07, RS: 0.71 ± 0.05, n = 8, p = 0.3). EPSCs evoked by thalamic stimuli occurred earlier in FS compared with RS cells (FS: 2.09 ± 0.06 ms, RS: 2.32 ± 0.08 ms, n = 8, p < 0.01), consistent with previous work (Cruikshank et al., 2007). Low threshold spiking (LTS) neurons were not included in the present study (Gibson et al., 1999; Porter et al., 2001). In a subset of experiments, biocytin-filled cells were histologically developed to confirm their morphological identity. RS cells are either spiny stellate or star pyramidal neurons, both of which have spiny dendrites (Simons and Woolsey, 1984; McCormick et al., 1985; Feldmeyer et al., 1999; Porter et al., 2001). In contrast, FS cells are aspiny or sparsely spiny, consistent with their inhibitory classification (Simons and Woolsey, 1984; McCormick et al., 1985; Porter et al., 2001). However, we did not develop a large set of cells, and it is possible that the “fast-spiking” characteristic of FS interneurons identifies a class of cells that may be divisible into smaller subgroups (Wang et al., 2002). Therefore, we measured a set of intrinsic and synaptic properties for 30 interneurons included in this study to determine whether our population of FS cells should be further divided into more than one subgroup. Histograms of each individual parameter (resting membrane potential, input resistance, membrane time constant, spike train adaptation, latency from thalamic stimulation, paired-pulse ratio, and spike half-width) did not reveal discernable multimodal distributions, suggesting no single parameter could be used to divide the recorded interneurons into distinct subpopulations (supplemental Fig. 2, available at www.jneurosci.org as supplemental material). Next, we addressed whether interneuron subgroups could be identified using an analysis that simultaneously takes into account multiple parameters. To accomplish this, we conducted principal component analysis (PCA) using the same seven parameters to aid in visualizing high-dimensional data (supplemental Fig. 3, available at www.jneurosci.org as supplemental material). This method determines the set of axes (where each axis is linearly combined from our original parameters) that correspond to variance within the dataset. To avoid biasing this analysis toward parameters with the largest absolute values, all individual parameters were normalized to their mean before conducting PCA. PCA revealed that most of the variance within our set of parameters could be accounted for by a single principal component (PC1) (supplemental Fig. 3A1, available at www.jneurosci.org as supplemental material), and the largest contribution to PC1 came from spike train adaptation. When PC1 was compared with PC2–PC4, no clustering of data points was apparent (supplemental Fig. 3A2–4, available at www.jneurosci.org as supplemental material), suggesting no clear justification for segregating FS cells into subgroups based on these parameters.
Strontium experiments.
Asynchronous EPSCs (asEPSCs) were collected during a 200 ms window beginning 5 ms after TC stimulation. Spontaneous EPSCs were also collected during an identical time window before TC stimulation for comparison. To eliminate the slow exponential decay associated with residual synchronous release immediately after TC stimulation, all traces from each cell were averaged, and then fit with a single exponential which was subsequently subtracted from each individual trace. Event analysis was performed using the “mini analysis” program from Synaptosoft. The frequency of asEPSCs collected in the time window after TC stimulation was significantly higher than the frequency of spontaneous EPSCs collected in the window before stimulation for both FS and RS cells (supplemental Fig. 4, available at www.jneurosci.org as supplemental material). Furthermore, the mean amplitude of asEPSCs collected immediately after thalamic stimulation was not significantly different from the mean amplitude of spontaneous events collected from an identical time window immediately before thalamic stimulation for both FS and RS cells (supplemental Fig. 4, available at www.jneurosci.org as supplemental material), consistent with previous data showing that TC and intracortical synapses onto RS cells produce asEPSCs of the same amplitude (Gil et al., 1999). In addition, the frequency of non-evoked, spontaneous events was significantly higher for FS cells than for RS cells (p < 0.01) (supplemental Fig. 5, available at www.jneurosci.org as supplemental material). Average root mean square (RMS) current noise levels for prestimulus (prestim) and poststimulus (poststim) epochs in the presence of strontium were: FS: prestim 2.59 ± 0.39 pA; poststim 2.78 ± 0.55 pA, n = 6, RS: prestim 1.86 ± 0.14 pA; poststim 2.21 ± 0.08 pA, n = 8.
Variance-mean analysis.
Variance-mean relationships were fit with a multinomial model (Silver, 2003), which describes the mean amplitude of a synaptic response by extending the following basic binomial model: I = NPrQ, where I is the mean synaptic current, N is the number of functional release sites, Pr is release probability, and Q is the average quantal amplitude. In the multinomial model, the parabolic function relating the mean current (I) to the variance of synaptic currents (σ) is: σ2 = [QI − I2/N](1 + CVII2) + QICVI2). This model assumes uniform release probability across sites, but does not assume synchronous release or uniform quantal amplitude (Q). Quantal variability is accounted for by CVI2 and CVII2, the coefficients of variation related to intrasite and intersite variability, respectively. Total quantal variation of each synapse (CVT2) was measured by collecting quantal events using strontium substitution (Clements and Silver, 2000). In this method, the CV of asEPSC amplitude distributions reflects CVT2. Because CVT2 must equal CVI2 + CVII2, we make the simplifying assumption that CVI2 = CVII2, which is not expected to introduce significant error (Clements, 2003). A minimum of 20 trains were recorded at each Pr condition, and Spearman's rank correlation analysis was used to ensure that amplitudes remained stable over the course of the experiments.
Because minimal stimulation was difficult to maintain over the long time intervals necessary for these experiments, we used bulk stimulation of several afferents so that we could reproducibly activate the same number of fibers. In these experiments, we monitored the paired pulse ratio to make sure it remained constant throughout the experiment, and was not different from single fiber paired pulse ratios as a test to ensure that the same set of fibers was reproducibly activated. Also, to ensure that we activated the same number of fibers throughout an experiment, we only accepted experiments in which the amplitude of the first EPSC remained constant throughout the experiment. To estimate the number of release sites made by a single TC fiber onto an FS or an RS cell, we have divided the mean unitary EPSC amplitude by the quantal amplitude (Q) and the probability of release (Pr).
Rectification index.
Current–voltage relationships showed an average 5.5 mV difference in extrapolated reversal potential for AMPAR currents between FS and RS synapses. However, for simplicity we have used measured data points from the same membrane potentials (+34/−36 mV) at both synapses to compare the two cell populations. Using the nonrectifying RS cell data as a standard, and a linear extrapolation between points for FS cells to correct for the difference in driving force, we can estimate the error in our calculated rectification index. Extrapolation to −30.5 mV and +39.5 mV reveals that the mean rectification index of FS cells would change from 0.34 to 0.40, corresponding to an error of 15% of the FS cell value, or 6% with respect to the rectification index of RS cells (1.08).
Isolation of postsynaptic currents and latency measurements.
EPSCs were recorded at the IPSC reversal potential (EIPSC = −85 mV). IPSCs were recorded at depolarized potentials (Vm = −65 mV), and then isolated by scaling the EPSC at EIPSC to the initial slope of the EPSC at the recorded IPSC potential. This scaled EPSC was then subtracted to isolate the true IPSC. At the potentials used for this scaling method, NMDA I–V curves revealed only a 3% maximum difference in the fractional peak NMDA current underlying EPSCs. Based on the average EPSC amplitude in these experiments (185 pA), this would correspond to a very small residual NMDA current (5.6 pA on average) that remains unsubtracted from IPSCs. Since IPSCs were 502 pA on average, this corresponds to an error ∼1% in the peak of subtracted IPSCs using this method. The latency of postsynaptic currents was determined by the time difference between the onset of the stimulus artifact and the 5% rise point of postsynaptic currents. Membrane potential is corrected for the calculated liquid junction potential (−15.9 mV with internal Cs+, −15 mV with a K+ internal). Average values are expressed as mean ± SEM. The Student's t test was used for statistical comparisons, with significance defined as p < 0.05.
Results
Distinct AMPARs mediate TC transmission onto FS versus RS cells
Stimulation of TC afferents with an extracellular electrode placed in the ventrobasal complex of the thalamus evoked EPSCs in cortical layer 4 RS and FS cells recorded in the whole cell voltage-clamp configuration. In the presence of the NMDAR blocker CPP (25 μm) and the GABAAR blocker gabazine (10 μm), the current–voltage (I/V) relationship of thalamic EPSCs differed between the two neuron types. Whereas thalamic EPSCs recorded in RS cells showed a linear I/V relationship, EPSCs recorded in FS cells showed a strong inward rectification (rectification index, ratio at + 34 mV/−36 mV; RS: 1.08 ± 0.10, p < 0.01, n = 14; FS: 0.34 ± 0.04, n = 16, p < 0.01) (Fig. 1A). The observed rectification in FS cells suggests the presence of GluR2-lacking AMPARs (McBain and Dingledine, 1993; Bochet et al., 1994). Indeed, the selective blocker of GluR2-lacking AMPARs, 1-naphthylacetyl spermine (NASPM, 50 μm), reduced the TC EPSC onto FS but not RS cells (FS EPSC: 41 ± 5% of control, n = 11; RS EPSC: 103 ± 4% of control, n = 7, p < 0.01) (Fig. 1B). The incomplete block of TC afferent mediated EPSCs onto FS cells by NASPM could indicate that only a fraction of AMPARs lack the GluR2 subunit. If so, the NASPM resistant component of the EPSC should show a linear I/V relationship. Alternatively, NASPM may only produce a partial block of GLUR2-lacking AMPARs. To discriminate between these two possibilities, we compared the rectification of TC EPSCs onto FS cells before and after NASPM perfusion (Fig. 1C). NASPM reduced EPSC amplitudes by 60% at all membrane potentials (Fig. 1C, left), and did not significantly affect the rectification index (control: 0.4 ± 0.1, NASPM: 0.3 ± 0.1, n = 5, p = 0.09) (Fig. 1C, middle and right), suggesting a partial block by the antagonist and indicating that TC EPSCs onto FS cells are predominantly mediated by GluR2-lacking AMPARs.
Figure 1.

TC afferents evoke GluR2-lacking AMPAR-mediated EPSCs onto FS cells. A, Left, EPSCs evoked by TC stimulation and recorded in an RS and an FS cell voltage clamped at membrane potentials ranging from −76 to +44 mV, in gabazine (10 μm) and CPP (25 μm). Middle, Summary data of current–voltage relationships for TC-evoked EPSCs. Membrane potentials are corrected for liquid junction potential. Currents are normalized to the peak negative current, and 100 μm spermine is included in the patch pipettes. Right, Summary of rectification index (+34/−36 mV); filled square, RS cells; open square, FS cells. Only the FS cells show AMPAR-mediated current rectification. Asterisk denotes statistical significance. B, Left, EPSCs evoked by TC stimulation and recorded simultaneously in an RS and an FS cell voltage clamped at the reversal potential for IPSCs (EIPSC). Only the EPSC recorded in the FS cell is reduced in the presence of the GluR2-lacking AMPAR blocker NASPM (50 μm, green traces). Inset represents recording configuration. Abbreviations, here and in subsequent figures: VB, ventrobasal complex; Stim., stimulation electrode; V-clamp, voltage clamp. Right, Summary data illustrating the normalized EPSC amplitudes after application of NASPM; filled square, RS cells; open square, FS cells. C, NASPM (green) does not affect the rectification of TC EPSCs onto FS cells as compared to control (black). Left, Example traces. Middle, Summary data of current–voltage relationship. The RS cell data (gray, from A) are shown for comparison. Right, Summary of rectification index.
Quantal amplitude differs at TC synapses onto FS and RS cells
Consistent with previous observations by several groups (Porter et al., 2001; Beierlein et al., 2003; Gabernet et al., 2005; Inoue and Imoto, 2006), bulk stimulation of TC afferents produced a fourfold larger EPSC onto FS cells compared with simultaneously recorded RS cells (FS: 871 ± 87 pA, RS: 198 ± 35 pA, n = 8, p < 0.001) (Fig. 2A). This relationship also held true when individual thalamic afferents were stimulated using a minimal stimulation paradigm to evoke unitary EPSCs (FS: 229 ± 57 pA, n = 6; RS: 56 ± 9 pA, n = 5, p < 0.01) (Fig. 2B) (Gibson et al., 1999; Gabernet et al., 2005; Inoue and Imoto, 2006; Cruikshank et al., 2007).
Figure 2.

TC afferents evoke larger EPSCs onto FS as compared to RS cells. A, Bulk stimulation of TC afferents evokes EPSCs onto an FS and an RS cell recorded simultaneously in voltage clamp at the reversal potential for IPSCs (EIPSC). Insets show the recording configuration and response to 800 ms step depolarizations in current clamp. B, Left, Top, Fifty-one superimposed EPSCs sequentially evoked by minimal stimulation of TC afferents and recorded in an RS cell voltage clamped at EIPSC. Note the presence of success and failures. Bottom, The EPSC amplitude is plotted against trial number, with stimulus intensity displayed beneath. Note that progressively increasing stimulus intensity leads initially to a reduction in failures without increasing the amplitude of successes. Further increases in stimulus intensity lead to a step-like transition to a larger EPSC. Right, Same experiment for an FS cell, 76 superimposed sweeps. Note the larger unitary amplitude of TC EPSCs onto the FS cell. C, Summary data of amplitude, latency, and paired pulse ratio of EPSCs evoked by stimulation of TC afferents and recorded in FS and RS cells.
Several possible presynaptic and postsynaptic mechanisms could explain the larger TC inputs onto FS compared with RS cells, including the number of release sites made by a single thalamic afferent, the probability of releasing a vesicle at each of these release sites, or a difference in the responsiveness to individual transmitter vesicles (quantal amplitude). Paired pulse stimulation has been shown to be related to release probability, and hence may provide an initial clue as to whether Pr may differ at TC inputs onto FS and RS cells (Silver et al., 1998). We found virtually identical paired pulse depression (interstimulus interval, 100 ms) for TC-evoked EPSCs at FS and RS cells (Fig. 2C). This suggests that TC inputs to both FS and RS cells may have a similarly high Pr. Given the likelihood of a similar Pr for inputs onto both cell types, we first tested the possibility that the stronger responses of FS cells might result from a difference in either quantal amplitude or in the number of release sites.
Estimating quantal amplitude
To determine the amplitude of the response of FS and RS cells to individual quanta of transmitter released by TC afferents, we desynchronized transmitter release by substituting Ca2+ with Sr2+ (Goda and Stevens, 1994; Gil et al., 1999). asEPSCs collected during a 200 ms window after TC afferent stimulation were three times larger and significantly faster at TC synapses onto FS versus RS cells (FS: 19.1 ± 1.7 pA, n = 6; RS: 7.2 ± 0.5 pA, n = 8; FS: 10–90% rise time = 200 ± 10 μs, decay τ, 0.640 ± 0.080 ms, RS: 10–90% rise time = 600 ± 20 μs, p < 0.001, decay τ1, 1.78 ± 0.16 ms, p < 0.001) (Fig. 3).
Figure 3.

Larger quantal amplitude of TC inputs onto FS as compared to RS cells. A, Left, Three individual sweeps illustrate asynchronous release elicited by thalamic stimulation and recorded in RS (top) or FS (bottom) cells after replacing calcium with 4 mm strontium. The blue line illustrates the 200 ms time window within which quanta were analyzed. Inset, Response to 800 ms step depolarizations in current clamp. Middle, Plot of event amplitude against trial number illustrating response stability. Inset, Average asEPSC. Right, Distributions of quantal events. Note larger asEPSC amplitudes for FS as compared to RS cells. B, Left, asEPSCs averaged across cells. Right, Summary data of amplitudes, rise times, and decay time constants for asEPSCs recorded in FS cells (open squares) and RS cells (closed squares). Decay times were fitted with a single exponential. Note that both the rise time and decay time constant of asEPSCs recorded in FS cells were faster than those recorded in RS cells.
The threshold used to detect asEPSCs in the presence of Sr2+ may have led to an overestimate of their amplitudes because subthreshold asEPSCs did not contribute to the average. This overestimate is likely to affect the smaller asEPSCs recorded in RS cells more than those recorded in FS cells, since a larger fraction of the events recorded in RS cells would be below detection threshold. Such a selective bias would underestimate the actual difference in quantal amplitude between the two cell types. To address this concern, we measured quantal amplitude with a variance-mean analysis of TC-evoked EPSCs. This approach does not rely on thresholding and makes use of a statistical model of transmitter release to determine both quantal amplitude (Q) and the mean synaptic release probability (Pr) (Clements and Silver, 2000; Clements, 2003; Silver, 2003). We measured EPSCs evoked over a wide range of release probabilities, both by modulating Pr with repetitive stimulation to progressively depress release and by changing the ionic composition of the external solution. Specifically, we delivered 10 stimuli at 20 Hz repetitively to TC afferents in 2.5 mm external calcium, followed by 10 stimuli at 20 Hz repetitively in 2.5 mm calcium plus 30 μm cadmium (Fig. 4).
Figure 4.

Larger quantal amplitude but similar release probability of TC inputs onto FS as compared to RS cells. A, EPSCs recorded in RS (left) and FS (right) cells voltage clamped at EIPSC in response to repetitive bulk stimulation of TC afferents (20 Hz) under control conditions (black) and in the presence of cadmium (30 μm, green). Insets show response to an 800 ms step depolarization in current clamp. B, The mean amplitude of each EPSC in the train is plotted against its respective variance (measured at the peak of the EPSC). Black and green data points represent EPSCs recorded in control and cadmium, respectively. The data are fit with a parabolic function based on a multinomial model (see Materials and Methods). C, Summary data: note that while the quantal amplitude (Q) is 4.4-fold larger in FS as compared to RS cells, the probability of release (Pr) is similar.
These experiments show a 4.4-fold larger quantal amplitude at TC synapses onto FS cells compared with RS cells (FS: Q = 17.0 ± 3.3 pA, n = 4; RS: Q = 3.9 ± 0.5 pA, n = 4) (Fig. 4C). Together, our estimates of quantal size using asEPSCs and variance-mean analysis suggest a ∼4-fold difference in quantal amplitude between FS and RS cells that is similar to the difference in amplitude of unitary EPSCs between the two cell types. Furthermore, consistent with the equivalent paired-pulse ratio at RS and FS cell TC synapses, Pr determined by variance-mean analysis was the same at these two synapses (FS: Pr = 0.88 ± 0.4, n = 4; RS: Pr = 0.88 ± 0.3, n = 4). Given the average unitary EPSC of 56 and 229 pA for RS and FS cells respectively, we can estimate the number of release sites of individual TC fibers to be ∼15 onto FS cells and 16 onto RS cells.
These results indicate that the larger AMPAR-mediated excitation of FS versus RS cells by individual TC fibers is mainly attributable to a difference in the response of these two cell types to individual quanta of transmitter, rather than to a difference in the number of release sites or in the probability of release.
NMDARs at TC synapses
Is the difference in thalamic excitation limited to AMPAR-mediated transmission, or is there also a difference for NMDAR-mediated transmission at synapses onto FS and RS cells? We first assessed the relative contribution of AMPARs and NMDARs at TC synapses onto FS and RS cells by measuring the ratio of AMPAR to NMDAR-mediated currents (Fig. 5). These experiments show a nearly threefold larger AMPAR to NMDAR-mediated current ratio for TC synapses onto FS cells (FS: 2.6 ± 0.5, n = 12; RS: 1.0 ± 0.2, n = 13). Thus, in contrast to AMPAR-mediated EPSCs, which are approximately four times larger in FS as compared to RS cells, the peak amplitude of TC activated NMDAR-mediated synaptic currents (recorded at ∼+40 mV) is similar between the two neurons.
Figure 5.
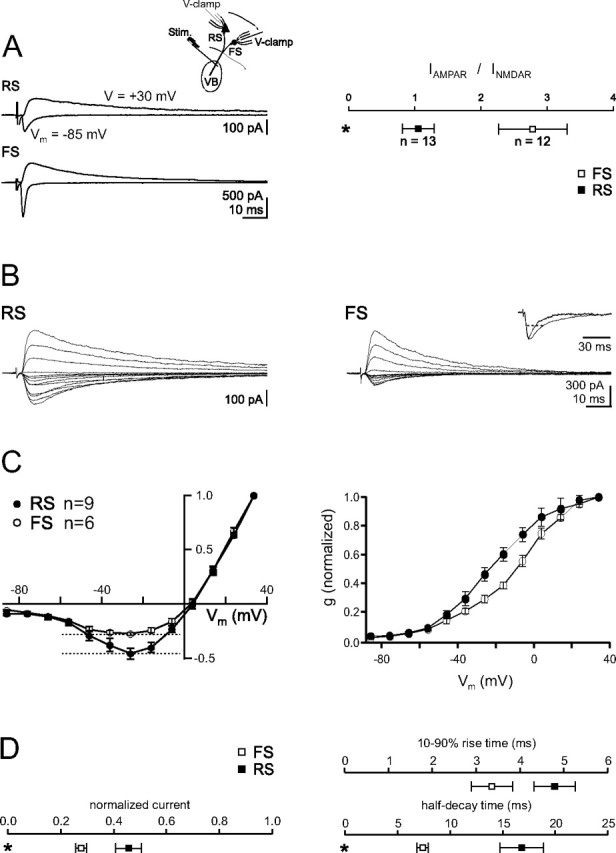
Distinct properties of NMDAR-mediated EPSCs evoked by TC afferents onto RS and FS cells. A, Left, EPSCs elicited by bulk stimulation of TC afferents and recorded simultaneously in a voltage-clamped RS cell (top) and FS cell (bottom). The outward, pharmacologically isolated NMDAR-mediated EPSC was recorded +30 mV above the reversal potential in the presence of the AMPAR antagonist NBQX (10 μm) and the GABAAR antagonist gabazine (10 μm). The inward, AMPAR-mediated EPSC was isolated by digital subtraction of the EPSC recorded at −85 mV (EIPSC) in the presence of NBQX and gabazine from the EPSC recorded at the same potential in control conditions. Right, Summary data of the ratio between the peak amplitudes of the AMPAR- and NMDAR-mediated EPSCs, isolated as described above. Note the larger AMPAR–NMDAR ratio of EPSCs recorded in FS cells. B, Current–voltage relationship of NMDAR-mediated EPSCs elicited by stimulation of TC afferents and recorded in RS cells (left) or FS cells (right) in the presence of NBQX and gabazine. Membrane potentials (corrected for liquid junction potential) were varied between −86 and +34 mV. Currents are scaled to the peak of the EPSC recorded at +34 mV for comparison. Note that NMDAR-mediated EPSCs recorded at negative potentials are relatively larger in RS as compared to FS cells. Inset, Superimposed peak-scaled NMDAR-mediated EPSC recorded in FS and RS cells at −26 mV. Note the faster time course of the EPSC recorded in FS cells. Dotted line, Half-decay time. C, Summary data. Normalized current–voltage relationship (left) and normalized conductance–voltage relationship (right) of NMDAR-mediated EPSCs recorded in FS and RS cells. Note the rightward shift of the conductance–voltage relationship in FS as compared to RS cells. D, Summary data for normalized peak amplitude at −26 mV, rise times, and half-decay times of the NMDAR-mediated EPSCs recorded in FS and RS cells.
Despite the similarity in amplitude, however, NMDAR-mediated currents showed marked differences between the two cells types, both in terms of voltage dependence and kinetics (Fig. 5B, D). Specifically, the normalized current–voltage and conductance–voltage relationships (normalized for responses elicited at +34 mV, in the presence of 10 μm NBQX and 10 μm gabazine) illustrates that the NMDAR-mediated EPSCs evoked at ∼−30 mV onto RS cells passed approximately twice as much peak inward current compared with those elicited onto FS cells (Vm = −26 mV; FS: 0.28 ± 0.02, n = 6; RS: 0.46 ± 0.05, n = 9). Furthermore, NMDAR-mediated EPSCs recorded at RS cells rose and decayed slower than at FS cells (−30 mV: 10–90% rise time FS: 3.4 ± 0.5 ms, n = 6; RS: 4.8 ± 0.5 ms, n = 8, p = 0.06; time to ½ decay FS: 7.4 ± 0.6 ms, n = 6; RS: 16.8 ± 2.1 ms, n = 9, p < 0.01). As a consequence, individual NMDARs at RS cells can pass three times more charge at −30 mV than the NMDARs at FS cells. Thus, considering the fourfold smaller unitary TC inputs, and the 2.6-fold smaller AMPA to NMDA ratio, RS cells can receive as much as twice (3.0 × 0.25 × 2.6) the NMDAR-mediated charge in response to unitary TC inputs as compared FS cells.
Based on the AMPA-NMDA ratio, these results show that whereas TC excitation of FS cells is driven by GluR2-lacking AMPARs, excitation of RS cells is in large part mediated by NMDARs.
What roles do the unique AMPAR and NMDAR complements onto FS and RS cells play in the circuit engaged by TC afferents? To address this question, we have measured the relative contribution of GluR2-lacking AMPARs and NMDARs in generating feedforward inhibition and recurrent excitation in the cortex in response to thalamic afferent activity.
Role of GluR2-lacking AMPARs in feedforward inhibition
Layer 4 FS cells mediate powerful feedforward inhibition onto RS cells in response to TC activity. Since GluR2-lacking AMPARs contribute a large fraction of TC excitation at FS cells, we tested the role of these receptors in mediating feedforward inhibition within layer IV. We stimulated TC afferents while recording from one FS and one RS cell simultaneously. To monitor direct TC excitation as well as disynaptic feedforward inhibition, RS cells were voltage clamped at −65 mV, i.e., between the reversal potential of EPSCs and IPSCs. The feedforward IPSC was isolated by digitally subtracting the underlying EPSC recorded at EIPSC (see Materials and Methods). Consistent with previous data, the onset of the IPSC followed the onset of the EPSC by 1.3 ms (1.27 ± 0.13 ms, n = 5) (Gabernet et al., 2005; Cruikshank et al., 2007). Application of NASPM (50 μm) nearly abolished feedforward inhibition in RS cells (11 ± 3% of control, Fig. 6A).
Figure 6.

Blocking GluR2-lacking AMPARs abolishes feedforward inhibition evoked by stimulation of TC afferents. A, Top, Recording configuration. Traces: Bulk stimulation of TC afferents triggers a feedforward IPSC in an RS cell (top, voltage clamped at −65 mV; see Materials and Methods for isolation of IPSC) and an EPSC in a simultaneously recorded FS cell (bottom, voltage clamped at EIPSC). Application of the GluR2-lacking AMPAR blocker NASPM (green) abolishes the feedforward IPSC recorded in the RS cell and decreases the EPSC recorded in the FS cell. In contrast, the EPSC evoked in the RS cell (isolated by voltage clamping the neuron at EIPSC, inset) remains unaffected. Bottom, Summary data. B, Top, Recording configuration (I-clamp: current clamp). Traces: Bulk stimulation of TC afferents triggers an EPSP-IPSP sequence in an RS cell (top, current clamp configuration) and an EPSC in a simultaneously recorded FS cell (bottom, voltage clamped at EIPSC). Application of NASPM (green) abolishes the feedforward IPSP recorded in the RS cell, thereby increasing the amplitude and prolonging the time course of the EPSP. As in A, NASPM decreases the EPSC recorded in the FS cell. Bottom, Summary graph of the effect of NASPM on the peak amplitude and half width of the postsynaptic potential recorded in RS cells. C, Left, Recording configuration as in A. The NMDAR antagonist CPP (25 μm, green) has no effect either on the feedforward IPSC recorded in the RS cell (top) or on the EPSC recorded in the RS cells (inset) or FS cells (bottom). Right, Summary graph.
Furthermore, as shown above, NASPM reduced the size of the FS cell EPSC (42 ± 5% of control, five pairs) without affecting the RS cell EPSC (Vm = EIPSC). To determine the impact of the reduction of TC feedforward IPSC on the membrane potential of RS cells, we repeated this experiment in four pairs in which the RS cells were held in the current clamp configuration (Fig. 6B). Application of NASPM changed the response of RS cells from an EPSP-IPSP sequence to a pure EPSP, thereby increasing the EPSP half-width 13-fold (control PSP half-width, 1.89 ± 0.08, NASPM half-width, 25.72 ± 3.76, n = 3. One PSP was purely inhibitory, and was completely abolished by NASPM). In contrast to NASPM, the NMDAR antagonist CPP had no effect on the amplitude of feedforward IPSCs (117 ± 12% of control, n = 5, p = 0.12) (Fig. 6C).
These experiments suggest that the spiking of FS cells in response to TC afferent activity is predominantly mediated by calcium-permeable GluR2-lacking AMPARs. The lack of effect of CPP on disynaptic inhibition suggests that the NMDAR component of TC-evoked EPSCs do not play a role in bringing FS cells to spike threshold. Thus, GluR2-lacking AMPARs play an essential role in generating TC feedforward inhibition in layer IV of the somatosensory cortex.
Role of NMDARs in thalamic excitation of RS cells
In contrast to their role at FS TC synapses, we find that NMDARs significantly contribute to the thalamic excitation of RS cells. Specifically, we find that a large NMDAR component underlies the canonical EPSP-IPSP sequence initiated by thalamic afferents at synapses onto RS cells (Fig. 7A). At these synapses, CPP shifted the balance of excitation and inhibition for near threshold PSPs. Namely, by removing the slow underlying NMDAR component of the RS cell PSP, CPP allowed a larger membrane hyperpolarization resulting from feedforward IPSPs. This effect of CPP (as quantified by the integrated CPP-sensitive component of the PSP) was significantly larger at TC synapses onto RS cells compared with FS cells (FS: 35.4 ± 7.6 mV·ms, n = 6; RS: 149.1 ± 39.0 mV·ms, n = 8). Thus, RS cell NMDARs play a major role in controlling the membrane potential after thalamic excitation, which could allow them to facilitate synaptic integration and enhance RS cell excitability.
Figure 7.

Blocking NMDARs reduces the recurrent polysynaptic excitation evoked by stimulation of TC afferents. A, Left, Response to TC afferent stimulation in an RS (top, black, Vm = −54 mV) and an FS (bottom, black, Vm = −57 mV) cell recorded in the current clamp configuration. Blocking NMDARs with the specific antagonist CPP (25 μm) reveals a larger IPSP in an RS cell (green) but has little effect on the postsynaptic potential recorded in an FS cell. Gray traces, Digital subtraction of the traces recorded in control (black) from the traces recorded in CPP. Note the larger and slower CPP-sensitive component in RS as compared to FS cells. Right, Summary graph of the membrane potential (top) and the integral of the CPP-sensitive component (bottom). Avg, Average. B, Left, Stimulation of TC afferents evokes a monosynaptic EPSC followed by polysynaptic recurrent EPSCs (black traces, 10 superimposed sweeps) in an FS cell voltage clamped at EIPSC. Perfusion of CPP (25 μm; green traces; 10 superimposed sweeps) has no effect on the monosynaptic TC EPSC (consistent with Fig. 6C) but strongly reduces polysynaptic EPSCs. Right, Summary graph of the CPP-mediated reduction in excitatory charge integrated over a 10 ms time window (black horizontal line on left).
To test this idea, we examined the role of NMDARs in recurrent excitation after thalamic stimulation. In addition to their projections to layer 2/3, layer 4 RS cells make synapses both with each other, and with FS cells (Beierlein et al., 2003; Sun et al., 2006). As a result, stimulation of TC afferents can produce recurrent excitatory currents in layer 4 cells that appear after monosynaptic TC EPSCs. We thus monitored recurrent excitation at FS cells, which manifests itself as a barrage of EPSCs immediately after the monosynaptic TC EPSC. Whereas blocking NMDARs did not affect disynaptic feedforward IPSCs recorded in RS cells, CPP had a dramatic effect on recurrent excitatory currents recorded in FS cells (Fig. 7B). In 5 FS cell recordings where delayed recurrent excitatory EPSCs were observed after the monosynaptic TC EPSC, CPP selectively reduced the synaptic charge transfer of the recurrent component without changing the amplitude of the early, monosynaptic EPSC (normalized recurrent charge transfer = 50 ± 10% of control). Hence, these data suggest that NMDAR-mediated current, although not participating in the firing of FS cells, contributes to the recruitment of RS cells in layer IV in response to thalamic activity.
Discussion
The thalamus communicates differently with excitatory and inhibitory cells in the cortex, providing much stronger and faster excitation to inhibitory interneurons. Here, we reveal the synaptic mechanisms that allow such differential communication, and show how these synaptic specializations sculpt the activity of the circuit engaged by thalamic afferents. At synapses onto FS cells, thalamic afferents produce large, fast EPSCs with a fourfold larger underlying quantal amplitude by activating GluR2-lacking AMPARs to reliably engage disynaptic feedforward inhibition. Furthermore, at these synapses most excitatory charge passes through AMPARs compared with NMDARs. In contrast, thalamic excitation of RS cells is more heavily weighted toward NMDARs, which are specialized to pass more current at physiological potentials. These differences in AMPARs and NMDARs at thalamic synapses allow FS and RS cells to perform unique roles at the first stage of cortical somatosensory processing.
In cortical layer IV, FS cells generate feedforward inhibition in response to thalamic activity (Porter et al., 2001; Swadlow, 2003; Inoue and Imoto, 2006; Sun et al., 2006). Previous studies of TC feedforward inhibition have consistently shown that FS cells are more responsive to thalamic input than RS cells (Simons, 1978; Kyriazi et al., 1994; Brumberg et al., 1996). In fact, one spike in a single thalamic axon is sufficient to trigger a spike in layer 4 FS cells in vivo (Swadlow and Gusev, 2000, 2002). The resulting feedforward inhibition from these FS cells has been shown to be critical for regulating the timing of cortical spiking (Wehr and Zador, 2003; Gabernet et al., 2005; Higley and Contreras, 2006). It has remained unknown, however, what allows thalamic afferents to produce stronger excitation of interneurons. Here, by demonstrating a fourfold larger quantal amplitude at synapses onto FS cells that exclusively contain GluR2-lacking AMPARs, we provide a synaptic mechanism that can explain these previous observations. Since Glur2-lacking AMPARs typically have a single channel conductance that is several-fold larger than GluR2-containing AMPARs (Swanson et al., 1997), the presence of these receptors may likely account for this larger quantal amplitude, although differences in the numbers of receptors between FS and RS synapses may also play a role.
It has also been shown that FS cells must spike rapidly after thalamic input to produce feedforward inhibition quickly enough to restrict the time window for RS cells to integrate monosynaptic thalamic EPSPs (Gabernet et al., 2005; Cruikshank et al., 2007). For FS cells to reach threshold quickly, they must therefore also produce fast thalamic EPSCs. Hence, in addition to a large quantal amplitude, FS cells exhibit significantly faster AMPAR-mediated currents than RS cells. GluR2-lacking AMPARs are well suited for this requirement because of their typically fast channel kinetics (Geiger et al., 1995) capable of producing rapid EPSPs (Geiger et al., 1997). Previous work has identified GluR2-lacking AMPARs at interneurons in the visual cortex (Jonas et al., 1994), as well as at other interneuron synapses (Koh et al., 1995; Angulo et al., 1999; Liu and Cull-Candy, 2000). Here, we find that GluR2-lacking AMPARs at TC synapses onto layer IV FS cells are critical for activating feedforward inhibition, and blocking these receptors selectively abolishes disynaptic IPSCs recorded in RS cells after thalamic stimulation. Hence, cortical inhibition initiated by thalamic activity is generated by the selective activation of GluR2-lacking AMPARs onto FS cells.
We also determined that NMDARs differ at thalamic inputs onto FS and RS cells, and that they contribute to the recruitment of RS cells. Although most investigations of NMDARs have focused on their role in synaptic plasticity, several studies have demonstrated a crucial role for NMDARs in normal synaptic transmission and the processing of sensory information in the cortex (Miller et al., 1989; Armstrong-James et al., 1993; Gil and Amitai, 1996; Kasamatsu et al., 1998). Unfortunately, the specific stage at which NMDARs are involved in the transmission and processing of sensory information in the cortex has remained a matter of speculation. Furthermore how NMDARs may contribute to normal synaptic transmission despite their voltage-dependent Mg2+ sensitivity has remained unclear. Here we show that, in the somatosensory cortex, NMDARs play a fundamental role already at the very initial steps of information transfer from the thalamus to the cortex; namely at the thalamic input onto layer 4 RS cells. The relatively large currents passing through RS cell NMDARs at hyperpolarized potentials and their slow kinetics compared with FS cells are likely to represent the mechanism underlying the strong and selective contribution of NMDARs in the transmission of somatosensory information from the thalamus to RS cells. The voltage dependence of RS NMDARs suggests a low Mg2+ sensitivity, consistent with the presence of the NR2C subunit in cortical excitatory neurons (Kuner and Schoepfer, 1996; Fleidervish et al., 1998; Binshtok et al., 2006). These data also support previous evidence that NMDARs do not play a major role in the excitability of cortical interneurons (Ling and Benardo, 1995; Angulo et al., 1999).
It will be interesting to discover what further implications the unique glutamate receptor complements of FS and RS cells have for somatosensory processing, apart from their immediate roles in layer IV feedforward inhibition and recurrent excitation. Specifically, it may be possible that GluR2-lacking AMPARs at FS cells confer unique plasticity rules at interneuron synapses, as has been shown for other cells with calcium-permeable AMPARs (Lamsa et al., 2007). Also, because antagonists for GluR2-lacking AMPARs can remove feedforward inhibition within layer IV, these drugs could be used to investigate the role of this inhibition in downstream processing without affecting excitatory transmission through RS cells. For both FS and RS cells, it will also be important to determine whether the differences in AMPARs and NMDARs hold true at intracortical synapses as well, since TC synapses are a minority of inputs at both cell types (White and Rock, 1980; Harris and Woolsey, 1983; Ahmed et al., 1994).
Together, the data described here reveal that the excitatory and inhibitory cells of layer IV have evolved a host of postsynaptic specializations which allow the thalamus to differentially engage them during somatosensory processing. The fast, large quantal amplitude AMPAR-mediated currents at thalamic inputs onto FS cells allow them to initiate feedforward inhibition in a reliable, precisely timed manner. In contrast, RS cells use a smaller quantal amplitude and slower AMPA and NMDAR-mediated currents to facilitate integration of convergent inputs (Bruno and Sakmann, 2006). These synaptic specializations hence allow the TC microcircuit to refine thalamic input and support the temporal precision necessary for higher cortical tactile discriminations.
Footnotes
This work was supported by National Institutes of Health Grant #NH70058. C.H. was supported by a postdoctoral National Research Service Award fellowship (5F32NS060585-03). We are grateful to the members of the Scanziani laboratory and Lindsey Glickfeld for their comments on this manuscript.
References
- Agmon A, Connors BW. Thalamocortical responses of mouse somatosensory (barrel) cortex in vitro. Neuroscience. 1991;41:365–379. doi: 10.1016/0306-4522(91)90333-j. [DOI] [PubMed] [Google Scholar]
- Ahmed B, Anderson JC, Douglas RJ, Martin KA, Nelson JC. Polyneuronal innervation of spiny stellate neurons in cat visual cortex. J Comp Neurol. 1994;341:39–49. doi: 10.1002/cne.903410105. [DOI] [PubMed] [Google Scholar]
- Angulo MC, Rossier J, Audinat E. Postsynaptic glutamate receptors and integrative properties of fast-spiking interneurons in the rat neocortex. J Neurophysiol. 1999;82:1295–1302. doi: 10.1152/jn.1999.82.3.1295. [DOI] [PubMed] [Google Scholar]
- Armstrong-James M, Welker E, Callahan CA. The contribution of NMDA and non-NMDA receptors to fast and slow transmission of sensory information in the rat SI barrel cortex. J Neurosci. 1993;13:2149–2160. doi: 10.1523/JNEUROSCI.13-05-02149.1993. [DOI] [PMC free article] [PubMed] [Google Scholar]
- Beierlein M, Connors BW. Short-term dynamics of thalamocortical and intracortical synapses onto layer 6 neurons in neocortex. J Neurophysiol. 2002;88:1924–1932. doi: 10.1152/jn.2002.88.4.1924. [DOI] [PubMed] [Google Scholar]
- Beierlein M, Gibson JR, Connors BW. Two dynamically distinct inhibitory networks in layer 4 of the neocortex. J Neurophysiol. 2003;90:2987–3000. doi: 10.1152/jn.00283.2003. [DOI] [PubMed] [Google Scholar]
- Binshtok AM, Fleidervish IA, Sprengel R, Gutnick MJ. NMDA receptors in layer 4 spiny stellate cells of the mouse barrel cortex contain the NR2C subunit. J Neurosci. 2006;26:708–715. doi: 10.1523/JNEUROSCI.4409-05.2006. [DOI] [PMC free article] [PubMed] [Google Scholar]
- Bochet P, Audinat E, Lambolez B, Crépel F, Rossier J, Iino M, Tsuzuki K, Ozawa S. Subunit composition at the single-cell level explains functional properties of a glutamate-gated channel. Neuron. 1994;12:383–388. doi: 10.1016/0896-6273(94)90279-8. [DOI] [PubMed] [Google Scholar]
- Brumberg JC, Pinto DJ, Simons DJ. Spatial gradients and inhibitory summation in the rat whisker barrel system. J Neurophysiol. 1996;76:130–140. doi: 10.1152/jn.1996.76.1.130. [DOI] [PubMed] [Google Scholar]
- Bruno RM, Sakmann B. Cortex is driven by weak but synchronously active thalamocortical synapses. Science. 2006;312:1622–1627. doi: 10.1126/science.1124593. [DOI] [PubMed] [Google Scholar]
- Clements JD. Variance-mean analysis: a simple and reliable approach for investigating synaptic transmission and modulation. J Neurosci Methods. 2003;130:115–125. doi: 10.1016/j.jneumeth.2003.09.019. [DOI] [PubMed] [Google Scholar]
- Clements JD, Silver RA. Unveiling synaptic plasticity: a new graphical and analytical approach. Trends Neurosci. 2000;23:105–113. doi: 10.1016/s0166-2236(99)01520-9. [DOI] [PubMed] [Google Scholar]
- Cruikshank SJ, Lewis TJ, Connors BW. Synaptic basis for intense thalamocortical activation of feedforward inhibitory cells in neocortex. Nat Neurosci. 2007;10:462–468. doi: 10.1038/nn1861. [DOI] [PubMed] [Google Scholar]
- Feldmeyer D, Egger V, Lubke J, Sakmann B. Reliable synaptic connections between pairs of excitatory layer 4 neurones within a single ‘barrel’ of developing rat somatosensory cortex. J Physiol. 1999;521:169–190. doi: 10.1111/j.1469-7793.1999.00169.x. [DOI] [PMC free article] [PubMed] [Google Scholar]
- Ferster D, Lindström S. Augmenting responses evoked in area 17 of the cat by intracortical axon collaterals of cortico-geniculate cells. J Physiol. 1985;367:217–232. doi: 10.1113/jphysiol.1985.sp015821. [DOI] [PMC free article] [PubMed] [Google Scholar]
- Fleidervish IA, Binshtok AM, Gutnick MJ. Functionally distinct NMDA receptors mediate horizontal connectivity within layer 4 of mouse barrel cortex. Neuron. 1998;21:1055–1065. doi: 10.1016/s0896-6273(00)80623-6. [DOI] [PubMed] [Google Scholar]
- Gabernet L, Jadhav SP, Feldman DE, Carandini M, Scanziani M. Somatosensory integration controlled by dynamic thalamocortical feed-forward inhibition. Neuron. 2005;48:315–327. doi: 10.1016/j.neuron.2005.09.022. [DOI] [PubMed] [Google Scholar]
- Geiger JR, Melcher T, Koh DS, Sakmann B, Seeburg PH, Jonas P, Monyer H. Relative abundance of subunit mRNAs determines gating and Ca2+ permeability of AMPA receptors in principal neurons and interneurons in rat CNS. Neuron. 1995;15:193–204. doi: 10.1016/0896-6273(95)90076-4. [DOI] [PubMed] [Google Scholar]
- Geiger JR, Lübke J, Roth A, Frotscher M, Jonas P. Submillisecond AMPA receptor-mediated signaling at a principal neuron-interneuron synapse. Neuron. 1997;18:1009–1023. doi: 10.1016/s0896-6273(00)80339-6. [DOI] [PubMed] [Google Scholar]
- Gibson JR, Beierlein M, Connors BW. Two networks of electrically coupled inhibitory neurons in neocortex. Nature. 1999;402:75–79. doi: 10.1038/47035. [DOI] [PubMed] [Google Scholar]
- Gil Z, Amitai Y. Adult thalamocortical transmission involves both NMDA and non-NMDA receptors. J Neurophysiol. 1996;76:2547–2554. doi: 10.1152/jn.1996.76.4.2547. [DOI] [PubMed] [Google Scholar]
- Gil Z, Connors BW, Amitai Y. Efficacy of thalamocortical and intracortical synaptic connections: quanta, innervation, and reliability. Neuron. 1999;23:385–397. doi: 10.1016/s0896-6273(00)80788-6. [DOI] [PubMed] [Google Scholar]
- Goda Y, Stevens CF. Two components of transmitter release at a central synapse. Proc Natl Acad Sci U S A. 1994;91:12942–12946. doi: 10.1073/pnas.91.26.12942. [DOI] [PMC free article] [PubMed] [Google Scholar]
- Harris RM, Woolsey TA. Computer-assisted analyses of barrel neuron axons and their putative synaptic contacts. J Comp Neurol. 1983;220:63–79. doi: 10.1002/cne.902200107. [DOI] [PubMed] [Google Scholar]
- Higley MJ, Contreras D. Balanced excitation and inhibition determine spike timing during frequency adaptation. J Neurosci. 2006;26:448–457. doi: 10.1523/JNEUROSCI.3506-05.2006. [DOI] [PMC free article] [PubMed] [Google Scholar]
- Inoue T, Imoto K. Feedforward inhibitory connections from multiple thalamic cells to multiple regular-spiking cells in layer 4 of the somatosensory cortex. J Neurophysiol. 2006;96:1746–1754. doi: 10.1152/jn.00301.2006. [DOI] [PubMed] [Google Scholar]
- Jonas P, Racca C, Sakmann B, Seeburg PH, Monyer H. Differences in Ca2+ permeability of AMPA-type glutamate receptor channels in neocortical neurons caused by differential GluR-B subunit expression. Neuron. 1994;12:1281–1289. doi: 10.1016/0896-6273(94)90444-8. [DOI] [PubMed] [Google Scholar]
- Kasamatsu T, Imamura K, Mataga N, Hartveit E, Heggelund U, Heggelund P. Roles of N-methyl-D-aspartate receptors in ocular dominance plasticity in developing visual cortex: re-evaluation. Neuroscience. 1998;82:687–700. doi: 10.1016/s0306-4522(97)00222-4. [DOI] [PubMed] [Google Scholar]
- Koh DS, Geiger JR, Jonas P, Sakmann B. Ca(2+)-permeable AMPA and NMDA receptor channels in basket cells of rat hippocampal dentate gyrus. J Physiol. 1995;485:383–402. doi: 10.1113/jphysiol.1995.sp020737. [DOI] [PMC free article] [PubMed] [Google Scholar]
- Kuner T, Schoepfer R. Multiple structural elements determine subunit specificity of Mg2+ block in NMDA receptor channels. J Neurosci. 1996;16:3549–3558. doi: 10.1523/JNEUROSCI.16-11-03549.1996. [DOI] [PMC free article] [PubMed] [Google Scholar]
- Kyriazi HT, Carvell GE, Simons DJ. OFF response transformations in the whisker/barrel system. J Neurophysiol. 1994;72:392–401. doi: 10.1152/jn.1994.72.1.392. [DOI] [PubMed] [Google Scholar]
- Lamsa KP, Heeroma JH, Somogyi P, Rusakov DA, Kullmann DM. Anti-Hebbian long-term potentiation in the hippocampal feedback inhibitory circuit. Science. 2007;315:1262–1266. doi: 10.1126/science.1137450. [DOI] [PMC free article] [PubMed] [Google Scholar]
- Ling DS, Benardo LS. Recruitment of GABAA inhibition in rat neocortex is limited and not NMDA dependent. J Neurophysiol. 1995;74:2329–2335. doi: 10.1152/jn.1995.74.6.2329. [DOI] [PubMed] [Google Scholar]
- Liu SQ, Cull-Candy SG. Synaptic activity at calcium-permeable AMPA receptors induces a switch in receptor subtype. Nature. 2000;405:454–458. doi: 10.1038/35013064. [DOI] [PubMed] [Google Scholar]
- McBain CJ, Dingledine R. Heterogeneity of synaptic glutamate receptors on CA3 stratum radiatum interneurones of rat hippocampus. J Physiol. 1993;462:373–392. doi: 10.1113/jphysiol.1993.sp019560. [DOI] [PMC free article] [PubMed] [Google Scholar]
- McCormick DA, Connors BW, Lighthall JW, Prince DA. Comparative electrophysiology of pyramidal and sparsely spiny stellate neurons of the neocortex. J Neurophysiol. 1985;54:782–806. doi: 10.1152/jn.1985.54.4.782. [DOI] [PubMed] [Google Scholar]
- Miller KD, Chapman B, Stryker MP. Visual responses in adult cat visual cortex depend on N-methyl-D-aspartate receptors. Proc Natl Acad Sci U S A. 1989;86:5183–5187. doi: 10.1073/pnas.86.13.5183. [DOI] [PMC free article] [PubMed] [Google Scholar]
- Petersen RS, Panzeri S, Diamond ME. Population coding of stimulus location in rat somatosensory cortex. Neuron. 2001;32:503–514. doi: 10.1016/s0896-6273(01)00481-0. [DOI] [PubMed] [Google Scholar]
- Pinto DJ, Brumberg JC, Simons DJ. Circuit dynamics and coding strategies in rodent somatosensory cortex. J Neurophysiol. 2000;83:1158–1166. doi: 10.1152/jn.2000.83.3.1158. [DOI] [PubMed] [Google Scholar]
- Porter JT, Johnson CK, Agmon A. Diverse types of interneurons generate thalamus-evoked feedforward inhibition in the mouse barrel cortex. J Neurosci. 2001;21:2699–2710. doi: 10.1523/JNEUROSCI.21-08-02699.2001. [DOI] [PMC free article] [PubMed] [Google Scholar]
- Sherman SM, Guillery RW. Functional organization of thalamocortical relays. J Neurophysiol. 1996;76:1367–1395. doi: 10.1152/jn.1996.76.3.1367. [DOI] [PubMed] [Google Scholar]
- Silver RA. Estimation of nonuniform quantal parameters with multiple-probability fluctuation analysis: theory, application and limitations. J Neurosci Methods. 2003;130:127–141. doi: 10.1016/j.jneumeth.2003.09.030. [DOI] [PubMed] [Google Scholar]
- Silver RA, Momiyama A, Cull-Candy SG. Locus of frequency-dependent depression identified with multiple-probability fluctuation analysis at rat climbing fibre-Purkinje cell synapses. J Physiol. 1998;510:881–902. doi: 10.1111/j.1469-7793.1998.881bj.x. [DOI] [PMC free article] [PubMed] [Google Scholar]
- Simons DJ. Response properties of vibrissa units in rat SI somatosensory neocortex. J Neurophysiol. 1978;41:798–820. doi: 10.1152/jn.1978.41.3.798. [DOI] [PubMed] [Google Scholar]
- Simons DJ, Woolsey TA. Morphology of Golgi-Cox-impregnated barrel neurons in rat SmI cortex. J Comp Neurol. 1984;230:119–132. doi: 10.1002/cne.902300111. [DOI] [PubMed] [Google Scholar]
- Sun QQ, Huguenard JR, Prince DA. Barrel cortex microcircuits: thalamocortical feedforward inhibition in spiny stellate cells is mediated by a small number of fast-spiking interneurons. J Neurosci. 2006;26:1219–1230. doi: 10.1523/JNEUROSCI.4727-04.2006. [DOI] [PMC free article] [PubMed] [Google Scholar]
- Swadlow HA. Fast-spike interneurons and feedforward inhibition in awake sensory neocortex. Cereb Cortex. 2003;13:25–32. doi: 10.1093/cercor/13.1.25. [DOI] [PubMed] [Google Scholar]
- Swadlow HA, Gusev AG. The influence of single VB thalamocortical impulses on barrel columns of rabbit somatosensory cortex. J Neurophysiol. 2000;83:2802–2813. doi: 10.1152/jn.2000.83.5.2802. [DOI] [PubMed] [Google Scholar]
- Swadlow HA, Gusev AG. Receptive-field construction in cortical inhibitory interneurons. Nat Neurosci. 2002;5:403–404. doi: 10.1038/nn847. [DOI] [PubMed] [Google Scholar]
- Swanson GT, Kamboj SK, Cull-Candy SG. Single-channel properties of recombinant AMPA receptors depend on RNA editing, splice variation, and subunit composition. J Neurosci. 1997;17:58–69. doi: 10.1523/JNEUROSCI.17-01-00058.1997. [DOI] [PMC free article] [PubMed] [Google Scholar]
- Wang Y, Gupta A, Toledo-Rodriguez M, Wu CZ, Markram H. Anatomical, physiological, molecular and circuit properties of nest basket cells in the developing somatosensory cortex. Cereb Cortex. 2002;12:395–410. doi: 10.1093/cercor/12.4.395. [DOI] [PubMed] [Google Scholar]
- Wehr M, Zador AM. Balanced inhibition underlies tuning and sharpens spike timing in auditory cortex. Nature. 2003;426:442–446. doi: 10.1038/nature02116. [DOI] [PubMed] [Google Scholar]
- White EL, Rock MP. Three-dimensional aspects and synaptic relationships of a Golgi-impregnated spiny stellate cell reconstructed from serial thin sections. J Neurocytol. 1980;9:615–636. doi: 10.1007/BF01205029. [DOI] [PubMed] [Google Scholar]
- Wilent WB, Contreras D. Synaptic responses to whisker deflections in rat barrel cortex as a function of cortical layer and stimulus intensity. J Neurosci. 2004;24:3985–3998. doi: 10.1523/JNEUROSCI.5782-03.2004. [DOI] [PMC free article] [PubMed] [Google Scholar]
- Wilent WB, Contreras D. Dynamics of excitation and inhibition underlying stimulus selectivity in rat somatosensory cortex. Nat Neurosci. 2005;8:1364–1370. doi: 10.1038/nn1545. [DOI] [PubMed] [Google Scholar]
- Zhang ZW, Deschênes M. Projections to layer VI of the posteromedial barrel field in the rat: a reappraisal of the role of corticothalamic pathways. Cereb Cortex. 1998;8:428–436. doi: 10.1093/cercor/8.5.428. [DOI] [PubMed] [Google Scholar]