

Abstract
Objective
Obesity promotes macrophage infiltration into adipose tissue and is associated with increases in several cardiovascular diseases. Infusion of angiotensin II (AngII) to mice induces formation of abdominal aortic aneurysms (AAAs) with profound medial and adventitial macrophage infiltration. We sought to determine if obesity promotes macrophage infiltration and proinflammatory cytokines in periaortic adipose tissue surrounding abdominal aortas and increases AngII-induced AAAs.
Methods and Results
Hypertrophied white adipocytes surrounded abdominal aortas while brown adipocytes surrounded thoracic aortas of obese mice. mRNA abundance of macrophage proinflammatory chemokines and their receptors were elevated with obesity to a greater extent in abdominal compared to thoracic periaortic adipose tissue. Periaortic adipose tissue explants surrounding abdominal aortas of obese mice released greater concentrations of MCP-1 and promoted more macrophage migration than explants from thoracic aortas. Male C57BL/6 mice were fed a high fat (HF) diet for 1, 2, or 4 months and then infused with AngII (1,000 ng/kg/min) for 28 days. AAA incidence increased progressively with the duration of HF feeding (18%, 36% and 60%, respectively). Similarly, AngII-infused ob/ob mice exhibited increased AAAs compared to lean controls (76% compared to 32%, respectively, P<0.05). Infusion of AngII to obese mice promoted further macrophage infiltration into periaortic and visceral adipose tissue, and obese mice exhibiting AAAs had greater macrophage content in visceral adipose tissue than mice not developing AAAs.
Conclusions
Increased macrophage accumulation in periaortic adipose tissue surrounding abdominal aortas of AngII-infused obese mice is associated with enhanced AAA formation.
Keywords: obesity, angiotensin II, abdominal aortic aneurysm
Obesity, especially in the form of abdominal adipose deposition, increases the risk of cardiovascular-related mortality.1,2 Virtually all arteries, including the aorta, are surrounded by significant amounts of perivascular adipose tissue. Recent studies suggest that perivascular adipose tissue may be a source of inflammatory cytokines and/or adipokines, contributing to a strong association between obesity and vascular diseases.3-5 Importantly, a role for macrophage infiltration into perivascular adipose tissue and increased elaboration of proinflammatory cytokines as an initiator of vascular disease has been suggested3,5-7, but not extensively examined.
Abdominal aortic aneurysms (AAAs) are a common vascular disease that affects 4-9% of the adult male population and account for at least 15,000 deaths per year in the United States.8 There are no proven pharmacologic treatments for AAAs and therapeutic choices are restricted to surgery. Clinical risk factors for AAA formation include tobacco use, male sex, age (>60 years), and family history.9-11 As far back as 1969, population based studies examining the etiology of AAA formation demonstrated that the development of AAAs was associated with increased body weight.12,13 Recently, a population study of greater than 12,000 men confirmed an index of obesity (waist circumference and waist-to-hip ratio) independently associates with AAA formation.14 Approximately two-thirds of the United States adult population is overweight or obese (as defined by BMI 25-29.9 or >30, respectively15). With obesity at epidemic proportions and AAA incidence on the rise, it is important to understand mechanisms by which excess adiposity may predispose to AAA formation. Moreover, since obesity predisposes to several disorders of the metabolic syndrome, including insulin resistance, hypertension, and dyslipidemias, it is important to define if these metabolic disturbances contribute to enhanced AAA risk in obese patients.
We have previously demonstrated that chronic infusion of AngII to hyperlipidemic mice results in aneurysm formation in suprarenal abdominal aortas of  80% of male mice.16,17 The earliest cellular change noted following initiation of AngII infusion to apolipoprotein E deficient mice was medial accumulation of macrophages in AAA-prone areas.18 Macrophage accumulation was also pronounced in the adventitia of suprarenal aortas following AngII-infusion13, consistent with peri-adventitial entry of leukocytes into the vascular wall. Currently, mechanisms for the regional localization of AAAs to the suprarenal region of abdominal aortas from AngII-infused mice are unknown.
Previous studies demonstrated that deficiency of CCR2 in bone marrow-derived stem cells reduced AngII-induced atherosclerosis and AAAs, demonstrating a critical role for macrophages in vascular pathologies elicited by infusion of AngII.19 Thus, manipulations and/or conditions influencing macrophage recruitment to the vascular wall would be anticipated to have marked effects on AngII-induced AAA formation. In the current study, we hypothesized that obesity-induced increases in macrophage infiltration and proinflammatory cytokine expression in periaortic adipose tissue surrounding abdominal aortas enhances AngII-induced AAAs. In addition, we defined whether obese mice exhibiting AngII-induced AAAs exhibit enhanced macrophage infiltration to adipose tissue. Finally, we utilized different models of obesity and/or hyperlipidemia to dissect out mechanisms contributing to enhanced AAA risk with obesity.
Methods
Animals and diets
Male C57BL/6 mice (2 months of age; the Jackson Laboratory, Bar Harbor, ME) were fed either normal laboratory diet (5% kcal as fat for 4 months) or a high fat diet (HF; D12492, 60% kcal from fat; Research Diets, New Brunswick, NJ) for 1, 2, or 4 months prior to, and during, infusion of AngII. Mice were staggered into the experimental design for HF feeding such that all mice were 6 months of age at study endpoint. Mice in the normal diet group were age-matched to the longest duration of HF feeding (4 months) to control for effects of aging. A group of male LDLr-/- mice (2 months of age, from a breeding colony of mice originally obtained from the Jackson Laboratory) were fed the HF diet for 4 months prior to and during infusion of AngII. In separate studies, male leptin-deficient ob/ob mice and heterozygous ob/+ littermates (n=35 per strain; 2 months of age) were obtained from the Jackson Laboratory and were fed normal laboratory diet ad libitum prior to, and during, infusion of either saline or AngII. All procedures involving animals were approved by the Institutional Animal Care and Use Committee at the University of Kentucky.
AngII infusion
AngII (1,000 ng/kg/min) or saline was infused by subcutaneously implanted Alzet minipumps (Model 2004) for 28 days as described previously.17,20,21
Blood pressure measurements
Systolic blood pressure was measured on conscious, restrained mice using tail cuff systems as described previously.21
Other methods
For measurements of serum and plasma components, glucose tolerance tests, quantification of AAAs, histologic analysis of periaortic adipose tissue, quantification of mRNA abundance in periaortic adipose tissue, macrophage migration using transwell assays, flow cytometric analysis of macrophage infiltration into visceral adipose tissue tissue and immunostaining in aneurysm tissue sections please see http://atvb.ahajournals.org, Supplemental Methods.
Statistical analyses
Data are presented as the mean and SEM. For statistical analyses performed on individual data sets, please see http://atvb.ahajournals.org, Supplemental Methods.
Results
Obesity promotes macrophage infiltration and proinflammatory cytokine expression in periaortic adipose tissue: differences between abdominal versus thoracic periaortic adipose tissue
Periaortic adipose tissue surrounding thoracic aortas differs in gross appearance from that surrounding abdominal aortas (Figure 1). Thoracic aortas from lean ob/+ mice were surrounded by multilocular brown adipocytes in close proximity to aortic adventitia (Figure 1). In contrast, abdominal aortas were surrounded by a mixture of cells, with a preponderance of unilocular white adipocytes (Figure 1). In tissue sections from ob/ob mice, adipocytes surrounding thoracic and abdominal aortas were markedly hypertrophied, but retained their adipocyte phenotype (Figure 1).
Figure 1. Regional differences in adipocyte morphology in periaortic adipose tissue surrounding thoracic versus abdominal aortas of lean and obese mice.

Top, Panel A illustrates aortic regions with intact periaortic adipose tissue (thoracic and abdominal) dissected for analyses from lean (ob/+) and obese (ob/ob) mice. Thoracic (B,C) and abdominal (D,E) aortic sections (5  m) from ob/+ (B,D) and ob/ob (C,E) mice were stained with hematoxylin and eosin (H&E). Adipose tissue surrounding thoracic aortas was composed of multilocular brown adipocytes (B: 40X; insets: 10X). In contrast, adipocytes surrounding abdominal aortas were primarily unilocular (C: 40X; insets: 10X). With obesity (C,F), both brown and white adipocytes surrounding aortas were hypertrophied.
Given morphological differences in adipocytes surrounding thoracic versus abdominal aortas, we examined effects of obesity (4 months of HF feeding) on markers of macrophage activation states, chemokine release and macrophage migration in periaortic adipose tissue from these different aortic regions. We used mice with HF-fed obesity, rather than obesity from leptin deficiency, to contrast proteins expressed to a differing extent in brown (UCP-1) versus white (leptin) adipocytes. In LF-fed mice, mRNA abundance of leptin was similar in periaortic adipose tissue surrounding thoracic compared to abdominal aortas ( Ct: thoracic, 0.42 ± 0.16; abdominal 0.56 ± 0.16). However, obesity resulted in a greater fold induction of leptin mRNA abundance in abdominal (47-fold; Figure 2) than thoracic periaortic adipose tissue (16-fold). Similarly, UCP-1 mRNA abundance was similar in periaortic adipose tissue surrounding thoracic versus abdominal aortas of LF-fed mice (
 Ct: thoracic, 0.73 ± 0.10; abdominal, 0.61 ± 0.08). Interestingly, UCP-1 mRNA abundance increased in periaortic adipose tissue surrounding thoracic aortas of obese mice (3-fold), but was reduced by obesity in abdominal periaortic adipose tissue (2-fold).
Figure 2. Effects of obesity on mRNA abundance of macrophage markers and proinflammatory chemokines in periaortic adipose tissue surrounding thoracic versus abdominal aortas.

Periaortic adipose tissue surrounding thoracic versus abdominal aortas of LF- and HF-fed mice (4 months) was analyzed for mRNA abundance by real-time PCR. A, mRNA abundance in periaortic adipose tissue surrounding thoracic aortas from LF and HF-fed mice. B, mRNA abundance in periaortic adipose tissue surrounding abdominal aortas of LF and HF-fed mice. F4/80 mRNA abundance increased to a greater extent in periaortic adipose tissue surrounding abdominal than thoracic aortas. Similarly, obesity-induced elevations in mRNA abundance of CCL2, CCR2, and leptin were greater in adipose tissue surrounding abdominal than thoracic aortas. mRNA abundance of UCP-1 was increased by obesity in thoracic periaortic adipose tissue, but decreased in abdominal. Data are mean ± SEM from n = 5 mice/group. *, P < 0.05 compared to LF.
Periaortic adipose tissue surrounding abdominal aortas of obese mice exhibited a greater fold increase in mRNA abundance of F4/80 compared to thoracic periaortic adipose tissue (9-versus 2-fold, respectively, Figure 2). Moreover, mRNA abundance of MCP1 and CCR2, cytokines and/or receptors characteristic of M1 classically activated macrophages22, were increased to a greater extent in abdominal versus thoracic periaortic adipose tissue from obese mice (Figure 2). However, other proinflammatory factors, including NFκB and IL6 receptor α, were not altered in adipose explants from either region with HF feeding.
To determine if these differences in periaortic adipose tissue surrounding thoracic versus abdominal aortas influence chemokine expression and macrophage infiltration, periaortic adipose tissue from 4 month LF and HF-fed mice was separated into thoracic and abdominal, and adipose tissue explants from each of these regions cultured to obtain conditioned media. Periaortic adipose explants from abdominal aortas of HF-fed mice released greater concentrations of MCP-1 compared to explants from thoracic aortas of HF-fed mice (Figure 3A). In addition, periaortic adipose explants from abdominal aortas of HF-fed mice released greater MCP-1 concentrations compared to abdominal adipose explants from LF-fed mice. To define whether elevations in MCP-1 release from periaortic adipose explants of abdominal aortas influenced macrophage migration, conditioned media from explants was used as a stimulus for migration of mouse peritoneal macrophages (MPMs) in transwell assays. In LF-fed mice, media from adipose tissue explants surrounding thoracic and abdominal aortas increased MPM migration by the same percent (Figure 3B). With HF feeding, periaortic adipose explants surrounding abdominal aortas increased MPM migration more than abdominal adipose explants from LF-fed mice.
Figure 3. MCP-1 release (A) and macrophage migration (B) in periaortic adipose tissue explants from abdominal aortas are increased by obesity.
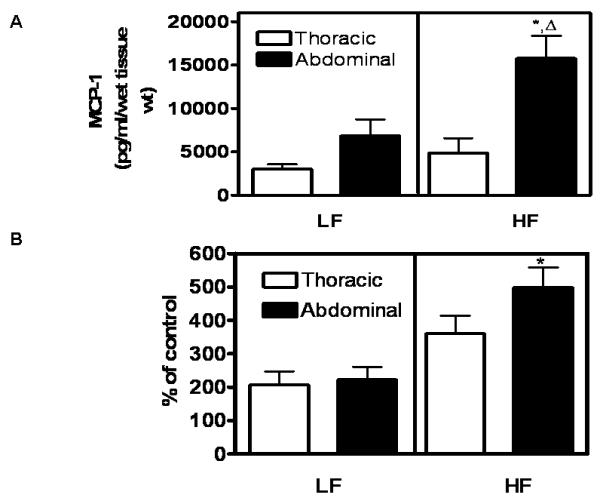
Periaortic adipose tissue explants were prepared from thoracic or abdominal aortas of LF- and HF-fed mice (4 months) and incubated as described. A, MCP-1 release into the media was increased in periaortic explants of abdominal aortas from HF compared to LF-fed mice. There was no effect of HF-feeding on MCP-1 release from thoracic periaortic adipose tissue explants. B, Mouse peritoneal macrophage migration was increased by conditioned media from abdominal periaortic adipose explants of HF compared to LF-fed mice.*, significantly different from LF abdominal.  , significantly different from HF-thoracic. Data are mean ± SEM from n = 5 mice/group.
Diet-induced and genetic obesity promotes AngII-induced AAA formation
Since obesity increased chemokine release and macrophage infiltration in periaortic adipose tissue surrounding abdominal aortas, the aortic region where AAAs form when mice are infused with AngII, we examined effects of diet and genetic obesity on AngII-induced AAAs. Use of mice with diet- or genetic-obesity enabled definition of contributions of the HF diet to AAA risk. Also, in studies with diet-induced obesity we included LDLr-/- mice fed the HF diet for 4 months prior to infusion of AngII, since this hypercholesterolemic model has been demonstrated previously to exhibit AngII-induced AAAs17, and controlled for effects of hypercholesterolemia on AAA risk.
Male C57BL/6 mice were fed a LF (4 months) or HF diet for 1, 2, or 4 months to produce differing durations and magnitudes of obesity prior to the initiation of AngII infusion. Body weight gain increased with duration of HF-feeding in AngII-infused C57BL/6 mice and was significantly increased compared to control at 4 months (Table 1). Increases in body weight in AngII-infused HF-fed C57BL/6 mice were paralleled by increases in retroperitoneal adipose tissue mass (Table 1) and elevations in plasma concentrations of leptin and resistin (Supplemental Table I). The duration of HF-feeding (1, 2, or 4 months) of AngII-infused C57BL/6 mice did not significantly alter serum cholesterol concentrations compared to control (Supplemental Figure IA). However, AngII-infused LDLr-/- mice fed the HF diet exhibited marked elevations in serum cholesterol concentrations compared to control- and HF-fed C57BL/6 mice. In HF-fed C57BL/6 mice (4 month), plasma HDL-cholesterol concentrations were the predominant serum lipoprotein (Supplemental Figure IB); in contrast, HF-fed LDLr-/- mice had a predominance of VLDL- and LDL-cholesterol.
Table 1.
Characteristics of AngII-infused HF-fed C57BL/6 and LDLr-/- mice.
| Body weight gain (g) |
Retroperitoneal adipose (%) |
Blood glucose (mg/dl) |
Plasma renin (ng/ml) |
Systolic BP (mmHg) |
||
|---|---|---|---|---|---|---|
| Pre AngII | Post AngII | |||||
| Control (n=10) | 13.2 ± 0.9 | 1.1 ± 0.1 | 107 ± 7 | 1.20 ± 0.4 | 122 ± 5 | 157 ± 12 † |
| 1 month high fat (n = 11) |
9.8 ± 0.6 | 1.5 ± 0.1 | 104 ± 6 | 3.54 ± 0.9 | 111 ± 6 | 121 ± 7 |
| 2 month high fat (n = 11) |
18.8 ± 1.5 | 1.6 ± 0.2 | 101 ± 6 | 3.02 ± 1.4 | 104 ± 5* | 128 ± 5 † |
| 4 month high fat (n = 25) |
23.8 ± 1.1* | 1.9 ± 0.2* | 109 ± 6 | 1.14 ± 0.4 | 109 ± 1* | 148 ± 4 † |
| LDLr-/-, 4 month high fat (n = 7) |
18.3 ± 1.9 | 1.5 ± 0.3 | 161 ± 15*,** | 1.27 ± 0.4 | 121 ± 5 | 174 ± 7 † |
BP indicates systolic blood pressure. Data are mean ± SEM.
P < 0.001 compared to Control
P < 0.05 compared to other HF groups
P < 0.05 compared to baseline values
Fasting blood glucose concentrations were not influenced by HF feeding in AngII-infused C57BL/6 mice, but were increased in 4 month HF-fed LDLr-/- mice compared to control (Table 1). Plasma renin concentrations were not significantly influenced by HF feeding in any group (Table 1). Systolic blood pressures prior to AngII infusion were decreased in mice fed the HF-diet for 2 or 4 months compared to control (Table 1). Infusion of AngII resulted in an increase in systolic blood pressure in control mice and C57BL/6 and LDLr-/- mice fed HF diets for 4 months compared to baseline (Table 1). In contrast, AngII infusion did not significantly increase systolic blood pressures in 1 month HF-fed C57BL/6 mice.
AAA incidence increased progressively as a function of the duration of HF feeding in C57BL/6 mice (18, 36, and 60% incidence for 1, 2, and 4 months of HF-feeding, respectively; Figure 4A, Supplemental Table II). AAA incidence was significantly increased in 4 month HF-fed C57BL/6 mice (P < 0.05) compared to control (22%) and 1 month HF-fed groups. Moreover, AAA incidence was similar in 4 month HF-fed C57BL/6 and LDLr-/- mice (60 and 57%, respectively).
Figure 4. Diet-induced and genetic obesity increase AngII-induced AAAs.

A, C57BL/6 mice were fed control or HF diets for 1, 2 or 4 months. Age-matched LDLr-/- mice were fed the HF diet for 4 months. AAA incidence increased progressively with longer durations of HF-feeding in C57BL/6 mice (18%, 36% and 60% AAA incidence, respectively). AAA incidence was similar in both C57BL/6 and LDLr-/- mice fed a HF diet for 4 months (57% and 60%, respectively). B, AAA incidence was increased in ob/ob (76%) compared to ob/+ mice (32%). Data are mean ± SEM from n = 10/group. *, P < 0.05 vs ob/+. **, P < 0.05 compared to control, 1 month HF.
To define effects of genetic obesity on AAAs, independent of HF-feeding, we infused either saline or AngII into ob/+ and leptin-deficient (ob/ob) mice fed normal diet. Systolic blood pressure increased equally in ob/+ and ob/ob mice infused with AngII compared to saline (20 and 19% increase, respectively, Table 2). Leptin-deficient ob/ob mice exhibited characteristics of the metabolic syndrome, including increased body weight, visceral adiposity, and elevated systemic concentrations of glucose, cholesterol (Supplemental Table III), insulin and resistin, compared to lean ob/+ controls (Supplemental Table I). Plasma HDL-cholesterol concentrations predominated in sera from ob/+ mice (saline- and AngII-infused), while ob/ob mice had both HDL and LDL-cholesterol (Supplemental Figure IC). Plasma renin concentrations were increased with obesity, but were decreased by AngII infusion in both ob/ob and ob/+ mice (Table 2). Infusion of AngII decreased body weight in ob/ob, but not in ob/+ mice. Interestingly, AngII infusion decreased fasting blood glucose concentrations in both strains (Table 2) and improved glucose tolerance in ob/ob mice, quantified by area under the curve (Supplemental Figure II).
Similar to mice with diet-induced obesity, ob/ob mice exhibited a significant increase in AAA incidence compared to lean ob/+ controls (76% versus 32%, respectively, P< 0.05; Figure 4B, Supplemental Table II). In addition, mice with genetic obesity had a greater incidence of aortic rupture (32% of obese ob/ob mice compared to 4% of lean ob/+ mice). To determine whether improved glucose tolerance or increased body weight predisposed to enhanced AAA formation in ob/ob mice, we calculated the HOMA-IR (an index of insulin resistance;23,24) for ob/+ and ob/ob AngII-infused mice and fit a logistic regression model with AAA as the response variable and HOMA-IR values and/or body weight as explanatory variables. Mean HOMA-IR values for AngII-infused ob/ob and ob/+ mice were 36 ± 9 and 3 ± 1, respectively (p=0.003). Logistic regression analysis demonstrated that body weight (odds ratio [OR], 1.29; 95% confidence interval [CI], 1.07 to 1.57; p=0.008), but not the HOMA-IR value (OR, 0.94; 95% CI, 0.86 to 1.02; p=0.144), emerged as a significant predictor of AAA formation.
Infusion of AngII promotes inflammation in aneurysmal and adipose tissue of obese mice
In AAA tissue sections from AngII-infused ob/ob mice, macrophage immunostaining was present in the adventitia and surrounding adipose tissue (Figure 5C,D). To determine if infusion of AngII promoted further inflammation in adipose tissue, we isolated the stromal vascular fraction (SVF) from retroperitoneal visceral adipose tissue of saline and AngII-infused HF-fed (4 month) C57BL/6 mice, labeled macrophages using a CD11b antibody conjugated to Alexa488, and assessed fluorescence with flow cytometry. We used retroperitoneal adipose as a visceral depot in close proximity to abdominal aortas. Total macrophage content of the SVF (CD11b+cells) increased in AngII compared to saline-infused HF-fed mice (60 ± 1 compared to 48 ± 2% of cells, respectively; p<0.05; Figure 5E). Moreover, mice exhibiting AAAs in response to AngII infusion (AAA) had a greater percentage of newly recruited macrophages (CD11b+/total macrophages) in SVF (no AAA; 90 ± 1 compared to 49 ± 12%, respectively; p<0.05; Figure 5C).
Figure 5. Infusion of AngII promotes inflammation in aneurysms and adipose tissue from obese mice.

A-D, Aneurysmal sections with isotype-matched IgG control (A, B) and cd68-positive immunostaining in an aneurysmal tissue section from an AngII-infused ob/ob mice (C, D). Macrophages are present in adventitia and periaortic adipose tissue. Boxes represent regions illustrated at higher magnification in B, D. E, AngII infusion promotes macrophage infiltration into the stromal vascular fraction of retroperitoneal white adipose tissue from ob/ob mice (n = 5/group). F, Macrophage infiltration into the stromal vascular fraction of white adipose tissue from mice who developed AAAs compared to mice that did not develop AAAs (n = 4 no AAA; n = 3 AAA). Data are mean ± SEM; *, denotes significantly different from saline or no AAA, P < 0.05.
Discussion
The major findings of the present study are that obesity increases macrophage infiltration and cytokine expression in periaortic adipose tissue surrounding abdominal aortas and markedly enhances AngII-induced AAA formation. Regional differences in adipocytes, with hypertrophied white adipocytes surrounding abdominal aortas of obese mice, were associated with increased abundance of macrophages, proinflammatory chemokines and their receptors. Moreover, MCP-1 release and macrophage migration were increased in periaortic adipose explants from abdominal compared to thoracic aortas of obese mice. Mice with either diet-induced or genetic obesity exhibited markedly enhanced AAA formation, demonstrating that HF feeding is not required to increase AAA risk from obesity. AAA incidence was similar in HF-fed C57BL/6 and LDLr-/- mice, despite a 10-fold difference in serum cholesterol concentrations, demonstrating that hypercholesterolemia is not a major contributor to enhanced AAA risk from obesity. Moreover, AAA incidence correlated to body weight, but not to measures of insulin resistance, minimizing contributions of insulin sensitivity to enhanced AAA risk. AAA tissue sections from obese mice exhibited macrophage immunostaining in adventitial and periaortic adipose tissue. Finally, obese mice with AAAs had a greater percentage of newly recruited macrophages in visceral adipose tissue. These results demonstrate that obesity and/or AngII promote inflammation in periaortic adipose tissue surrounding abdominal aortas and increase susceptibility to AngII-induced AAAs.
Previous results demonstrated that AngII-induced AAA formation exhibits adventitial and medial macrophage infiltration early in aneurysm development.18 Moreover, deficiency of CCR2 in bone marrow derived stem cells reduced AngII-induced AAAs25,26, demonstrating the pivotal role of leukocytes in this AngII-induced vascular pathology. However, it is unclear whether leukocytes enter the vascular wall from the intimal or peri-adventitial spaces upon infusion of AngII. Obesity generates a state of low grade inflammation characterized by increases in plasma concentrations of inflammatory factors and infiltration of macrophages into white adipose tissue.27-30 Previous studies demonstrated an increase in macrophage infiltration into periaortic adipose tissue surrounding human coronary arteries from patients with atherosclerosis.6 Moreover, HF-feeding in rats resulted in increased mass of white adipose tissue surrounding abdominal aortas.7 Recent studies demonstrated that perivascular adipocytes surrounding human coronary arteries are an integral part of the blood vessel wall since adipocytes invaded the adventitia.3 In addition, perivascular adipocytes surrounding human coronary arteries had increased expression of inflammatory cytokines compared to other adipose depots. Our results extend these findings by demonstrating that diet-induced obesity in mice results in an increase in chemokine release, macrophage infiltration and proinflammatory cytokine expression in periaortic adipose tissue. Moreover, effects of obesity on periaortic adipose tissue differed regionally, potentially related to the type of adipocytes surrounding different regions of the aorta. Collectively, these findings demonstrate that perivascular adipose tissue exhibits inflammation similar to other white adipose depots with obesity, and support a role for this localized inflammation in enhanced AAA risk from obesity.
To our knowledge, this is the first study to demonstrate that obesity promotes mRNA abundance and release of chemokines and infiltration of macrophages more readily in adipose tissue surrounding abdominal compared to thoracic aortas. The type of adipocytes surrounding different aortic regions may mediate effects of obesity. Recent studies using transgenic aP2-Cre recombinase over expression of MCP-1 in mouse adipose tissue demonstrated that while both brown and white adipose tissue exhibited robust increases in MCP-1 expression, macrophage markers were increased to a greater extent in white than brown adipose tissue.30 Collectively, these results suggest that the type of adipocytes surrounding aortic regions and the differential ability of brown versus white adipocytes to recruit macrophages may localize AAAs to abdominal aortas of AngII-infused mice.
We utilized a HF diet as one mode of inducing obesity and established that durations of HF feeding that increase adiposity are associated with enhanced susceptibility to AngII-induced AAAs. The use of C57BL/6 mice, with a predominance of HDL-cholesterol31, demonstrates that changes in lipoprotein distributions with obesity do not mediate increased AAA risk. Moreover, since obese C57BL/6 mice exhibited an AAA incidence similar to LDLr-/- mice, despite  10-fold lower serum cholesterol concentrations, dyslipidemia was not a major contributor to enhanced AAA risk in obese mice.
Obesity develops in ob/ob mice from hyperphagia on normal mouse diet without enrichment with either dietary fat or cholesterol. Similar to previous reports in LDLr-/- (HF-fed) or apolipoprotein E deficient mice17,21, ob/ob mice exhibited a high incidence of AAA formation. These results demonstrate that elevated dietary fat is not a requirement for increasing AAA risk. Moreover, since hyperleptinemic HF-fed mice as well as leptin deficient mice both exhibited enhanced AAA risk, then effects of obesity to promote AAA risk are independent of plasma leptin concentrations. Finally, since all mice infused with AngII exhibited similar increases in blood pressure, but disparate AAA incidences, then hypertension is not a mechanism for enhanced AAA risk from obesity.
An unexpected result of the present study was the effect of AngII infusion to decrease fasting blood glucose and improve glucose tolerance in ob/ob mice. The reduction in body weight in ob/ob mice infused with AngII may have contributed to improved insulin sensitivity. Diabetes has been reported as a negative risk factor for human AAA formation.10,32 However, most studies examining diabetes and AAA risk have focused on hyperglycemia, and have not segregated out influences from type 1 versus type 2 diabetes. If diabetes is protective against AAA formation, then it is plausible that enhanced AAA formation in ob/ob mice in this study resulted from improved insulin sensitivity upon infusion of AngII. However, a contribution of changes in insulin sensitivity to the observed increase in AAA formation in obese mice is unlikely, since body weight and not insulin sensitivity was a significant predictor of AAA formation. These results demonstrate that body weight, but not insulin sensitivity, is associated with enhanced AAA risk from obesity.
An important finding of this study was the localization of macrophages to periaortic adipose tissue surrounding aneurysmal tissue from AngII-infused obese mice. Moreover, while a proinflammatory effect of AngII to promote macrophage infiltration has been demonstrated to contribute to atherosclerosis and AAA formation18,19, this is the first report demonstrating that infusion of AngII promotes macrophage infiltration into adipose tissue. Interestingly, abdominal adipose tissue macrophage content was increased in mice which developed AAAs, suggesting a pivotal role for adipose inflammation in aneurysm development.
In summary, results from this study demonstrate that obesity promotes AngII-induced AAAs. Enhanced AAA risk from obesity was not influenced by the mode of obesity induction, manipulation of serum cholesterol concentrations or lipoprotein distributions, changes in insulin sensitivity, blood pressure responses to AngII, or by leptin. In contrast, regional differences in periaortic adipocytes and their differential ability to promote chemokine release, macrophage infiltration and proinflammatory cytokine expression related to enhanced AAA risk from obesity. These results suggest that localized inflammation in periaortic and/or visceral abdominal adipose tissue with obesity, or in response to infusion of AngII, may provide a macrophage rich milieu favoring entry into the aortic media to promote AAA formation. Future studies should explore weight loss by dietary manipulation as a non-pharmacologic life-style approach to blunt AAA progression. Moreover, since AngII infusion increased macrophage infiltration into adipose tissue, future studies should define whether these effects are attributed to effects of AngII at adipocyte angiotensin receptors.
Supplementary Material
Supplemental Table I. Plasma concentrations of insulin and adipokines from diet-induced and ob/ob mice.
*, P<0.05 compared to Control; **, P<0.05 compared to ob/+; †, P<0.01 compared to ob/+
Supplemental Table II. AAA Incidence Summary Table
Supplemental Table III. Characteristics of ob/ob and ob/+ mice infused with either saline or AngII.
Data are mean ± SEM. *, P < 0.05 compared to saline-infused, within genotype;
†, P < 0.01 compared to ob/+, within treatment
Supplemental Table IV. Primer sequences.
Supplemental Figure I. Serum cholesterol concentrations and lipoprotein cholesterol distributions in mice with diet or genetic obesity. A, Total serum cholesterol concentrations in C57BL/6 mice fed a LF (4 month) or HF diet for 1, 2 or 4 months prior to AngII infusion (28 days). Serum cholesterol concentrations were not different in LF versus HF-fed mice at any time point. LDLr-/- mice fed the HF diet for 4 months had increased serum cholesterol concentrations compared to LF or HF-fed mice. Data are mean + SEM from n = 10 mice/group. *, significantly different from 4 month HF-fed mice. B,C, Lipoprotein-cholesterol distributions of 4 month HF-fed C57BL/6 or LDLr-/- mice (B) or genetically obese (ob/ob) versus lean (ob/+) mice (C) indicates the increase in total cholesterol of obese mice is due to an elevation of LDL-cholesterol. Values were obtained from n = 5 mice/group run individually. Data are mean ± SEM.
Supplemental Figure II. Effect of obesity and AngII infusion on glucose tolerance. Glucose regulation in ob/+ and ob/ob saline-(n = 5 per strain) and AngII- (n = 10 per strain) infused mice. (A) Intraperitoneal glucose tolerance test (IPGTT): Blood glucose was measured at baseline. After an i.p. injection of 20% glucose (2mg/g), blood glucose values were monitored for 120 minutes. (B) Results quantified by area under the curve; ob/ob mice exhibit reductions in glucose tolerance that is improved by infusion of AngII. Data are mean ± SEM; †, P < 0.05 compared to ob/+; *, P < 0.05 compared to Saline.
Acknowledgments
a) Sources of funding: This work was supported by the National Institutes of Health (R01 HL-73085 (LAC) and P01 HL080100 (LAC, AD)).
b) Acknowledgments: We acknowledge the technical assistance of Ms. Victoria English for measurement of plasma renin concentrations.
Footnotes
c) Disclosures: None
References
- 1.Despres JP, Moorjani S, Lupien PJ, Tremblay A, Nadeau A, Bouchard C. Regional distribution of body fat, plasma lipoproteins, and cardiovascular disease. Arteriosclerosis. 1990;10:497–511. doi: 10.1161/01.atv.10.4.497. [DOI] [PubMed] [Google Scholar]
- 2.Nieves DJ, Cnop M, Retzlaff B, Walden CE, Brunzell JD, Knopp RH, Kahn SE. The atherogenic lipoprotein profile associated with obesity and insulin resistance is largely attributable to intra-abdominal fat. Diabetes. 2003;52:172–179. doi: 10.2337/diabetes.52.1.172. [DOI] [PubMed] [Google Scholar]
- 3.Chatterjee TK, Stoll LL, Denning GM, Harrelson A, Blomkalns AL, Idelman G, Rothenberg FG, Neltner B, Romig-Martin SA, Dickson EW, Rudich S, Weintraub NL. Proinflammatory phenotype of perivascular adipocytes: influence of high-fat feeding. Circ Res. 2009;104:541–9. doi: 10.1161/CIRCRESAHA.108.182998. [DOI] [PMC free article] [PubMed] [Google Scholar]
- 4.Barandier C, Montani JP, Yang Z. Mature adipocytes and perivascular adipose tissue stimulate vascular smooth muscle cell proliferation: effects of aging and obesity. Am J Physiol Heart Circ Physiol. 2005;289:H1807–13. doi: 10.1152/ajpheart.01259.2004. [DOI] [PubMed] [Google Scholar]
- 5.Eringa EC, Bakker W, Smulders YM, Serne EH, Yudkin JS, Stehouwer CD. Regulation of vascular function and insulin sensitivity by adipose tissue: focus on perivascular adipose tissue. Microcirculation. 2007;14:389–402. doi: 10.1080/10739680701303584. [DOI] [PubMed] [Google Scholar]
- 6.Vela D, Buja LM, Madjid M, Burke A, Naghavi M, Willerson JT, Casscells SW, Litovsky S. The role of periadventitial fat in atherosclerosis. Arch Pathol Lab Med. 2007;131:481–487. doi: 10.5858/2007-131-481-TROPFI. [DOI] [PubMed] [Google Scholar]
- 7.Henrichot E, Juge-Aubry CE, Pernin A, Pache JC, Velebit V, Dayer JM, Meda P, Chizzolini C, Meier CA. Production of chemokines by perivascular adipose tissue: a role in the pathogenesis of atherosclerosis? Arterioscler Thromb Vasc Biol. 2005;25:2594–9. doi: 10.1161/01.ATV.0000188508.40052.35. [DOI] [PubMed] [Google Scholar]
- 8.Upchurch GR, Jr, Schaub TA. Abdominal aortic aneurysm. Am Fam Physician. 2006;73:1198–1204. [PubMed] [Google Scholar]
- 9.Lederle FA, Johnson GR, Wilson SE, Chute EP, Hye RJ, Makaroun MS, Barone GW, Bandyk D, Moneta GL, Makhoul RG. The aneurysm detection and management study screening program: validation cohort and final results. Aneurysm Detection and Management Veterans Affairs Cooperative Study Investigators. Arch Intern Med. 2000;160:1425–1430. doi: 10.1001/archinte.160.10.1425. [DOI] [PubMed] [Google Scholar]
- 10.Pleumeekers HJ, Hoes AW, van der Does E, van Urk H, Hofman A, de Jong PT, Grobbee DE. Aneurysms of the abdominal aorta in older adults. The Rotterdam Study. Am J Epidemiol. 1995;142:1291–1299. doi: 10.1093/oxfordjournals.aje.a117596. [DOI] [PubMed] [Google Scholar]
- 11.Wanhainen A, Bergqvist D, Boman K, Nilsson TK, Rutegard J, Bjorck M. Risk factors associated with abdominal aortic aneurysm: a population-based study with historical and current data. J Vasc Surg. 2005;41:390–396. doi: 10.1016/j.jvs.2005.01.002. [DOI] [PubMed] [Google Scholar]
- 12.Agmon Y, Khandheria BK, Meissner I, Schwartz GL, Sicks JD, Fought AJ, O’Fallon WM, Wiebers DO, Tajik AJ. Is aortic dilatation an atherosclerosis-related process? Clinical, laboratory, and transesophageal echocardiographic correlates of thoracic aortic dimensions in the population with implications for thoracic aortic aneurysm formation. J Am Coll Cardiol. 2003;42:1076–1083. doi: 10.1016/s0735-1097(03)00922-7. [DOI] [PubMed] [Google Scholar]
- 13.Alcorn HG, Wolfson SK, Jr, Sutton-Tyrrell K, Kuller LH, O’Leary D. Risk factors for abdominal aortic aneurysms in older adults enrolled in The Cardiovascular Health Study. Arterioscler Thromb Vasc Biol. 1996;16:963–970. doi: 10.1161/01.atv.16.8.963. [DOI] [PubMed] [Google Scholar]
- 14.Golledge J, Clancy P, Jamrozik K, Norman PE. Obesity, adipokines, and abdominal aortic aneurysm: Health in Men study. Circulation. 2007;116:2275–9. doi: 10.1161/CIRCULATIONAHA.107.717926. [DOI] [PubMed] [Google Scholar]
- 15.Hedley AA, Ogden CL, Johnson CL, Carroll MD, Curtin LR, Flegal KM. Prevalence of overweight and obesity among US children, adolescents, and adults, 1999-2002. JAMA. 2004;291:2847–50. doi: 10.1001/jama.291.23.2847. [DOI] [PubMed] [Google Scholar]
- 16.Cassis LA, Rateri DL, Lu H, Daugherty A. Bone marrow transplantation reveals that recipient AT1a receptors are required to initiate angiotensin II-induced atherosclerosis and aneurysms. Arterioscler Thromb Vasc Biol. 2007;27:380–6. doi: 10.1161/01.ATV.0000254680.71485.92. [DOI] [PubMed] [Google Scholar]
- 17.Daugherty A, Cassis L. Chronic angiotensin II infusion promotes atherogenesis in low density lipoprotein receptor -/- mice. Ann N Y Acad Sci. 1999;892:108–118. doi: 10.1111/j.1749-6632.1999.tb07789.x. [DOI] [PubMed] [Google Scholar]
- 18.Saraff K, Babamusta F, Cassis LA, Daugherty A. Aortic dissection precedes formation of aneurysms and atherosclerosis in angiotensin II-infused, apolipoprotein E-deficient mice. Arterioscler Thromb Vasc Biol. 2003;23:1621–6. doi: 10.1161/01.ATV.0000085631.76095.64. [DOI] [PubMed] [Google Scholar]
- 19.Ishibashi M, Egashira K, Zhao Q, Hiasa K, Ohtani K, Ihara Y, Charo IF, Kura S, Tsuzuki T, Takeshita A, Sunagawa K. Bone marrow-derived monocyte chemoattractant protein-1 receptor CCR2 is critical in angiotensin II-induced acceleration of atherosclerosis and aneurysm formation in hypercholesterolemic mice. Arterioscler Thromb Vasc Biol. 2004;24:e174–8. doi: 10.1161/01.ATV.0000143384.69170.2d. [DOI] [PubMed] [Google Scholar]
- 20.Daugherty A, Cassis L. Angiotensin II-Mediated Development of Vascular Diseases. Trends Cardiovasc Med. 2004;14:117–120. doi: 10.1016/j.tcm.2004.01.002. [DOI] [PubMed] [Google Scholar]
- 21.Daugherty A, Manning MW, Cassis LA. Angiotensin II promotes atherosclerotic lesions and aneurysms in apolipoprotein E-deficient mice. J Clin Invest. 2000;105:1605–1612. doi: 10.1172/JCI7818. [DOI] [PMC free article] [PubMed] [Google Scholar]
- 22.Mantovani A, Sica A, Sozzani S, Allavena P, Vecchi A, Locati M. The chemokine system in diverse forms of macrophage activation and polarization. Trends Immunol. 2004;25:677–86. doi: 10.1016/j.it.2004.09.015. [DOI] [PubMed] [Google Scholar]
- 23.Matthews DR, Hosker JP, Rudenski AS, Naylor BA, Treacher DF, Turner RC. Homeostasis model assessment: insulin resistance and beta-cell function from fasting plasma glucose and insulin concentrations in man. Diabetologia. 1985;28:412–419. doi: 10.1007/BF00280883. [DOI] [PubMed] [Google Scholar]
- 24.Xia Z, Sniderman AD, Cianflone K. Acylation-stimulating protein (ASP) deficiency induces obesity resistance and increased energy expenditure in ob/ob mice. J Biol Chem. 2002;277:45874–45879. doi: 10.1074/jbc.M207281200. [DOI] [PubMed] [Google Scholar]
- 25.Ishibashi M, Egashira K, Zhao Q, Hiasa K, Ohtani K, Ihara Y, Charo IF, Kura S, Tsuzuki T, Takeshita A, Sunagawa K. Bone marrow-derived monocyte chemoattractant protein-1 receptor CCR2 is critical in angiotensin II-induced acceleration of atherosclerosis and aneurysm formation in hypercholesterolemic mice. Arterioscler Thromb Vasc Biol. 2004;24:e174–8. doi: 10.1161/01.ATV.0000143384.69170.2d. [DOI] [PubMed] [Google Scholar]
- 26.Lu H, Rateri DL, Cassis LA, Daugherty A. The role of the renin-angiotensin system in aortic aneurysmal diseases. Curr Hypertens Rep. 2008;10:99–106. doi: 10.1007/s11906-008-0020-3. [DOI] [PMC free article] [PubMed] [Google Scholar]
- 27.Weisberg SP, Hunter D, Huber R, Lemieux J, Slaymaker S, Vaddi K, Charo I, Leibel RL, Ferrante AW., Jr CCR2 modulates inflammatory and metabolic effects of high-fat feeding. J Clin Invest. 2006;116:115–24. doi: 10.1172/JCI24335. [DOI] [PMC free article] [PubMed] [Google Scholar]
- 28.Weisberg SP, McCann D, Desai M, Rosenbaum M, Leibel RL, Ferrante AW., Jr Obesity is associated with macrophage accumulation in adipose tissue. J Clin Invest. 2003;112:1796–808. doi: 10.1172/JCI19246. [DOI] [PMC free article] [PubMed] [Google Scholar]
- 29.Xu H, Barnes GT, Yang Q, Tan G, Yang D, Chou CJ, Sole J, Nichols A, Ross JS, Tartaglia LA, Chen H. Chronic inflammation in fat plays a crucial role in the development of obesity-related insulin resistance. J Clin Invest. 2003;112:1821–1830. doi: 10.1172/JCI19451. [DOI] [PMC free article] [PubMed] [Google Scholar]
- 30.Kamei N, Tobe K, Suzuki R, Ohsugi M, Watanabe T, Kubota N, Ohtsuka-Kowatari N, Kumagai K, Sakamoto K, Kobayashi M, Yamauchi T, Ueki K, Oishi Y, Nishimura S, Manabe I, Hashimoto H, Ohnishi Y, Ogata H, Tokuyama K, Tsunoda M, Ide T, Murakami K, Nagai R, Kadowaki T. Overexpression of monocyte chemoattractant protein-1 in adipose tissues causes macrophage recruitment and insulin resistance. J Biol Chem. 2006;281:26602–14. doi: 10.1074/jbc.M601284200. [DOI] [PubMed] [Google Scholar]
- 31.Jawien J, Nastalek P, Korbut R. Mouse models of experimental atherosclerosis. J Physiol Pharmacol. 2004;55:503–517. [PubMed] [Google Scholar]
- 32.Lederle FA, Johnson GR, Wilson SE, Gordon IL, Chute EP, Littooy FN, Krupski WC, Bandyk D, Barone GW, Graham LM, Hye RJ, Reinke DB. Relationship of age, gender, race, and body size to infrarenal aortic diameter. The Aneurysm Detection and Management (ADAM) Veterans Affairs Cooperative Study Investigators. J Vasc Surg. 1997;26:595–601. doi: 10.1016/s0741-5214(97)70057-0. [DOI] [PubMed] [Google Scholar]
Associated Data
This section collects any data citations, data availability statements, or supplementary materials included in this article.
Supplementary Materials
Supplemental Table I. Plasma concentrations of insulin and adipokines from diet-induced and ob/ob mice.
*, P<0.05 compared to Control; **, P<0.05 compared to ob/+; †, P<0.01 compared to ob/+
Supplemental Table II. AAA Incidence Summary Table
Supplemental Table III. Characteristics of ob/ob and ob/+ mice infused with either saline or AngII.
Data are mean ± SEM. *, P < 0.05 compared to saline-infused, within genotype;
†, P < 0.01 compared to ob/+, within treatment
Supplemental Table IV. Primer sequences.
Supplemental Figure I. Serum cholesterol concentrations and lipoprotein cholesterol distributions in mice with diet or genetic obesity. A, Total serum cholesterol concentrations in C57BL/6 mice fed a LF (4 month) or HF diet for 1, 2 or 4 months prior to AngII infusion (28 days). Serum cholesterol concentrations were not different in LF versus HF-fed mice at any time point. LDLr-/- mice fed the HF diet for 4 months had increased serum cholesterol concentrations compared to LF or HF-fed mice. Data are mean + SEM from n = 10 mice/group. *, significantly different from 4 month HF-fed mice. B,C, Lipoprotein-cholesterol distributions of 4 month HF-fed C57BL/6 or LDLr-/- mice (B) or genetically obese (ob/ob) versus lean (ob/+) mice (C) indicates the increase in total cholesterol of obese mice is due to an elevation of LDL-cholesterol. Values were obtained from n = 5 mice/group run individually. Data are mean ± SEM.
Supplemental Figure II. Effect of obesity and AngII infusion on glucose tolerance. Glucose regulation in ob/+ and ob/ob saline-(n = 5 per strain) and AngII- (n = 10 per strain) infused mice. (A) Intraperitoneal glucose tolerance test (IPGTT): Blood glucose was measured at baseline. After an i.p. injection of 20% glucose (2mg/g), blood glucose values were monitored for 120 minutes. (B) Results quantified by area under the curve; ob/ob mice exhibit reductions in glucose tolerance that is improved by infusion of AngII. Data are mean ± SEM; †, P < 0.05 compared to ob/+; *, P < 0.05 compared to Saline.