Abstract
Optical label-free detection avoids the cost and complexity of fluorescence and radio labeling while providing accurate quantitative and kinetic results. We have developed a new optical label-free sensor called the liquid core optical ring resonator (LCORR). The LCORR integrates optical ring resonator sensors into the microfluidic delivery system by using glass capillaries with a thin wall. The LCORR is capable of performing refractive index detection on liquid samples, as well as bio/chemical analyte detection down to detection limits on the scale of pg/mm2.
Keywords: Optical ring resonator, LCORR, whispering gallery modes, refractive index detection, protease detection, DNA sequence detection
1. Introduction
The liquid core optical ring resonator (LCORR) sensing platform (1–8) integrates micro-capillary fluidics with label-free optical ring resonator sensing technology. Optical ring resonators have been studied for sensing applications for a decade (9–24). However, due to the use of the capillary as the ring resonator, the LCORR inherently integrates the sensor head with the sample fluidics, which can increase optical performance while simplifying the system design.
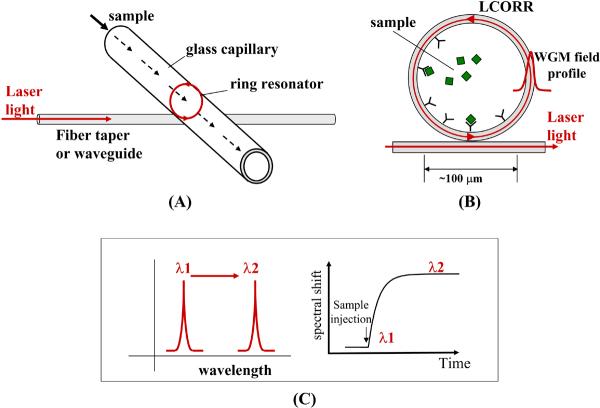
The LCORR sensing platform is illustrated in Figure 1. The ring resonator is formed in the circular cross section of the capillary. The capillary wall acts as a waveguide; light travels repeatedly in a circle around the circumference of the capillary as the ring guides the light through total internal reflection. Light is evanescently coupled into the ring resonator using a fiber taper or a pedestal waveguide. Light that forms an integer number of wavelengths around the circumference of the ring is resonant; the resonating modes are called whispering gallery modes (WGMs). As shown in Figure 1(B), the WGM has an evanescent field that extends beyond the inner wall of the LCORR capillary, where it interacts with the sample as it moves through the inside of the capillary. Analytes are detected by immobilizing biorecognition molecules (e.g. antibodies) that capture the analytes at the inner LCORR surface, where they interact with the evanescent field of the WGM. The presence of the analytes in the optical field changes the effective refractive index experienced by the WGM. Thus the effective optical path length around the ring changes, which causes the resonating wavelength to shift spectrally. This change in WGM spectral location over time as the sample passes through the LCORR capillary is the sensor signal, as illustrated in Figure 1(C).
Figure 1.
LCORR sensing platform. (A) The ring resonator is defined in the cross-section of the LCORR capillary, and is excited by evanescent coupling from a fiber taper or waveguide; (B) An evanescent field at the inner surface interacts with the sample; (C) Detection of analytes causes a spectral shift in the resonant wavelength; the spectral position of the resonant wavelength over time forms the sensing signal.
In this chapter, the method for creating LCORRs is described, the preparation of the LCORR sensor setup is presented, and the steps for performing sensing measurements are given in detail. Protocols for some sensing applications of the LCORR are presented. These include a bulk refractive index measurement, an assay for detecting protein adsorption and protease activity, and an assay for detecting the presence of a specific DNA sequence in a sample.
2. Materials
2.1 Components and equipment for producing LCORRs and fiber tapers
CO2 laser: #F48-2(S)W, 25W (Synrad, Inc., Mukilteo, WI).
Glass tubes: Various tubes have been used as the LCORR preform, including aluminosilicate tubes (#A120-85-10, Sutter Instrument, Novato, CA), silica tubes, (#Q120-90-10, Sutter Instrument), and silica capillary tubing (#TSP530660, Polymicro Technologies, Phoenix, AZ).
Fiber optic cable: single mode fiber, #SMF28 (Corning, Inc., Corning, NY).
Motion controller: 4-axis motion controller, #NI PCI-7390 (National Instrument, Austin, TX).
Mechanical slide type 1: belt-drive slide #ZF1 (Techno, Inc., New Hyde Park, NY).
Mechanical slide type 2: Sherline linear slide (no part #) (Sherline, Inc., Vista, CA).
Data acquisition card: PCI-based 37-pin NI-DAQ, #NI PCI-6221 (National Instrument, Austin, TX).
UV-curable glue: Norland Optical Adhesive #8101 (Norland, Cranbury, NJ).
Plain microscope slides, Fisherbrand #12-550A (Fisher Scientific, Pittsburgh, PA)
Gas torch: The Little Torch (Smith Equipment, Watertown, SD).
Fiber optic clamp: adjustable force magnetic clamp, #T711-250, (Thorlabs, Newton, NJ).
2.2 Components and equipment for the experimental setup
Pumps: Various pumps have been used for moving the samples through the LCORRs, including a syringe pump (#55-1140, Harvard Apparatus, Holliston, MA) and a peristaltic pump (Masterflex #7562-10, Cole-Parmer, Vernon Hills, IL).
Tunable laser: Various tunable lasers have been used in the experimental setup, including a butterfly-packaged 1550 nm distributed feedback (DFB) laser (JDSU #CQF935, JDS Uniphase Corp., Milpitas, CA), a 785 nm DFB laser (#DL100, Toptica Photonics), and a 980 nm external cavity laser (Velocity #6309, New Focus, San Jose, CA).
Photodetector: large area IR photoreceiver, #2033 (New Focus).
Data acquisition card: PCI-based 37-pin NI-DAQ, #NI PCI-6221 (National Instrument, Austin, TX).
Thermo-electric cooler (TEC): #DT6-6-01 (Marlow Industries, Dallas, TX).
TEC controller: #LDT5910-B (ILX Lightwave, Bozemen, MT).
Thermister: #YSI 44036RC (YSI Temperature, Dayton, OH).
Tubing: Tygon microbore tubing, 0.01” inner diameter, 0.03” outer diameter, #EW-06418-01 (Cole-Parmer).
2.3 Buffers and reagents
18 MΩ water (referred to as water throughout): produced by the EASYpure UV, #D7401 (Barnstead/Thermolyne Corp., Dubuque, IA).
Ethanol: absolute, 200 proof, #E7023 (Sigma-Aldrich, St. Louis, MO).
Methanol: absolute, acetone-free, #M1775 (Sigma-Aldrich).
Phosphate buffered silane (PBS) tablets: #P-4417 (Sigma-Aldrich), store at 4° C.
Hydrochloric acid (HCl): certified A. C. S. plus, #A144-212 (Fisher Scientific).
Hydrofluoric acid (HF): 48% A. C. S. reagent, #244279 (Sigma-Aldrich).
3X SSC buffer: Prepare 0.45 M sodium chloride (NaCl, #S271, Fisher Scientific) and 0.045 M sodium citrate (#S1804, Sigma-Aldrich) in water.
2.4 Silanes, cross-linkers, and biomolecules
3-aminopropyl-trimethoxylilane (3-APS): 97%, #281778 (Sigma-Aldrich), store at 4° C.
Dimethyl adipimidate dihydrochloride (DMA): 99%, #285625 (Sigma-Aldrich), store at 4° C.
1-ethyl-3-(3-dimethylaminopropyl)carbodiimide HCl (EDC): #22980 (Pierce Biotechnology, Rockford, IL), store frozen.
N-Hydroxysulfosuccinimide (sulfo-NHS): #24310 (Pierce Biotechnology), store at 4° C.
Bovine serum albumin (BSA): minimum 96%, #A2153 (Sigma-Aldrich).
Oligonucleotide probes: purchased through Sigma-Genosys (Sigma-Aldrich) with the custom-designed sequence: 5'-CCAACCAGAGAACCGCAGTCACAAT; the 5' end is aminated, and has a 6-Carbon spacer.
DNA samples: all DNA samples were custom designed Sigma-Genosys oligonucleotides of length 25mer, 50mer, and 100mer (Sigma-Aldrich).
3. Methods
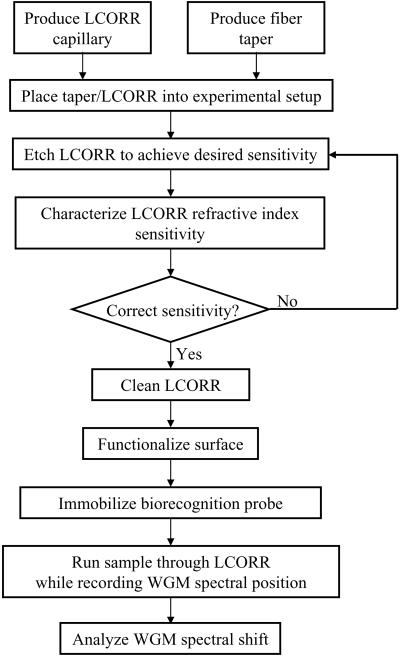
This chapter describes in detail the process for first setting up an LCORR measurement and then the process for performing a sample analysis with the LCORR. At this stage of the development of the LCORR for use in bio/chemical analysis, it is necessary to assemble many of the components in the lab, and to produce LCORRs on site. Figure 2 presents a flow chart of all of the steps necessary to conduct a single sample analysis, from producing the LCORR to analyzing the data. This chapter further explains how to create the experimental setup, as well as how to assemble on-site LCORR and fiber taper production systems.
Figure 2.
The process for conducting a bio/chemical molecule detection experiment using the LCORR sensing platform.
3.1 Producing LCORR capillaries
The primary component of the LCORR sensing system is a glass capillary that acts simultaneously as a microfluidic channel for sample delivery and as a ring resonator for sample detection. This capillary is unlike typical capillaries utilized for liquid or gas sample movement because the wall of the LCORR must be very thin. In fact, for sensing purposes, the LCORR capillary wall must be less than around 5 μm thick. As capillaries with this dimension are not available today, it is required to produce LCORR capillaries in the lab before conducting any detection assays.
To produce a capillary with a thin wall, we stretch a commercially available glass capillary to thin its dimensions (see Note 1). This is analogous to the process of drawing fiber optic cable from a preform. The preform glass capillary is heated to the softening point while one end is pulled. As wall thickness is critical, attention must be given to the temperature and pulling speed, as these parameters dictate the change in aspect ratio (diameter to wall thickness) during pulling. Higher speed and lower temperature will combat the effects of surface tension, which is pulling the softened glass radially inward and decreasing the aspect ratio. Preservation of nearly 100% of the aspect ratio during capillary drawing has been exhibited with our LCORR drawing technique, and has been demonstrated in similar work (25).
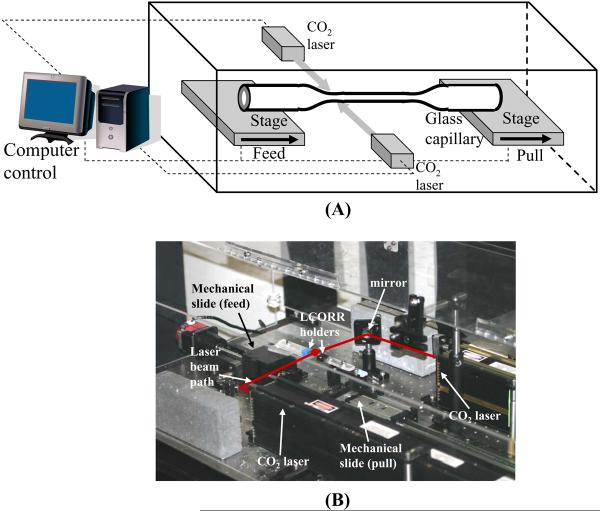
The configuration utilized for drawing LCORR capillaries and a photo of the setup are shown in Figure 3. The entire apparatus is contained within a clear acrylic enclosure to reduce air currents, which can cause fluctuations in the temperature of the heating zone. CO2 lasers are used as the heat source to soften the glass capillary in the heating zone (see Note 2). Two CO2 lasers are used on opposite sides to provide more evenly distributed heating (see Note 3). The power of the lasers, which is computer-controlled using a data acquisition card, is dependent upon which type of glass is used (see Notes 4, 5). While the lasers soften the glass tube in one spot, the two stages holding each end of the glass tube are moved to stretch the glass. The tube can be taped onto each stage, although any temporary clamp will suffice. The stages are mechanical slides with stepper motors for movement. Movement of the stages is controlled with a PCI-based motion controller. One stage is pulled quickly away from the heating zone while the other is slowly pushed toward the heating zone, keeping constant the mass of glass in the heating zone. The ratio of pulling speed to feed-in speed controls the diameter of the pulled capillary (see Note 6).
Figure 3.
(A) Diagram of LCORR drawing setup (reproduced from ref.8 with permission from SPIE). (B) Photo of a constructed setup to draw LCORRs.
In this prototype implementation, computer code controlling the stage movements and laser power is developed using LabView software (National Instruments). User inputs to the program include the desired laser power, the pulling speed, and the feed-in speed. The program operates through the DAQ card and the PCI-based motion controller to generate the appropriate voltage-based outputs to control the laser power and the pull/feed stages.
The steps to be performed for pulling an LCORR capillary are listed below.
The preform glass capillary is bridged between the two stages, using clamps or tape to hold the glass in place.
The lasers are turned on to the power level used for softening the glass (see Note 7).
About 5 seconds is allowed to pass before activating the stages so that the glass has time to heat and soften.
The pulling and feed-in stages are moved at a constant speed until they reach the preset point, corresponding to the desired length.
The LCORR capillary is removed from the clamps by handling it with the remaining ends of the preform. With typical pulling conditions, the capillary is relatively robust, and can be handled easily.
The LCORR capillary can be cut from the final glass piece, although in some prototyping applications, it is desirable to keep at least one end of the remaining preform for handling purposes. The resonant region of the LCORR capillary extends from the thinned portion in the final heating zone to the portion of the capillary where equilibrium in the diameter is reached. Figure 4 illustrates the resonant region of a drawn LCORR capillary, and shows a photo of an LCORR drawn from a glass tube preform.
Figure 4.
LCORR capillary after pulling from a preform.
3.2 Pulling tapers
For prototyping and pre-clinical applications of the LCORR sensing system, it is sometimes practical to utilize a tapered fiber optic cable to excite WGMs in an LCORR see Note 8). The operating principle of the fiber taper is that a fiber optic cable that is thinned to a few micrometers in diameter will have an evanescent field outside the cable. This evanescent field is capable of coupling light into the LCORR. In general, fiber tapers must be produced in the lab in which they will be used because of their fragility. Thus, taper production is presented here as a necessary component in the LCORR assay development.
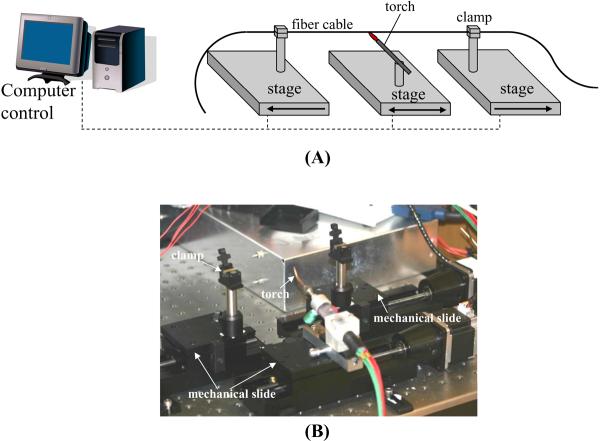
An illustration of the setup for pulling fiber tapers and a photo of the setup are presented in Figure 5. The taper is produced by stretching a fiber optic cable under heat. Typical single mode fibers are utilized as the tapering fiber. The heat source is a clean flame provided by gas torch (see Note 9) (26). The fiber optic cable is stretched slowly from both sides of the heat zone while the heat zone is scanned back and forth by about 1 cm in order to provide a region of constant diameter. Just as with the LCORR pulling apparatus, the stages are mechanical slides controlled by a computer via code developed in LabView and a PCI-based motion controller. The LabView program is very similar to the one used for pulling LCORR capillaries. It may be desirable to pass laser light through the fiber and to measure the loss during taper pulling to monitor the health of the taper while it is produced.
Figure 5.
(A) Setup for pulling fiber tapers. (B) Photo of a constructed setup to pull tapers.
The steps to be performed for pulling fiber taper are listed below.
Prepare a length of fiber cable that is long enough such that leads on each side of the taper can be connected into the experimental setup (see section 3.3). One meter is typically sufficient.
In the center of the fiber cable, strip away the polymer jacket along a 4 cm region and clean away dust and polymer remains. This will be the tapering region.
Using fiber optic clamps mounted on the stages, mount the fiber into the setup.
Position the stage holding the torch such that the tube is centered with respect to the tapering region.
Turn on the gas for the torch and light the flame. Position the torch so that the tapering region is being heated to the desired temperature.
Allow enough time before pulling for the oven to heat to the silica's softening temperature. This may take 5 seconds.
When the glass is softened, the stages pull in opposite directions at a speed of around 0.007 cm/s. Meanwhile, the torch scanned back and forth at a speed of 0.1 cm/s, with travel distance of 5 mm.
When the desired taper diameter is reached, the stages immediately stop pulling and the torch is turned off (see Notes 10, 11).
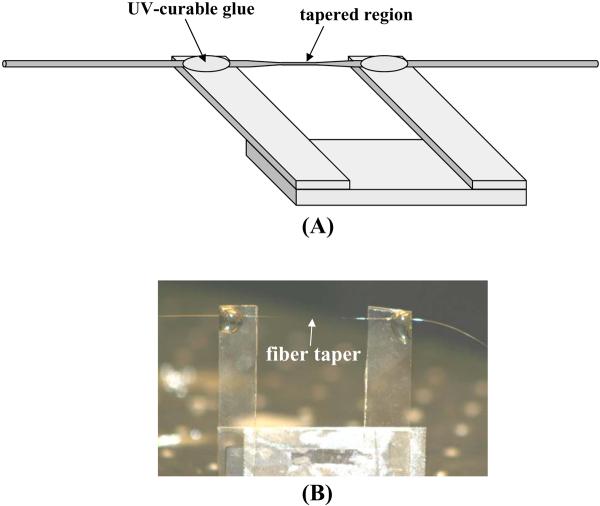
Mount the taper on a rigid holder such that the taper is exposed and not in contact with anything, while being anchored on both sides for support (see Note 12). Figure 6 shows a drawing and a photo of an anchored taper.
Figure 6.
(A) Sketch and (B) photo of a fiber taper anchored onto a portable mount.
3.3 Creating the experimental setup
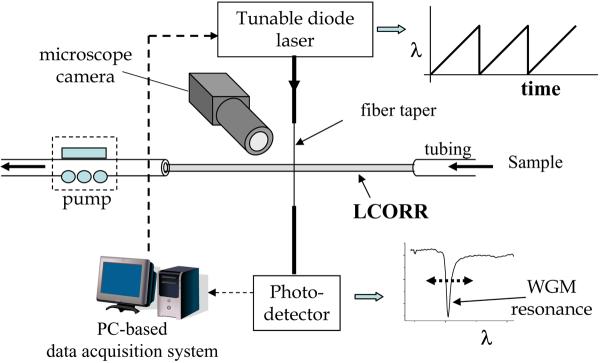
The purpose of the experimental setup is to pass the sample through the LCORR while monitoring the sample's effect on the spectral position of the WGMs. The experimental setup is diagrammed in Figure 7. The LCORR is connected to tubing so that the sample can be passed through using a pump. The taper is connected on one end to a tunable laser (see Note 13) and on the other to a photodetector. The tunable laser scans across a spectral range wide enough to detect a WGM and to track its movement. Typically, 10–15 GHz (i.e., about 100 pm for a center wavelength of 1550 nm) of tuning range is sufficient for this. When the scanning laser passes through a resonant wavelength, destructive interference occurs on the fiber taper at the coupling point with the LCORR, resulting in an observable decrease in the output power. Thus, scanning the laser across one WGM will produce a measured waveform like the one shown in Figure 7 (see Note 14).
Figure 7.
LCORR sensing platform experimental setup (reproduced from ref.7 with permission from SPIE).
Tunable laser control and data collection is performed by a data acquisition (DAQ) card, under the direction of code written in LabView. The DAQ voltage output scans the output wavelength of the laser while the input samples the voltage at the output of the photodetector. After each scan, the sample values are stored in a respective file on the computer. Also, the LabView program displays the measured voltage in real time. Following the experiment, a simple program written in Matlab (Mathworks) is used to scan each file for the spectral location of the voltage minimum (indicative of the WGM), and then a data set is created to represent the WGM spectral position over time. This data set is the sensorgram. An exemplary sensorgram is shown in Figure 1(C).
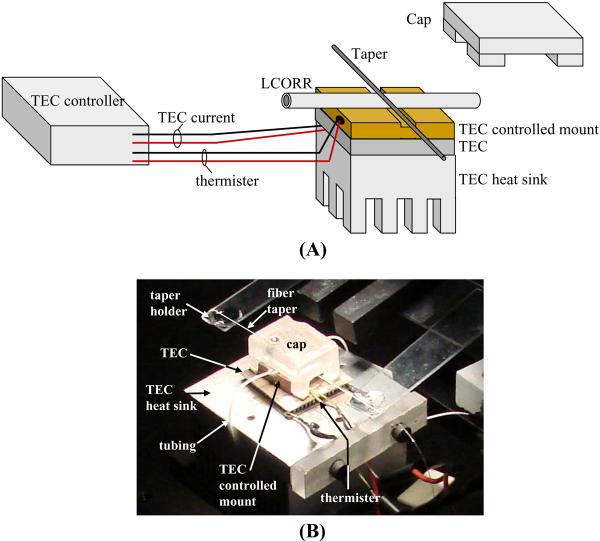
As with many label-free optical sensors, the signal from the LCORR sensor is temperature dependent (4). Therefore, a temperature control system is required in the experimental setup to suppress temperature fluctuations in the LCORR sensing region that would be translated to noise in the sensing signal. Our design is based on a thermo-electric cooler (TEC) and TEC controller. The setup is illustrated in Figure 8.
Figure 8.
(A) Temperature control setup for the LCORR sensor. (B) Photo of a taper and LCORR mounted on the temperature control setup. A white line is drawn along the taper so that it can be visualized.
The steps to be performed for creating the experimental setup are listed below.
Create the temperature control setup. Place the TEC heat sink and TEC on the bench top (or on a platform elevated above the bench top). It is recommended to use a thermally conductive adhesive between materials in this setup. Place a machined (as shown in Figure 8) conductive block on top of the TEC. This is the TEC controlled mount.
Place a thermister onto (or inside a machined hole of) the TEC controlled mount. Mounting the thermister closer to the LCORR sensing region results in better temperature control performance.
Connect the leads of the TEC and the thermister to the TEC controller.
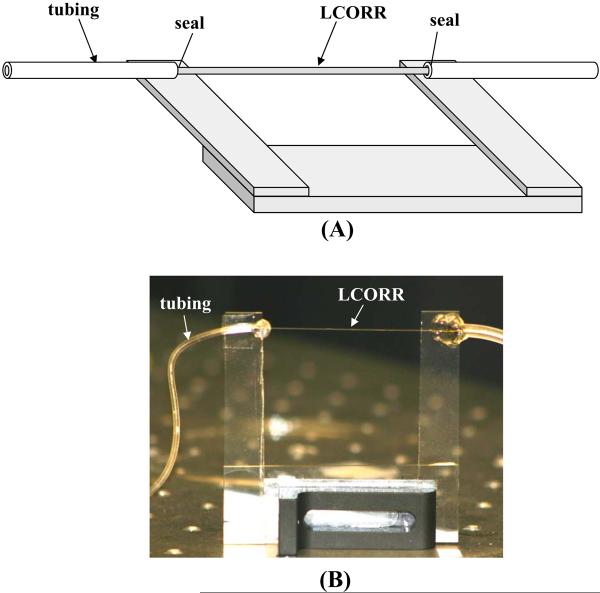
Next, prepare the LCORR. Attach tubing to each side of the LCORR while anchoring the LCORR onto a mount. The tubing diameter should be just large enough to fit around the diameter of the LCORR and should be compatible with either a peristaltic pump or a syringe pump. The mount must leave the sensing region of the LCORR accessible while providing support (see Notes 15, 16). A drawing and a photo are shown in Figure 9.
Mount the LCORR onto a 3-dimensional optical stage, such that the sensing region is accessible to a fiber taper.
Mount the fiber taper onto a 3-deminsional stage such that the tapered region can be brought into contact with the LCORR.
Connect one end of the taper to the tunable laser output and the other to the photodetector input (splicing or free-space coupling can be used).
Connect the DAQ voltage output to the laser wavelength control (see Note 17); connect the DAQ voltage input to the photodetector output.
Begin scanning the laser and monitoring the photodetector signal.
Bring the LCORR and fiber taper into contact while monitoring the WGMs (see Note 18). Utilize a microscope camera to assist with the positioning process. The tapered region of the fiber should contact the LCORR resonant region. The two objects are at approximately 90 degrees with respect to each other, as shown in Figures 7 and 8. Attempt to excite the LCORR resonance with different positions along the taper to optimize the coupling strength. Generally, the best coupling will occur at the thinnest point of the taper.
When the preferred locations of the taper and LCORR are identified, lower the LCORR to be in contact with the LCORR heat sink as shown in Figure 8. Then bring the taper into contact with the LCORR.
Connect one of the tubes that are connected to the LCORR to the pump and use the pump to move the sample through the LCORR. For liquid samples, a peristaltic pump or a syringe pump can be used for slow, constant flows (see Notes 19, 20).
Figure 9.
(A) Sketch an (B) photo of an LCORR with attached tubing, mounted on a portable mount.
3.4 Preparing and characterizing the LCORR for sensing
After pulling the LCORR capillary, the wall thickness may not be as thin as desired for sensing purposes. Additionally, the sensitivity must be characterized before use. Sub-micron differences in wall thickness result in significant differences in the sensitivity of the LCORR, and thus it must be well-characterized. Therefore, once an LCORR is pulled, it is placed in the experimental setup for sensitivity optimization and characterization.
To set the sensitivity of the LCORR, hydrofluoric acid (HF) is used to slowly etch away the inner capillary surface. The amount of glass to be removed depends on the preform and the capillary pulling process. For example, if the preform had an outer diameter of 1 mm and an inner diameter of 0.9 mm, and the LCORR outer diameter is 100 μm, then the thinnest that the wall can be is 10 μm. To achieve a good sensitivity, around 7 μm may need to be removed with HF. This is done by passing diluted concentrations of HF through the LCORR while intermittently characterizing the sensitivity.
The sensitivity is characterized using solutions of known refractive indices, as the sensing mechanism of the LCORR is based on refractive index detection. We use solutions of ethanol in water (1), as the difference in refractive index of the varying concentrations is known (27). Determining the WGM spectral shift for a particular change in refractive index of the sample leads to the refractive index sensitivity of the LCORR sensor.
The steps for optimizing and characterizing the sensitivity of the LCORR are listed here.
Prepare solutions of HF in water (see Note 21). The desired strength of HF depends on the type of glass used for the LCORR. Silica etches slowly, so stronger HF must be used. Aluminosilicate or other glasses etch must faster than silica. Typically, 5–10% HF is used for silica, while 1–2% may be used with aluminosilicate.
Prepare solutions of ethanol. The desired concentrations depend on the sensitivity goal for the LCORR. For example, if 10 nm/RIU (refractive index units) is desired, and considering that a 10 pm WGM spectral shift is practical to detect, the test samples should be prepared in increments of approximately 1 mRIU. This is equivalent to increments of about 2% (v/v) ethanol in water.
With the LCORR in contact with the taper, begin flowing HF through the LCORR (see Note 22). Monitor the WGM spectrum (as described in Section 3.3) while the LCORR is etching (see Note 23). When the LCORR becomes sensitive, the spectral position will drift to lower wavelengths. This is because the wall thickness is slowly decreasing, causing more light to interact with the sample, and thus changing the effective optical diameter of the LCORR. The speed of the WGM shift is an indicator of the wall thickness (see Note 24).
Once the spectral movement of the WGMs is easily visible, the sensitivity of the LCORR should be characterized.
Stop the etching by passing water through the LCORR. The WGM spectral movement should stop almost instantly after the water begins passing through the LCORR.
Once the WGM spectral position has stabilized, the refractive index sensitivity test can be conducted. While monitoring the WGM spectral position, change the sample solution in the LCORR from water to the lowest concentration of ethanol. Record the WGM spectral shift (an exemplary WGM spectral shift is shown in Figure 10). When the refractive index inside the LCORR increases, the WGM spectral position should move to longer wavelength (red shift). Allow the mode to stabilize, and then change the solution in the LCORR back to water, while recording the WGM spectral shift.
Repeat this a few times. Record the WGM spectral shift in picometers. If no spectral shift is visible, return to the HF etching step. If the WGM spectral shift is apparent at all, proceed with the characterization process.
Repeat step 6 (water – ethanol solution – water) with the other concentrations of ethanol while recording the WGM spectral shift that occurs for each solution change.
Determine the average WGM shift for each of the ethanol solutions.
Plot the spectral shift vs. change in refractive index and perform a linear fit of the data. The slope of this fit is the refractive index sensitivity (see Note 25). An exemplary refractive index sensitivity plot is presented in Figure 11 for an LCORR with a sensitivity of 315 pm/RIU.
If the refractive index sensitivity is sufficient, then the optimization and characterization process is complete. If not, then return to the HF etching step. If the sensitivity is close, then it may be prudent to reduce the concentration of the HF.
Clean the inside surface of the LCORR thoroughly with any desired glass treatment, such as 1:1 methanol:HCl. At least 2 hours of treatment is recommended. Caution should be exercised with the reactivity of any of the glass treatments with tubing used in the experimental setup.
Figure 10.
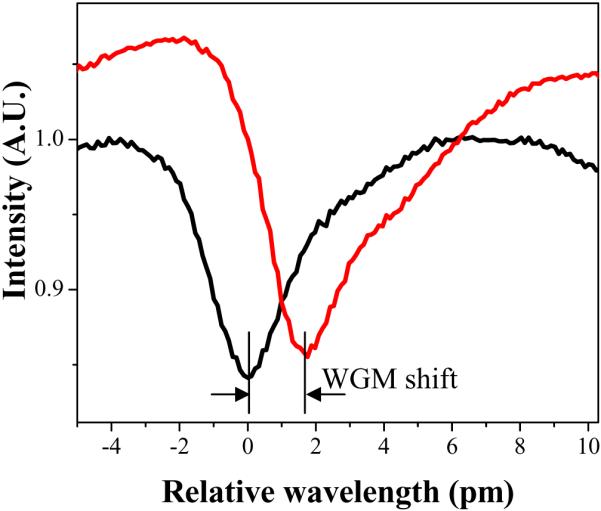
The observed WGM shift in response to a 10% ethanol solution replacing water inside an LCORR with a sensitivity of 315 pm/RIU.
Figure 11.
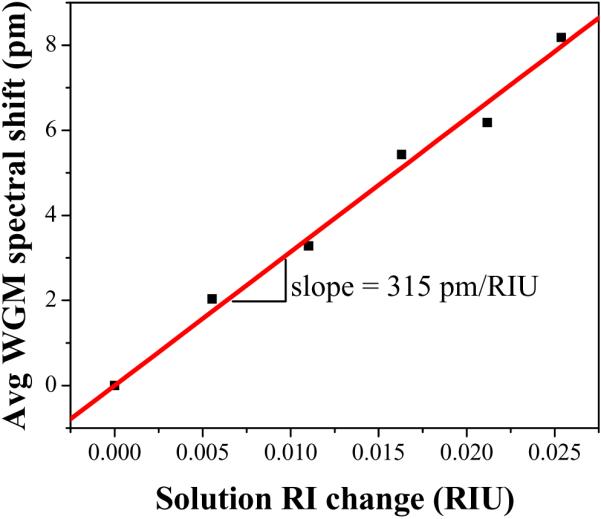
The measured refractive index sensitivity for an exemplary LCORR. Data is recorded for ethanol solutions of 10%, 20%, 30%, 40%, and 50%. The values are the result of an average across at least 6 observed WGM shifts. The slope of the linear fit is the refractive index sensitivity.
3.5 Bulk refractive index detection
The characterization procedure outlined in Section 3.4 illustrates that the LCORR sensing platform can be used to identify the refractive index of sample liquids. Once the sensitivity has been characterized, liquids of unknown refractive index can be passed through the LCORR while the WGM spectral position is monitored. This can be used, for example, to identify if a sample has a small amount of contaminants.
The following procedure is used to measure the bulk refractive index.
Prepare the experimental setup described in Section 3.3.
Prepare a baseline solution. Ideally, this solution will be relatively close in refractive index to the sample. For example, if looking for the amount of water contamination in ethanol, then pure ethanol should be used as the baseline solution.
Use the pump to drive the baseline solution through the LCORR. It is recommended to move the liquid slowly, e.g. 10 μ/min.
Monitor the WGM spectral position.
Quickly switch to the sample, while trying to minimize any air gaps between the baseline liquid and the sample (see Note 26).
Record the WGM spectral shift that occurs as the sample replaces the baseline liquid in the LCORR.
Switch back to the baseline liquid, and repeat the measurement several times.
Compute the average value of the WGM spectral shift.
The refractive index difference between the baseline and the sample is easily computed by dividing the measured WGM spectral shift by the LCORR sensitivity measured in the characterization procedure.
3.6 Detection of protein binding and proteolytic activity
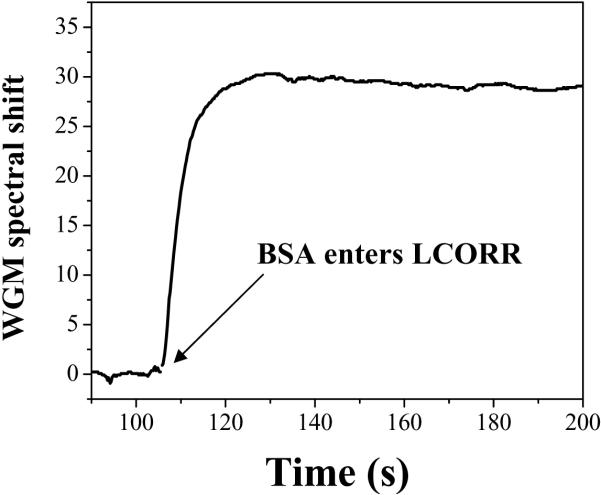
The LCORR can utilize its refractive index sensing capabilities to detect biomolecule analytes that are captured at the inner surface of the capillary. Typically, biomolecules have refractive indices around 1.45 to 1.55, while buffers are typically close to the range of 1.3 – 1.35. Thus, when biomolecules bind to the surface, the local refractive index in the region of the WGM evanescent field increases. This RI increase is reflected in the sensor signal by a red shift of the WGM spectral position. Figure 12 illustrates an exemplary sensor signal reflecting the binding of BSA molecules at the inner surface of the capillary. Because the total WGM spectral shift is proportional to the number of molecules that bind to the surface, the concentration of analytes in the sample can be determined when using the LCORR as a sensor.
Figure 12.
Sensorgram showing the binding of BSA molecules at the inner surface of the LCORR capillary. The BSA concentration is 1 mg/ml.
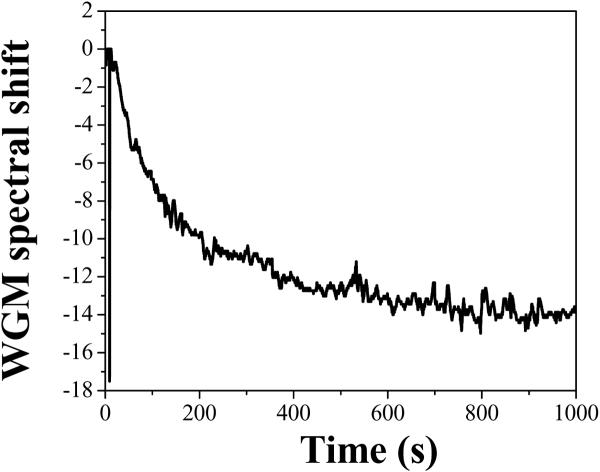
Through the same refractive index sensing mechanism that causes a red-shift for binding analytes, a blue shift in the WGM spectral position occurs when analytes are removed from the capillary surface. Thus, the LCORR can also be used to detect proteolytic activity. Figure 13 shows the sensor signal when trypsin is introduced into the same LCORR following the binding of BSA (shown in Figure 12). Trypsin is known to cleave BSA molecules at a number of residues, which will cause a significant amount of the BSA mass to be removed from the LCORR.
Figure 13.
Sensorgram showing the proteolytic activity of trypsin acting to remove BSA bound at the inner surface of the LCORR capillary. The trypsin concentration is 10 μg/ml.
As an example of protein detection, the steps for detecting BSA molecules in a sample are listed below.
Prepare a solution of 10% ethanol in 90% water (v/v). 5 ml of solution is sufficient.
Prepare the surface functionalization silane. Use 1% (v/v) of 3-aminopropyltrimethoxysilane (3-APS) in the 10/90 ethanol/water. It is recommended to prepare about 2 ml of 3-APS solution.
Prepare the phosphate buffered silane (PBS). Dissolve a PBS tablet in water to prepare 0.01 M PBS as indicated in the manufacturer instructions.
Prepare the BSA solution. Dissolve the desired concentration of BSA in PBS. The sample volume required is very small. However, for practical purposes, it may be desirable to make at least 100 μl of BSA solution. If very low concentrations are used, a higher volume, such as 1 ml, should be prepared. A cross-linker will be added to this solution, but it should not be done until just before the sample is used. Otherwise, the protein molecules may be cross-linked together before the experiment begins.
Prepare the LCORR for surface functionalization. Begin by passing 1:1 HCl:methanol through the LCORR for at least 30 minutes. Then rinse with methanol for at least 10 minutes. For all solutions throughout this measurement, the flow velocity should be kept below 10 μl/min.
Begin passing the 10/90 ethanol/water solution through the LCORR. Allow this solution to pass through the LCORR for approximately 15 minutes to establish a starting baseline for the WGM spectral position. Begin recording the WGM spectral position.
Quickly switch to 3-APS solution, minimizing the flow gap (without changing the pump speed) between the buffer solution and the 3-APS solution. The 3-APS should be passed through the LCORR for at least 15 minutes. The WGM spectral position should shift to a higher wavelength during the deposition, but should reach steady state after around 15 minutes (see Note 27).
Switch back to the 10/90 ethanol/water solution in the LCORR. This will cause some 3-APS to be released from the surface, resulting in a WGM blue shift. Once the blue shift is complete (10–15 minutes at most), allow another 10 minutes to establish the new signal baseline. The deposition of 3-APS should result in a red shift from the initial baseline WGM spectral position to the current position.
Begin passing PBS buffer through the LCORR and establish a new baseline position.
During this WGM stabilization, complete the preparation of the BSA solution. Add 1-Ethyl-3-[3-dimethylaminopropyl]carbodiimide hydrochloride (EDC) and N-hydroxysulfosuccinimide (sulfo-NHS) to the BSA/PBS solution to a concentration of 1 mg/ml each. EDC with sulfo-NHS is used to convert carboxyl groups to amine-reactive Sulfo-NHS esters (see Note 28). This solution should be prepared immediately before use.
Run the BSA solution through the LCORR for 30–45 minutes. A red shift with similar features to the one shown in Figure 12 should occur. If the concentration of the BSA is high (greater than 0.1 mg/ml), then the total red shift may complete within as little as 5 – 10 minutes.
Rinse the LCORR with PBS. Again, the rinse should cause a blue-shift as some PBS will be removed from the surface of the LCORR. Once the blue shift is complete (10–15 minutes at most), allow another 10 minutes to establish the final signal baseline. The binding of BSA produces the red shift from the WGM spectral position after step 9 to the current WGM spectral position.
To determine the concentration of protein molecules in an unknown sample, the net WGM spectral shift should be compared to a calibration curve that plots the net WGM shift versus protein concentration. The calibration curve is prepared using the same steps as above, but with samples that contain a known concentration of protein molecules. Naturally, the LCORR used to test the sample should have the same sensitivity as the LCORR used to produce the calibration curve.
- Once the concentration in the sample is known, the reaction kinetics between the molecules in the sample and the capture molecules on the surface can be analyzed. The WGM spectral shift is related to the protein concentration in the sample by (14):
where Kd is the dissociation constant and δλmax is the maximum WGM spectral shift in the calibration curve. Using this expression, the Kd can be determined for any protein sample. If proteolytic activity is to be measured, the enzyme of interest should be dissolved in PBS to the desired concentration and passed through the LCORR. A blue shift in the WGM spectral position with features similar to the sensorgram shown in Figure 13 should occur.
3.7 Detection of specific DNA sequences
One important application of the label-free biomolecule detection capability of the LCORR sensing platform is the identification of a specific DNA sequence in a sample. Similar to DNA microarray technology, an oligonucleotide probe that is designed to be the complement of the single-stranded target is immobilized on the sensor surface. If the target sequence exists in the sample, it will bind with an immobilized oligo probe at the LCORR inner surface. As shown in Subsection 3.6, the LCORR quantitatively detects biomolecules that bind to at the surface.
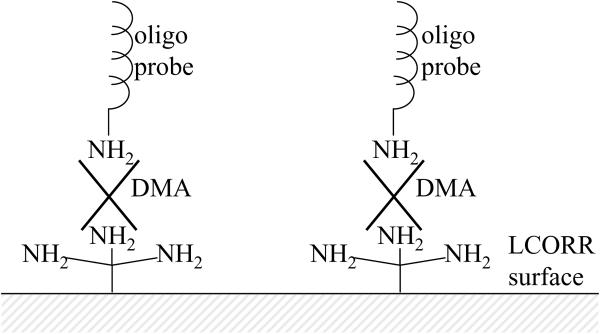
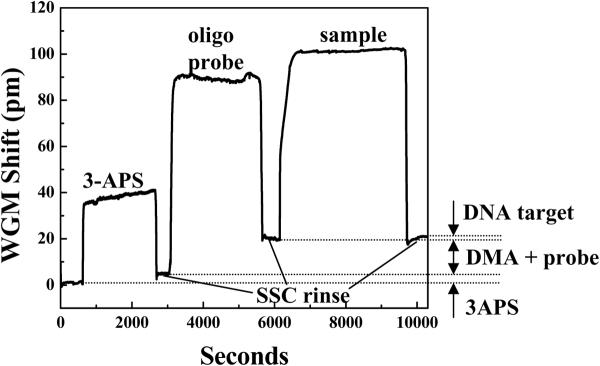
Surface chemistry for successful immobilization of the oligo probes is critical. First, the surface of the LCORR and the 5' end of the oligo probe are functionalized with amine groups. Then, dimethyl adipimidate (DMA) is used to crosslink the oligo probes to the amino-functionalized LCORR surface. This surface chemistry is illustrated in Figure 14. Upon immobilizing the probes, the LCORR is prepared to detect the presence of the complementary probe sequence in the sample. Figure 15 presents an exemplary sensorgram, which shows the WGM spectral shift during the functionalization, oligo probe immobilization, and sample analysis processes.
Figure 14.
Surface chemistry for immobilizing oligo probes to the LCORR surface.
Figure 15.
Exemplary sensorgram for 3-APS functionalization, 25 base-pair oligo probe immobilization, and sample detection (25 base pair DNA sequence). In this case, all steps, including the 3APS deposition, were performed in 3X-SSC buffer. Therefore, there are no WGM spectral shifts due to buffer changes.
The steps for conducting the DNA sequence detection measurement are outlined below.
Prepare a solution of 10% ethanol in 90% water (v/v). 5 ml of solution is sufficient.
Prepare the surface functionalization silane. Use 1% (v/v) of 3-aminopropyltrimethoxysilane (3-APS) in the 10/90 ethanol/water. It is recommended to prepare about 2 ml of 3-APS solution.
Prepare 3X SSC buffer. 3X SSC is 0.45 M NaCl and 0.045 M sodium citrate. 10 ml of buffer is sufficient.
Prepare oligonucleotide probe solution. Dissolve the probe pellet into 3X SSC to produce a concentration of 10 μM. Prior to opening the tube of pelleted DNA, it may be advantageous to centrifuge it for 10–15 minutes to ensure that there is no aerosol material lost. Sonicate the solution to ensure that the oligos are dissolved. DMA will be added to this solution immediately before probe immobilization onto the LCORR. It should not be done in advance in order to avoid DMA hydrolysis and cross-linking of the oligo probes.
Prepare the DNA sample in 3X SSC (see Note 29). In many cases, the DNA sample will be the output of RT-PCR targeted at the sequence of interest.
Prepare the LCORR for surface functionalization and probe immobilization. Begin by passing 1:1 HCl:methanol through the LCORR for at least 30 minutes. Then rinse with methanol for at least 10 minutes. For all solutions, the flow velocity should be kept below 10 μl/min.
Begin passing 10/90 ethanol/water through the LCORR. If interested in using the LCORR sensing functionality to monitor the surface functionalization and probe immobilization processes, begin recording the WGM spectral position at this point. Let the solution run for at least 15 minutes while recording the spectral position in order to establish an initial baseline WGM position.
Quickly switch to 3-APS solution, minimizing the flow gap (without changing the pump speed) between the buffer solution and the 3-APS solution (see Note 26). The 3-APS should be passed through the LCORR for at least 15 minutes. The WGM spectral position should shift to a higher wavelength during the deposition, but should have reached steady state after around 15 minutes.
Switch back to the 10/90 ethanol/water solution in the LCORR. This will cause some 3-APS to be released from the surface, resulting in a WGM blue shift. Once the blue shift is complete (10–15 minutes at most), allow another 10 minutes to establish the new signal baseline.
Begin passing 3X SSC buffer through the LCORR and allow a new baseline position to be established.
During this WGM stabilization, complete the preparation of the oligo probe solution. Add DMA to the oligo solution to a concentration of 5 mg/ml. This solution should be prepared immediately (within 10 minutes) before use.
Run the DMA/oligo probe solution through the LCORR for 30–45 minutes. Because the DMA loses its reactivity after approximately one hour, there is no benefit to running the solution any longer. The WGM spectral position should undergo a red-shift as the oligo probes are immobilized onto the surface of the LCORR.
Rinse the LCORR with SSC. Again, the rinse should cause a blue-shift as some oligo will be removed from the surface of the LCORR. Once the blue shift is complete (10–15 minutes at most), allow another 10 minutes to establish the new signal baseline.
The LCORR is now prepared for the sample. Pass the sample through the LCORR while continuing to record the WGM spectral position. Allow the sample to pass through until the WGM has stabilized following the red shift. This may be as long as 1 hour. Recycling the sample solution through the LCORR may enable more opportunities for the sample to bind at the LCORR surface.
Run a final SSC rinse through the LCORR. Once again, a blue shift will result as some target DNA is removed from the surface. After the blue shift is complete (10–15 minutes at most), allow another 10 minutes to establish the final WGM spectral position.
To determine the concentration of DNA molecules with the sequence of interest in an unknown sample, the net WGM spectral shift should be compared to a calibration curve that plots the net WGM shift versus DNA concentration. The calibration curve is prepared using the same steps as above, but with samples that contain a known concentration of DNA molecules matching the sequence of interest. Naturally, the LCORR used to test the sample should have the same sensitivity as the LCORR used to produce the calibration curve.
- Once the concentration in the sample is known, the reaction kinetics between the DNA molecules in the sample and the capture probe on the surface can be analyzed. The WGM spectral shift is related to the target DNA concentration in the sample by (14):
where Kd is the dissociation constant and δλmax is the maximum WGM spectral shift in the calibration curve. Using this expression, the Kd can be determined for any sample.
4. Notes
Two different options have been used for the LCORR capillary preform: glass tubes with an outer diameter of 1.2 mm and an inner diameter of 0.9 mm, and silica capillaries with an outer diameter of 617 μm and an inner diameter of 535 μm.
A wire filament or heated ceramic oven also work, as long as the temperature inside can be raised to the softening point of the glass without damaging the heating element.
The lasers are slightly angled with respect to the perpendicular axis of the LCORR so that the beam of one laser is not hitting the opposite laser.
For quartz tubes with an outer diameter of 1.2 mm and an inner diameter of 0.9 mm (Suter Instruments), approximately 5 W from each laser has been used. For aluminosilicate tubes of the same size, approximately 2.5 W from each laser has been used.
It may be advantageous to have a feedback control design for the laser power, in which a laser micrometer monitors in real time the size and shape of the LCORR and invokes dynamic power adjustments of the lasers through the computer control.
A typical pull speed is just over 1 cm/s while feeding at a speed of about 0.02 cm/s; this results in a diameter of approximately 115 μm from a glass tube with in initial diameter of 1.2 mm.
Extreme caution should be used with CO2 lasers. At these power levels, they can easily damage lab materials and are harmful to users. Moreover, the light is completely invisible.
Ultimately, in a clinical version of the LCORR, the capillaries would be mounted in a package on top of an array of pedestal waveguides, which would be used to excite WGMs (2–3).
The desired diameter of the taper may depend on the wavelength of light utilized. Lower wavelengths will have a shorter evanescent field, and thus tapers for lower wavelength sources must be pulled thinner for sufficient evanescent exposure.
For SMF28, each stage pulls approximately 1.5 cm to produce a taper of approximately 3 μm. The difference in pulling length for a 1500 nm source and a 600 nm source may be only about 1 mm.
A U-shaped holder made from glass microscope slides is assembled and UV-curable glue (Norland) is used to anchor the taper onto the arms of the mount.
Several options are available for tunable lasers. One common approach is to use distributed feedback (DFB) lasers, such as the Toptica LD100 or the JDSU CQF935. In this case, changing the laser gain current tunes the output wavelength. Also, external cavity lasers, such as the New Focus Velocity 6300 series, can be used. For these lasers, applying a variable voltage signal onto a piezo-controlled grating or prism will tune the output wavelength.
Scanning the laser across 100 pm may result in the appearance of many WGMs.
UV-curable glue is used as the sealant. It is important to consider the sealant reactivity or solubility with any solutions that will pass through the LCORR.
The sealant tends to be pulled into the tubing by capillary action. It must be ensured that the sealant is not pulled far enough inside to block the sample's path through the LCORR.
Two methods are commonly used for tuning lasers. In the case of distributed feedback (DFB) lasers, typically the gain current is modulated, which results in small wavelength shifts. In external cavity lasers, a piezo control for the external grating may be available for scanning the wavelength.
We use the DAQ and the LabView program to view the photodetector signal (and thus the WGMs) in real time. However, if this option is not available, a properly triggered oscilloscope will also work.
Based on experience, some peristaltic pumps can cause pressure variations inside the LCORR, which can add noise to the sensing signal (the WGM is extremely sensitive to the diameter of the LCORR, which can be altered slightly under varying pressure).
It is recommended to pull the sample instead of pushing it through the LCORR to reduce the possibility of breaking any of the seals along the fluidic path.
HF is a dangerous acid. Extreme caution should be exercised when using HF. Do not use glassware for containing the HF.
The LCORR etches more quickly if the HF solution is constantly moved through the LCORR, as opposed to sitting stagnant inside the LCORR.
A WGM spectral shift may occur very soon after the HF begins passing through the LCORR. However, this may be due to the temperature change caused by the reaction of the HF with the glass.
The spectral width of the WGM is expected to increase during the etching process. As the evanescent field in the liquid core increases, more light absorption occurs, which decreases the Q-factor and thus increases the spectral width of the mode. Furthermore, surface roughness of the LCORR due to etching can also reduce the Q-factor, especially as the evanescent field at the surface increases due to thinner walls.
- First, convert the percentage of ethanol into a mole fraction of ethanol in water. Then use the expression from Ghoreyshi, et al. (27) to find the difference in refractive index between water and the ethanol solution:
where X is the mole fraction. This expression is validated for data taken at 632.8 nm at 25° C. Keeping the pump speed constant throughout the measurement is highly recommended, as pressure changes in the LCORR will cause shifts in the WGM spectral position.
Instead of pumping it through the LCORR, it can sit still in the LCORR, allowing the 3APS to diffuse to the surface. Changing the pump speed (or stopping the pump) corrupts the sensing signal, so this should only be done if the sensing signal is not desired for this step.
In the case of BSA deposition onto an aminated surface, cross-linkers are not necessary, as the BSA will adsorb to the surface. Cross-linkers here are used for illustrative purposes, as in many typical measurements, they may be required to effectively bind the biomolecule to the surface.
If it is necessary to use a different buffer for the sample, then a baseline WGM spectral position must be established when switching buffers between the probe immobilization and sample deposition. This is similar to when the baseline is established for SSC buffer after the 3-APS deposition and 10/90 ethanol/water rinse.
5. References
- 1.White IM, Oveys H, Fan X. Liquid Core Optical Ring Resonator Sensors. Opt. Lett. 2006;31:1319–1321. doi: 10.1364/ol.31.001319. [DOI] [PubMed] [Google Scholar]
- 2.White IM, Oveys H, Fan X, Smith TL, Zhang J. Integrated multiplexed biosensors based on liquid core optical ring resonators and antiresonant reflecting optical waveguides. Appl. Phys. Lett. 2006;89:191106–191101. 191106–191103. [Google Scholar]
- 3.White IM, Suter JD, Oveys H, Fan X. Universal coupling between metal-clad waveguides and optical ring resonators. Opt. Expr. 2007;15:646–651. doi: 10.1364/oe.15.000646. [DOI] [PubMed] [Google Scholar]
- 4.Suter JD, White IM, Zhu H, Fan X. Thermal Characterization of Liquid Core Optical Ring Resonator Sensors. Appl. Opt. 2007;46:389–396. doi: 10.1364/ao.46.000389. [DOI] [PubMed] [Google Scholar]
- 5.Zhu H, White IM, Suter JD, Zourob M, Fan X. An Integrated Refractive Index Optical Ring Resonator Detector for Capillary Electrophoresis. Anal. Chem. 2007;79:930–937. doi: 10.1021/ac061279q. [DOI] [PubMed] [Google Scholar]
- 6.Fan X, White IM, Zhu H, Suter JD, Oveys H. Overview of novel integrated optical ring resonator bio/chemical sensors. Proc. SPIE. 2007;6452:64520M. [Google Scholar]
- 7.White IM, Zhu H, Suter JD, Oveys H, Fan X. Liquid core optical ring resonator label-free biosensor array for lab-on-a-chip development. Proc. SPIE. 2006;6380:63800F. [Google Scholar]
- 8.White IM, Oveys H, Fan X, Smith TL, Zhang J. Demonstration of a liquid core optical ring resonator sensor coupled with an ARROW waveguide array. Proc. SPIE. 2007;6475:647505. [Google Scholar]
- 9.Laine J-P, Tapalian HC, Little BE, Haus HA. Acceleration sensor based on high-Q optical microsphere resonator and pedestal antiresonant reflecting waveguide coupler. Sens. Actuators A. 2001;93:1–7. [Google Scholar]
- 10.Arnold S, Khoshsima M, Teraoka I, Holler S, Vollmer F. Shift of whispering-gallery modes in microspheres by protein adsorption. Opt. Lett. 2003;28:272–274. doi: 10.1364/ol.28.000272. [DOI] [PubMed] [Google Scholar]
- 11.Vollmer F, Arnold S, Braun D, Teraoka I, Libchaber A. Multiplexed DNA Quantification by Spectroscopic Shift of Two Microsphere Cavities. Biophys. J. 2003;85:1974–1979. doi: 10.1016/S0006-3495(03)74625-6. [DOI] [PMC free article] [PubMed] [Google Scholar]
- 12.Hanumegowda NM, White IM, Oveys H, Fan X. Label-Free Protease Sensors Based on Optical Microsphere Resonators. Sensor Lett. 2005;3:315–319. 2005. [Google Scholar]
- 13.Hanumegowda NM, White IM, Fan X. Aqueous mercuric ion detection with microsphere optical ring resonator sensors. Sens. Actuators B. 2006;120:207–212. [Google Scholar]
- 14.Zhu H, Suter JD, White IM, Fan X. Aptamer Based Microsphere Biosensor for Thrombin Detection. Sensors. 2006;6:785–795. [Google Scholar]
- 15.Boyd RW, Heebner JE. Sensitive disk resonator photonic biosensor. Appl. Opt. 2001;40:5742–5747. doi: 10.1364/ao.40.005742. [DOI] [PubMed] [Google Scholar]
- 16.Blair S, Chen Y. Resonant-enhanced evanescent-wave fluorescence biosensing with cylindrical optical cavities. Appl. Opt. 2001;40:570–582. doi: 10.1364/ao.40.000570. [DOI] [PubMed] [Google Scholar]
- 17.Armani AM, Vahala KJ. Heavy water detection using ultra-high-Q microcavities. Opt. Lett. 2006;31:1896–1898. doi: 10.1364/ol.31.001896. [DOI] [PubMed] [Google Scholar]
- 18.Chao C-Y, Guo LJ. Biochemical sensors based on polymer microrings with sharp asymmetrical resonance. Appl. Phys. Lett. 2003;83:1527–1529. [Google Scholar]
- 19.Krioukov E, Greve J, Otto C. Performance of integrated optical microcavities for refractive index and fluorescence sensing. Sens. Actuators B. 2003;90:58–67. [Google Scholar]
- 20.Ksendzov A, Homer ML, Manfreda AM. Integrated optics ring-resonator chemical sensor with polymer transduction layer. Electron. Lett. 2004;40:63–65. [Google Scholar]
- 21.Ksendzov A, Lin Y. Integrated optics ring-resonator sensors for protein detection. Opt. Lett. 2005;30:3344–3346. doi: 10.1364/ol.30.003344. [DOI] [PubMed] [Google Scholar]
- 22.Chao C-Y, Fung W, Guo LJ. Polymer microring resonators for biochemical sensing applications. IEEE Journal of Selected Topics in Quantum Electronics. 2006;12:134–142. 2006. [Google Scholar]
- 23.Yalcin A, Popat KC, Aldridge OC, Desai TA, Hryniewicz J, Chbouki N, Little BE, King O, Van V, Chu S, Gill D, Anthes-Washburn M, Unlu MS, Goldberg BB. Optical Sensing of Biomolecules Using Microring Resonators. IEEE J. Sel. Top. Quant. 2006;12:148–155. [Google Scholar]
- 24.Yang J, Guo LJ. Optical sensors based on active microcavities. IEEE J. Sel. Top. Quant. 2006;12:143–147. [Google Scholar]
- 25.Fitt AD, Furusawa K, Monro TM, Please CP. Modeling the Fabrication of Hollow Fibers: Capillary Drawing. J. Lightwave Technol. 2001;19:1924–1931. [Google Scholar]
- 26.Sumetsky M, Dulashko Y, Hale A. Fabrication and study of bent and coiled free silica nanowires: self-coupling microloop optical interferometer. Opt. Express. 2004;12:3521–3531. doi: 10.1364/opex.12.003521. [DOI] [PubMed] [Google Scholar]
- 27.Ghoreyshi AA, Farhadpour FA, Soltanieh M, Bansal A. Transport of small polar molecules across nonporous polymeric membranes. J. Membr. Sci. 2003;211:193–214. [Google Scholar]
- 28.Laine J-P, Little BE, Haus HA. Etch-eroded fiber coupler for whispering-gallery-mode excitation in high-Q silica microspheres. IEEE Photonic Tech. L. 1999;11:1429–1431. [Google Scholar]
- 29.Knight JC, Cheung G, Jacques F, Birks TA. Phased-matched excitation of whispering-gallery-mode resonances by a fiber taper. Opt. Lett. 1997;22:1129–1131. doi: 10.1364/ol.22.001129. [DOI] [PubMed] [Google Scholar]
- 30.Tong L, Gattass RR, Ashcom JB, He S, Lou J, Shen M, Maxwell I, Mazur E. Subwavelength-diameter silica wires for low-loss optical wave guiding. Nature. 2003;426:816–819. doi: 10.1038/nature02193. [DOI] [PubMed] [Google Scholar]


