

Abstract
Genome-wide copy number analyses of human cancers identified a frequent 5p13 amplification in multiple solid tumor types, including lung (56%), ovarian (38%), breast (32%), prostate (37%) and melanoma (32%). Integrative analysis of the region identifies a Golgi protein, GOLPH3, as a candidate targeted for amplification. Gain- and loss-of-function studies in vitro and in vivo validated GOLPH3 as a potent oncogene. Physically, GOLPH3 localizes to the trans-Golgi network and interacts with components of the retromer complex, which in yeast has been linked to TOR signaling. Mechanistically, GOLPH3 regulates cell size, enhances growth factor-induced mTOR signaling in human cancer cells and alters response to mTOR inhibitor in vivo. Thus, reinforcing genomic and genetic, biological, functional and biochemical data in yeast and humans establish GOLPH3 as a novel oncogene that is commonly targeted for amplification in human cancer and capable of modulating the response to rapamycin, a cancer drug in clinical use.
Introduction
Cellular growth, proliferation and survival are regulated by a complex network of intracellular and extracellular signal transduction cascades. The growth factor-responsive receptor tyrosine kinase (RTK) - phosphatidylinositol 3-kinase (PI3K) pathway plays a major role in governing these processes1. The serine/threonine kinase AKT functions as a central integrator of RTK-PI3K signaling to modulate downstream effectors, most notably the TSC1/2-mTOR complexes. mTOR, a serine/threonine protein kinase and ‘target of rapamycin’, serves as a primary regulator of protein synthesis and cell growth2. Genetic studies in Drosophila and mice3;4;5;6 have shown that mTOR activity can influence cell size, a key parameter governing entry into the cell cycle7. mTOR also integrates diverse upstream signals that include amino acid and energy stress sensing to regulate cell proliferation, growth and survival8;9. mTOR is present in two separate signaling complexes, mTORC1 and mTORC2, which differ in subunit composition and their sensitivity to the bacterial macrolide rapamycin. Rapamycin inhibits mTOR activity when bound to the protein Raptor, leading to reduced cell growth, cell size and proliferation10;11;2.
A hallmark feature of human cancer is its highly rearranged genome, manifesting as numerous copy number amplifications and deletions detectable by genome-wide array-based comparative genome hybridization (array-CGH) profiling. Reasoning that genomic alterations recurrent in different human cancer types are more likely to represent “driver” events targeting cancer genes of broad biological and pathogenetic significance, we defined a focal amplification within a larger 5p13 regional gain present at high frequencies in multiple solid tumors that include melanoma, colon adenocarcinoma and non-small cell lung cancer. Integrative genomics combined with clinicopathological and functional validation identified a Golgi-localizing protein, GOLPH3, as a novel oncogene targeted for amplification at 5p13. Mechanistic studies utilizing both yeast and human systems linked GOLPH3 to the retromer protein trafficking complex, mTOR signaling and the response to rapamycin.
Results
GOLPH3 is a target of 5p13 amplification
Array-CGH analysis of 83 melanoma specimens revealed a focal amplification within a larger 5p13 regional copy number gain, which was also present in non-small cell lung cancer and colon adenocarcinomas (Fig. 1a), prompting a broad survey by fluorescence in situ hybridization (FISH). Analysis on tumor tissue microarrays (TMA) containing 307 cores of diverse tumor types showed that 5p13 gain was present significantly in all tumor types surveyed, including 56% (27 of 48) of non-small cell lung carcinoma (NSCLC) cores, 38% (18 of 48) of ovarian carcinoma cores, 37% (16 of 43) of prostate cancer cores as well as 32% (12 of 38) of melanoma cores (Fig. 1b, Supp Fig. S1 and Supp Table S1). Quantitative real-time PCR across the 5p13 region in informative tumor samples delimited a 0.8 MB minimal common region (MCR) encompassing four resident annotated genes (Fig. 1c, d). Given that copy number aberration (CNA) is a mechanism to drive deregulated gene expression, we next investigated the expression pattern of these resident genes in a NSCLC collection with matched expression and array-CGH profiles. As shown in Fig. 1e, only GOLPH3 and SUB1, but not MTMR12 and ZFR, showed statistically significant correlation between expression level and copy number status, thereby pointing to GOLPH3 and SUB1 as viable candidate target(s) of this amplification.
Figure 1. Genomic characterization of 5p13 amplification.
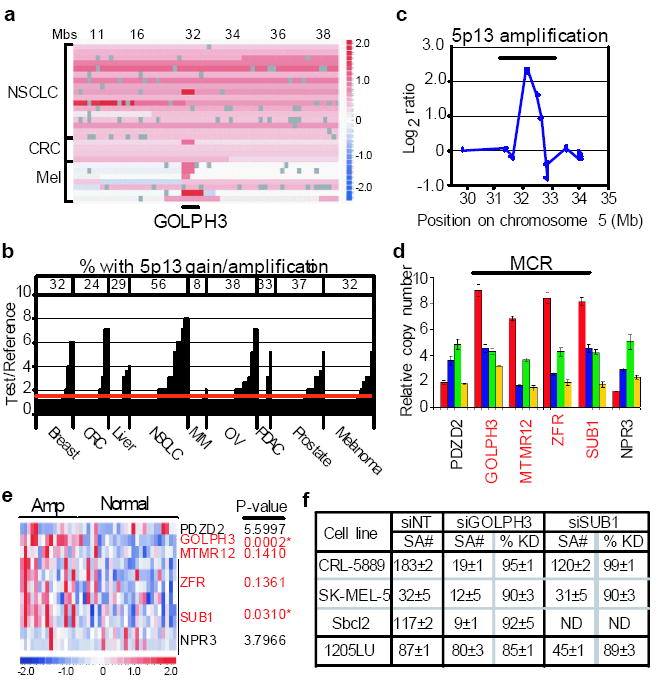
a, Array-CGH heat map detailing GOLPH3 amplification at 5p13 in representative tumor specimens and cell lines from malignant melanoma (Mel), colon adenocarcinoma (CRC) and non-small cell lung cancer (NSCLC). Regions of genomic amplification and deletion are denoted in red and blue, respectively. Mbs=position on chromosome 5 in megabases. b, Histogram summary of copy number status at 5p13 by TMA-FISH analysis of 307 tumor cores of the indicated tumor types. CRC = colon adenocarcinoma; NSCLC = small cell lung cancer; MM = multiple myeloma; OV = ovarian carcinoma; PDAC = pancreatic ductal adenocarcinoma. For details see Supp Table S1. c, Minimum common region of the 5p13 amplicon defined by array-CGH from one representative tumor (melanoma C27) with focal amplification. d, Delimitation of chromosome 5p13 amplicon boundaries by genomic qPCR using four informative cell line and tumor specimens. For details see Supp Information. e, Heat map depiction of Affymetrix expression data for NSCLC 5p13 amplified (AMP) and normal specimens. * = significant correlation after bonferroni correction for multiple testing. f, Summary of soft agar colony counts (SA#) and corresponding siRNA knockdown (%KD) of GOLPH3 and SUB1 in the indicated cell lines with amplified (AMP) or normal (NL) GOLPH3 copy number. ND = not determined.
To assess the cancer-relevance of GOLPH3, SUB1 or both, knockdown assays using pooled siRNAs (Fig. 1f) were performed to gauge the dependence of human tumor (NSCLC and melanoma) cell lines on either gene for their transformed phenotype relative to the underlying copy number status and overall protein expression level (Supp Fig. S2a). Knockdown of GOLPH3 resulted in significant loss of anchorage independent growth in CRL-5889 (NSCLC), Sbcl2 and SK-MEL-5 (melanoma), three human cancer cell lines with 5p13 amplification and high expression level. However, a similar level of knockdown in 1205LU, a melanoma cell line without the 5p13 CNA and with low protein expression, resulted in minimal effect on anchorage independence (Fig. 1f). In contrast, equally effective knockdown of SUB1 in the 5p13-amplified tumor lines had either no or relatively modest effects on anchorage independence.
To confirm that the observed knockdown activity was not due to an off-target effect of the GOLPH3 siRNA, we deconvoluted the siRNA pool and verified that two of the four independent siRNA duplexes (siRNAs #3 and #4) were effective at knocking down GOLPH3 (Supp Fig. S2b), which led to potent suppression of soft agar growth and inhibition of proliferation in 5p13-amplified CRL-5889 cells (Fig. 2a). Similarly effective knockdown in 1205LU without 5p13 gain and low GOLPH3 expression showed minimal effect, indicating that acute GOLPH3 depletion is not generally toxic to all cells (Fig. 2a and Supp Fig. S2b). Importantly, specificity of siRNA#3 against GOLPH3 was further documented by rescue of A459 proliferation by a GOLPH3 cDNA engineered to be insensitive to siRNA#3 (siRES) (Fig. 2b). Together, these genetic loss-of-function studies using RNAi-mediated knockdown pointed to GOLPH3 as the likely functionally active target of this amplification.
Figure 2. Functional validation of GOLPH3.
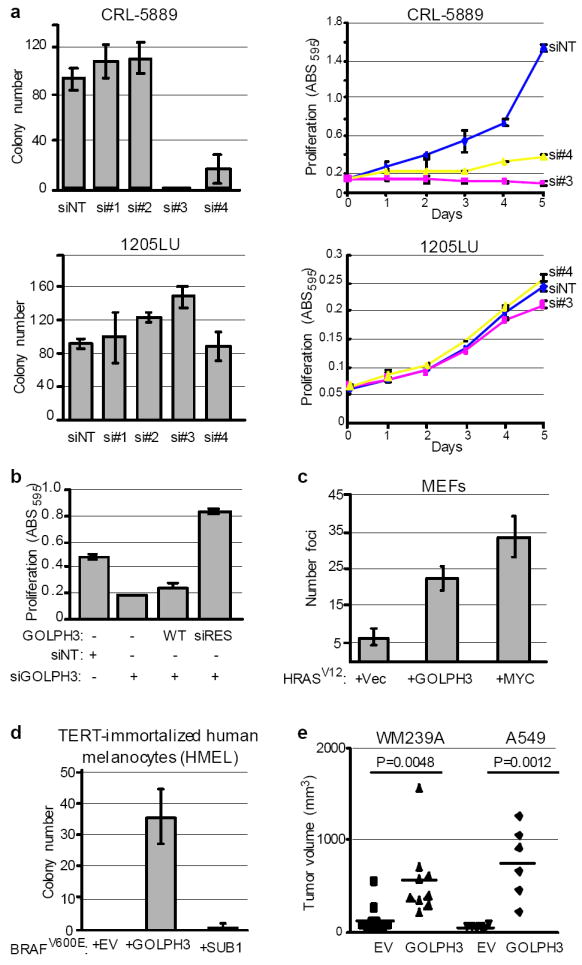
a, The indicated cell lines were treated with non-targeting siRNA (siNT) or individual siRNAs against GOLPH3 (si#1-si#4) to assay for effect on anchorage-independent growth in soft agar (left panels) and cell proliferation (right panels). Bars indicate ±S.D. b, A549 parental cells and those expressing either wild type (WT) or siRNA resistant GOLPH3 (siRES) were treated with either non-targeting siRNA (siNT) or siRNA against GOLPH3 (siGOLPH3) and assessed for effect on cell proliferation. Bars indicate ±S.D. Shown are endpoint values for day 5. c, Primary Ink4a/Arf-deficient MEFs were transfected with the indicated vectors expressing HRASV12, MYC and GOLPH3. Vec = LacZ vector control; bars indicate ±S.D.; Two-tailed t-test: HRASV12 + GOLPH3 vs. HRASV12 + Vec, p=0.0018. d, TERT-immortalized human melanocytes (HMEL) expressing activated BRAFV600E were transduced with either GOLPH3 or SUB1 to assay for effect on anchorage-independent growth in soft agar. Bars indicate ±S.D.; Two-tailed t-test for colony number: EV vs. GOLPH3, p=0.0020; EV vs. SUB1, p=0.3739. e, The indicated cell lines were transduced with GOLPH3 to assay for effect on growth of mouse xenograft tumors.
We next examined the impact of ectopic GOLPH3 expression in a number of model systems. GOLPH3 was capable of effecting malignant transformation of both primary non-transformed mouse and human cells. Specifically, in the classical co-transformation assay, GOLPH3 cooperated with activated HRASV12 to increase transformed focus formation in Ink4a/Arf- deficient primary mouse embryonic fibroblasts (MEF) (Fig. 2c; 3.4-fold increase relative to HRASV12 alone). In primary human cells, GOLPH3 cooperated with oncogenic BRAFV600E in TERT-immortalized human melanocytes (hereafter referred to as “HMEL”)12 to confer anchorage independent growth in soft agar, whereas SUB1 showed no transforming activity in this system (Fig. 2d). Similar activity was also observed in the 1205LU melanoma cell line (no 5p13 amplification, low GOLPH3 expression), wherein GOLPH3 over-expression (Supp Fig. S2c) enhanced anchorage independent growth and cell proliferation in vitro (Supp Fig. S2d and data not shown). Lastly, GOLPH3 over-expression (Supp Fig. S2e-f) significantly enhanced xeno-transplanted tumor growth (Fig. 2e) of human melanoma (WM239A) and NSCLC (A549) cell lines, both without 5p13 amplification. This series of reinforcing knockdown and over-expression studies demonstrates that GOLPH3 is a bona fide oncogene with potent transforming activity.
Yeast genetics links GOLPH3 to mTOR
GOLPH3 (alias GPP34; GMx33) was initially identified as a peripheral membrane protein localized to the trans-Golgi Network (TGN)13;14. Subsequent work with the rat homolog, GMx33, revealed that the protein is dynamically associated with the trans-Golgi matrix, rapidly moving from the TGN to the cytosol with localization in endosomes and at the plasma membrane15. As a class, TGN-localizing proteins have not been directly implicated in cancer pathogenesis. Thus, we first confirmed by confocal microscopy that both exogenously-expressed and endogenous human GOLPH3 indeed co-localized to the Golgi apparatus via co-immunofluorescence with the TGN marker, TGN46, and to endosome-like structures as described previously15 (Fig. 3a).
Figure 3. GOLPH3 interacts with VPS35 and influences cell size.

a, (top two panels) 1205LU melanoma cells stably-expressing GOLPH3 were co-immunostained for HA (GOLPH3HA; green) and TGN46 (Golgi marker; red). (Bottom panel) A549 cells were co-immunostained for GOLPH3 (green) and TGN46 (Golgi marker; red). DNA was labeled with DAPI. Arrows indicate GOLPH3 positive endosome-like structures. b, The indicated constructs were transiently expressed in 293T cells and proteins were immunoprecipitated (IP) with anti-HA (left panel) or anti-V5 (right panel) for immunoblotting with the indicated antibodies. NS = non-specific band. c, A549 cells were co-immunostained for GOLPH3 (green) and VPS35 (red). DNA was labeled with DAPI (blue). Arrows indicate GOLPH3 positive co-staining at endosome structures. d, Automated Quantitative Analysis (AQUA®) of phospho-S6KThr389 (red) in two representative lung adenocarcinomas. Cytokeratin (green) defines tumor and non-nuclear compartments. FISH ratio = 5p13:reference ratio as determined by FISH on consecutive TMA sections. Magnification = 20x.
To gain mechanistic insights into the biological functions of GOLPH3, we screened for GOLPH3-interacting proteins using the yeast two-hybrid system (Supp Information and Supp Table S2). Most notable among the GOLPH3-interacting proteins was VPS35, a highly conserved member of the cargo-recognition complex of the retromer, which regulates retrograde transport of proteins that include transmembrane receptors from endosomes to the TGN16. After documenting bait-dependent interaction of GOLPH3 with VPS35 in yeast (Supp Fig. S3a-b), we showed physical interaction of VPS35 with both exogenously-expressed and endogenous GOLPH3 in human cells by co-immunoprecipitation (Fig. 3b and Supp Fig. S3c). Confocal co-immunofluorescence studies further confirmed co-localization of endogenous VPS35 and GOLPH3 at endosome-like structures (Fig. 3c).
A large-scale chemical genomic profiling screen in S. cerevisiae17 has found that deletion mutants of VPS35 and VPS29 exhibited altered sensitivity to rapamycin, an inhibitor of TOR signaling, suggesting that the retromer complex might function in the TOR signaling pathway in budding yeast. Thus, we postulated that GOLPH3 might regulate the mammalian ortholog of TOR (mTOR) thereby contributing to the pro-tumorigenic effects of GOLPH3. This hypothesis is supported by the observation that, in human NSCLC tumor specimens, high 5p13 copy number was associated with increased mTOR expression and elevated phosphorylation of the mTOR substrate, S6 Kinase (S6K) by AQUA® quantitative immunofluorescence18 (Fig. 3d and Supp Tables S3-S4). Specifically, mTOR expression level was associated with cytoplasmic, but not nuclear nor total, phospho-S6KThr389 (pS6K) level (Pearson’s R=0.42, p=0.001). When the 5p13 copy number status was binarized into normal (with FISH-determined signal <1.5) and gained (FISH signal >=1.5), a significant correlation with increased mTOR (Spearman’s rho=0.475, p=0.04) and cytoplasmic pS6K (Spearman’s rho=0.724, p<0.0001) was observed, signifying that 5p13 CNA is positively correlated with mTOR-pS6K activity in the adenocarcinoma subtype of NSCLC. Importantly, even when the 5p13 copy number was treated as a continuous variable, significant correlation was still observed with cytoplasmic pS6K in this subtype of NSCLC (Pearson’s R=0.513, p<0.025; Table S4). Taken together, this correlative relationship in human cancers, coupled with the yeast genetic interaction data, supports the hypothesis that GOLPH3 regulates mTOR activity in mammalian cells.
GOLPH3 activates mTOR signaling
To test the hypothesis that GOLPH3 activates mTOR signaling, we first examined the biological consequences of GOLPH3 modulation. Consistent with mTOR’s role in cell size regulation, RNAi-mediated GOLPH3 depletion led to a significant cell size reduction in A549, an effect that was comparable to treatment with rapamycin19 (Fig. 4a). Next, we assayed the biochemical consequences of GOLPH3 modulation.
Figure 4. GOLPH3 modulates phosphorylation status of mTOR substrates.
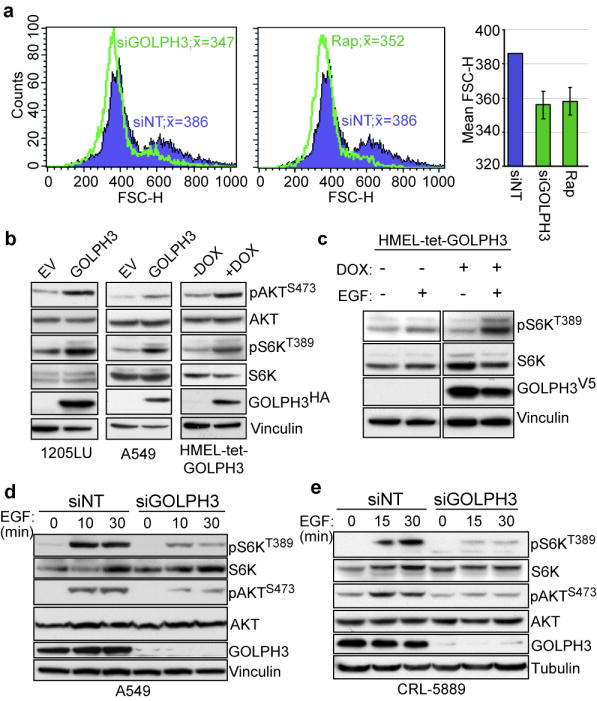
a, Representative flow histograms for A549 cells were treated with non-targeting (siNT, blue), siRNA against GOLPH3 (siGOLPH3, left panel, green) or rapamycin (Rap, middle panel, green). Peak FSC-H indicated in histograms. (Right panel) Mean FSC-H for multiple experiments (n=3); Bars indicate ±S.D. b, Protein lysates extracted from 1205LU (left panel), A549 (middle panel) and HMEL-tet-GOLPH3 (right panel; with or without doxycycline (DOX)) cells expressing GOLPH3 were immunoblotted with the indicated antibodies. c, HMEL-tet-GOLPH3 cells were serum depleted and propagated with or without doxycycline (DOX), followed by treatment with or without EGF for 30 min for immunoblot analysis with the indicated antibodies. d, A549 and e, CRL-5889 cells were serum depleted and treated with either non-targeting (siNT) or siRNA against GOLPH3 (siGOLPH3), followed by growth factor stimulation with EGF for immunoblot analysis with the indicated antibodies.
Since the mTOR substrate S6K is a kinase effector of cell size that is phosphorylated at Thr389 by mTOR20;21, we investigated phospho-S6K status as a readout of the mTORC1 axis. Consistent with the human tumor data showing elevated pS6K in 5p13 amplified NSCLC specimens, GOLPH3 over-expression resulted in elevated pS6K in tumor cell lines (1205LU and A549) as well as in HMEL-tet-GOLPH3, a TERT-immortalized human melanocyte cell line engineered with a tet-regulated GOLPH3 expression construct (Fig. 4b). Substantiating these observations using the inducible system, GOLPH3 induction further enhanced pS6K accumulation in response to growth factor stimulation by epidermal growth factor (EGF; Fig. 4c). At the same time, we monitored phosphorylation of AKT (pAKT) at Ser473, a direct substrate of mTORC222;23. Similar to mTORC1-mediated phosphorylation of S6K, we observed a comparable increase in pAKT phosphorylation in GOLPH3 over-expressing cells (Fig. 4b), suggesting that GOLPH3 can enhance signaling through both mTOR-associated complexes. Moreover, AKT and S6K phosphorylation was significantly abrogated in siGOLPH3-treated NSCLC A549 and CRL-5889 cells compared to control cells in response to EGF (Fig. 4d-e). Additional biochemical analyses showed altered phosphorylation of the mTOR substrates S6KThr389, p4E-BP1Thr37/46 and AKTSer473 with little to no affect on other signaling proteins including PTEN, MEK1/2 and p44/42 (Erk1/2) among others (Supp Fig. S4). Collectively, these data provided strong biochemical evidence that GOLPH3 activates mTOR signaling through phosphorylation of both mTORC1- and mTORC2-specific substrates.
GOLPH3 modulates rapamycin sensitivity
Complementing the genetic studies above, we next asked whether GOLPH3 expression levels affect tumor cell sensitivity to pharmacological mTOR inhibition in vivo. Here, we selected two human melanoma cells, 1205LU and WM239A, based on their normal GOLPH3 copy-number and low protein expression as well as their ability to readily form subcutaneous (SQ) tumors in vivo. Parental cells were engineered to stably express either empty vector (EV) or GOLPH3 for orthotopic subcutaneous transplantation into immunodeficient animals for tumor growth. Next, we compared the degree of tumor growth inhibition (%TGI) in GOLPH3-expressing versus EV-control tumors upon rapamycin treatment.
Consistent with above (Fig. 2e), 1205LU-GOLPH3 cells exhibited a significant growth advantage compared to 1205LU-EV control cells in vivo (1.9-fold increase in tumor volume at 36 days post-injection in vehicle control cohort, p-value=0.0148). Upon tumors reaching a baseline volume of ~100 mm3, the animals were randomized into control and treatment cohorts for intraperitoneal injection of either vehicle or rapamycin (6.0 mg/kg) every other day. The treatment trial was terminated when one animal in any cohort had to be sacrificed for tumor burden according to IACUC regulations. The inhibitory effect of rapamycin on mTOR activity of treated tumors was verified by Western analysis (Supp Fig. S2g). The efficacy of rapamycin treatment was then calculated as %TGI of treated versus non-treated cohorts after 4 doses (day 8 of trial) for WM239A and 6 doses (day 12 of trial) for 1205LU. Indeed, GOLPH3-expressing tumors were significantly more sensitive to rapamycin in vivo (Fig. 5a-c and Supp Fig. S5). Therefore, we conclude that GOLPH3’s biochemical effect on mTOR signaling is a critical aspect of its oncogenic function, as inhibition by rapamycin effectively blocked the growth advantage conferred by GOLPH3 in vivo.
Figure 5. The in vivo GOLPH3 growth advantage is abrogated by treatment with rapamycin.
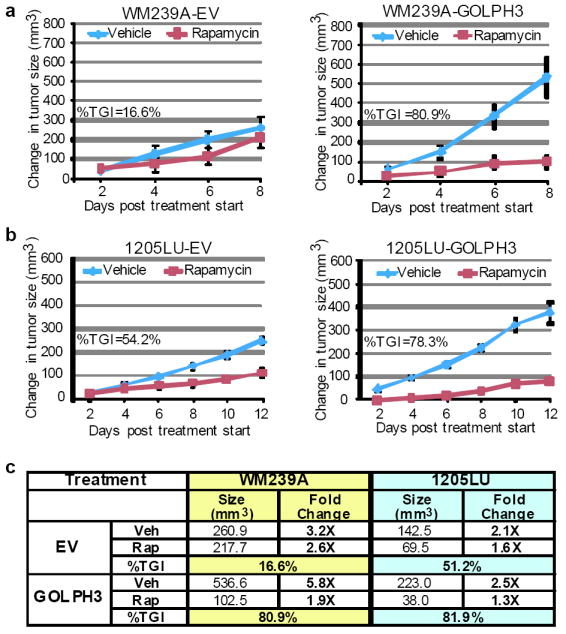
a, b Mice harboring tumors of the melanoma cell lines a, WM239A and b, 1205LU transduced with empty vector (EV; left panels) or GOLPH3 (right panels) were treated with vehicle or rapamycin (6.0 mg/kg) at two-day increments following treatment onset (tumor baseline volume ~100 mm3). Growth curves plotted as mean change in tumor volume relative to baseline starting volume for each group. Bars indicate ±S.E.M. for biological replicates. %TGI = percent tumor growth inhibition at time course endpoint. c, Table summarizing data from the rapamycin treatment xenograft studies in Fig. 5a at the same time point (day 8, post 4 doses). Veh=vehicle; Rap=rapamycin; %TGI = percent tumor growth inhibition. Note 1205LU-GOLPH3 tumors treated with vehicle grew 2.5X in size during the 8 days of treatment. In comparison, WM239A-GOLPH3 tumors grew 5.8X in size during the same period of 8 days. The %TGI in these two cohorts of tumors was similar, at 81.9% and 80.9% respectively, indicating that growth rate did not impact on the response to rapamycin.
Discussion
In this study, integrative analyses of genome-wide copy number and expression data coupled with reinforcing knockdown and over-expression assays in vitro and in vivo led to the identification of GOLPH3 as a bona fide oncoprotein frequently targeted for copy number gain/amplification in diverse human cancers. A suspect role for the Golgi apparatus in regulating cancer-relevant signaling has been speculated based on observation that some cytoplasmic membrane oncoproteins, such as RAS, can functionally signal when temporally present at the Golgi apparatus24. However, proteins such as GOLPH3 that are predominantly localized to the TGN have not been directly linked on a genetic level to cancer; therefore, GOLPH3 represents a first-in-class Golgi oncoprotein. Mechanistically, we show that enhanced activation of mTOR signaling represents a molecular basis for GOLPH3’s oncogenic activity. In this light, enhanced and sustained mTOR activation in vivo would be expected to confer a significant growth advantage to cancer cells, a likely basis for increased GOLPH3 gene copy number or expression in a large fraction of human cancers.
Although we show through genetic and pharmacological studies that activation of mTOR is essential for GOLPH3’s tumorigenicity, the precise structural and biochemical basis for GOLPH3’s activity remains to be fully elucidated. Our molecular data on the physical interaction between GOLPH3 and the retromer complex, which is responsible for protein trafficking between endosomes and the TGN16, for the first time genetically implicates this biological process in cancer. This is consistent with recent reports on the essential role of the retromer and retrograde transport in regulation of the Wntless receptor and proper secretion of the WNT morphogen25, which is important in both normal and neoplastic development. Along the same line, depletion of VPS35 in Drosophila inhibited endocytosis of RTKs with concomitant alterations in downstream signaling26. Taken together, these data raise the possibility that GOLPH3 might function with VPS35 and the retromer to regulate receptor recycling of key molecules thereby influencing downstream signaling through mTOR.
It has recently been discovered that Vps74, the yeast homolog of GOLPH3, is required for proper docking and localization of glycosyltransferases to the Golgi apparatus27;28. Protein glycosylation is one of the most prevalent forms of post-translational modification, and altered glycosylation is a hallmark feature of cancers29. It is noteworthy that glycosylation is known to be important for growth factor-activation of transmembrane receptors, since glycosylation mediates receptor sorting, ligand binding and endocytosis29;30. Thus, it is plausible that human GOLPH3 might serve a similar function in glycosyltransferase docking as in S. cerevisiae and therefore might influence the downstream mTOR signaling response through its effect on membrane RTKs.
The PI3K-AKT-mTOR signaling cascade is activated in nearly all cancers and hence represents an intense focus for cancer drug development. However, the clinical response to rapamycin and its analogs has been feeble11. Our demonstration of GOLPH3’s role in activating mTOR signaling and conferring increased sensitivity to rapamycin in preclinical setting raises the possibility that GOLPH3 expression level or copy number status may predict sensitivity to mTOR inhibitors. Indeed, endpoint analysis of our preclinical treatment studies showed that rapamycin was significantly more effective against xenograft tumors expressing high level of GOLPH3 (p = 0.0268; 1205LU-GOLPH3 vs. 1205LU-EV tumor volumes at endpoint; Supp Fig. S5b), thereby suggesting that GOLPH3 levels may be a positive predictor of rapamycin sensitivity. Although the predictive value of GOLPH3 as a biomarker remains to be demonstrated, the formulation of this hypothesis highlights the importance of mechanistic insights beyond functional and clinicopathological validation in the translation of cancer genomics.
METHODS SUMMARY
Array-CGH profiles of melanoma, NSCLC and colon adenocarcinoma were analyzed as previously described31. FISH analyses on TMAs of 9 tumor types using 5p13 and CEP1 centromeric probes determined frequency of copy number gain. Real-time quantitative genomic PCR in informative samples containing the 5p13 CNA defined an MCR containing 4 genes, and integration with NSCLC tumor and cell line transcriptome profiles identified MCR-resident genes with copy number correlated expression patterns. Oncogenic activity was assayed by in vitro (proliferation, MEF transformation, and anchorage independent growth in soft agar) and in vivo (subcutaneous tumor growth) through loss-of-function (by RNAi targeting GOLPH3) and gain-of-function (by over-expression of GOLPH3) in primary (MEF, HMEL) and transformed mouse and human cells. The yeast 2-hybrid screen was performed using a human cDNA brain library with a GOLPH3 bait construct. Serum- and EGF-induced mTOR and AKT activity was measured with pS6KThr389 and pAKTSer473 as readout by Western blotting. Total mTOR and pS6KThr389 were used to quantitate relative protein expression level on tumor tissue microarrays by AQUA® to correlate expression with copy number status determined by FISH. Rapamycin sensitivity was determined by drug treatment in in vivo xenograft assays.
Supplementary Material
Acknowledgments
We thank Dr. Ron DePinho for critical reading of the manuscript, and Dr. Lew Cantley as well as members of the Chin laboratory for helpful discussion. We thank Haoqiang Ying for assistance with confocal microscopy. Human GOLPH3 antibody JJB was kindly provided by JJ Bergeron of McGill University at Montreal, Quebec. Mouse monoclonal antibody against human GOLPH3, C19, was generated at Dana-Farber/Harvard Cancer Center Monoclonal Antibody Core Facility. K.L.S is currently supported by a Postdoctoral Fellowship from the American Cancer Society, and K.L.S and O.K. were previously supported by a National Institute of Health Training Grant appointment in the Department of Dermatology at Brigham and Women’s Hospital, Boston, MA. The AQUA® IF study was supported by grant from the NIH to D. Rimm (RO-1 CA 114277). This work is primarily supported by grants from the NIH to L. Chin (RO1 CA93947; P50 CA93683).
Footnotes
Author Contribution O.K. identified GOLPH3 as an oncogene target of 5p13; K.L.S. performed oncogene validation and mechanistic studies; E.I. and A.P. performed TMA FISH analysis; H.R.W. and D.E.F. performed the HMEL anchorage-independent growth assay; S.D. and J.W. assisted with immunofluorescence assays and provided technical support; M.W. performed the co-immunoprecipitation assays; V.A. and D.L.R performed AQUA® analysis; S.C. assisted with cell culture studies; A.S. aided phospholipid and biochemical analyses; M-C.L. and K-K.W. performed rapamycin xenograft assays; Y.X. performed computational analyses; T.F. and J.H. provided technical support; L.C. supervised the experiments and data interpretation; K.L.S. and L.C. wrote the manuscript.
Full Methods and any associated references are available in the online version of the manuscript at www.nature.com/nature.
Supplementary Information is linked to the online version of the paper at www.nature.com/nature.
References
- 1.Manning BD, Cantley LC. AKT/PKB signaling: navigating downstream. Cell. 2007;129(7):1261–1274. doi: 10.1016/j.cell.2007.06.009. [DOI] [PMC free article] [PubMed] [Google Scholar]
- 2.Wullschleger S, Loewith R, Hall MN. TOR signaling in growth and metabolism. Cell. 2006;124(3):471–484. doi: 10.1016/j.cell.2006.01.016. [DOI] [PubMed] [Google Scholar]
- 3.Shima H, et al. Disruption of the p70(s6k)/p85(s6k) gene reveals a small mouse phenotype and a new functional S6 kinase. Embo J. 1998;17(22):6649–6659. doi: 10.1093/emboj/17.22.6649. [DOI] [PMC free article] [PubMed] [Google Scholar]
- 4.Montagne J, et al. Drosophila S6 kinase: a regulator of cell size. Science. 1999;285(5436):2126–2129. doi: 10.1126/science.285.5436.2126. [DOI] [PubMed] [Google Scholar]
- 5.Oldham S, Montagne J, Radimerski T, Thomas G, Hafen E. Genetic and biochemical characterization of dTOR, the Drosophila homolog of the target of rapamycin. Genes Dev. 2000;14(21):2689–2694. doi: 10.1101/gad.845700. [DOI] [PMC free article] [PubMed] [Google Scholar]
- 6.Zhang H, Stallock JP, Ng JC, Reinhard C, Neufeld TP. Regulation of cellular growth by the Drosophila target of rapamycin dTOR. Genes Dev. 2000;14(21):2712–2724. doi: 10.1101/gad.835000. [DOI] [PMC free article] [PubMed] [Google Scholar]
- 7.Fingar DC, Blenis J. Target of rapamycin (TOR): an integrator of nutrient and growth factor signals and coordinator of cell growth and cell cycle progression. Oncogene. 2004;23(18):3151–3171. doi: 10.1038/sj.onc.1207542. [DOI] [PubMed] [Google Scholar]
- 8.Guertin DA, Sabatini DM. Defining the role of mTOR in cancer. Cancer Cell. 2007;12(1):9–22. doi: 10.1016/j.ccr.2007.05.008. [DOI] [PubMed] [Google Scholar]
- 9.Yang Q, Guan KL. Expanding mTOR signaling. Cell Res. 2007;17(8):666–681. doi: 10.1038/cr.2007.64. [DOI] [PubMed] [Google Scholar]
- 10.Abraham RT, Wiederrecht GJ. Immunopharmacology of rapamycin. Annu Rev Immunol. 1996;14:483–510. doi: 10.1146/annurev.immunol.14.1.483. [DOI] [PubMed] [Google Scholar]
- 11.Sabatini DM. mTOR and cancer: insights into a complex relationship. Nat Rev Cancer. 2006;6(9):729–734. doi: 10.1038/nrc1974. [DOI] [PubMed] [Google Scholar]
- 12.Garraway LA, et al. Integrative genomic analyses identify MITF as a lineage survival oncogene amplified in malignant melanoma. Nature. 2005;436(7047):117–122. doi: 10.1038/nature03664. [DOI] [PubMed] [Google Scholar]
- 13.Wu CC, et al. GMx33: a novel family of trans-Golgi proteins identified by proteomics. Traffic. 2000;1(12):963–975. [PubMed] [Google Scholar]
- 14.Bell AW, et al. Proteomics characterization of abundant Golgi membrane proteins. J Biol Chem. 2001;276(7):5152–5165. doi: 10.1074/jbc.M006143200. [DOI] [PubMed] [Google Scholar]
- 15.Snyder CM, Mardones GA, Ladinsky MS, Howell KE. GMx33 associates with the trans-Golgi matrix in a dynamic manner and sorts within tubules exiting the Golgi. Mol Biol Cell. 2006;17(1):511–524. [Google Scholar]
- 16.Bonifacino JS, Hurley JH. Retromer. Curr Opin Cell Biol. 2008;20(4):427–436. doi: 10.1016/j.ceb.2008.03.009. [DOI] [PMC free article] [PubMed] [Google Scholar]
- 17.Xie MW, et al. Insights into TOR function and rapamycin response: chemical genomic profiling by using a high-density cell array method. Proc Natl Acad Sci U S A. 2005;102(20):7215–7220. doi: 10.1073/pnas.0500297102. [DOI] [PMC free article] [PubMed] [Google Scholar]
- 18.Camp RL, Chung GG, Rimm DL. Automated subcellular localization and quantification of protein expression in tissue microarrays. Nat Med. 2002;8(11):1323–1327. doi: 10.1038/nm791. [DOI] [PubMed] [Google Scholar]
- 19.Fingar DC, Salama S, Tsou C, Harlow E, Blenis J. Mammalian cell size is controlled by mTOR and its downstream targets S6K1 and 4EBP1/eIF4E. Genes Dev. 2002;16(12):1472–1487. doi: 10.1101/gad.995802. [DOI] [PMC free article] [PubMed] [Google Scholar]
- 20.Burnett PE, Barrow RK, Cohen NA, Snyder SH, Sabatini DM. RAFT1 phosphorylation of the translational regulators p70 S6 kinase and 4E-BP1. Proc Natl Acad Sci U S A. 1998;95(4):1432–1437. doi: 10.1073/pnas.95.4.1432. [DOI] [PMC free article] [PubMed] [Google Scholar]
- 21.Isotani S, et al. Immunopurified mammalian target of rapamycin phosphorylates and activates p70 S6 kinase alpha in vitro. J Biol Chem. 1999;274(48):34493–34498. doi: 10.1074/jbc.274.48.34493. [DOI] [PubMed] [Google Scholar]
- 22.Hresko RC, Mueckler M. mTOR.RICTOR is the Ser473 kinase for Akt/protein kinase B in 3T3-L1 adipocytes. J Biol Chem. 2005;280(49):40406–40416. doi: 10.1074/jbc.M508361200. [DOI] [PubMed] [Google Scholar]
- 23.Sarbassov DD, Guertin DA, Ali SM, Sabatini DM. Phosphorylation and regulation of Akt/PKB by the rictor-mTOR complex. Science. 2005;307(5712):1098–1101. doi: 10.1126/science.1106148. [DOI] [PubMed] [Google Scholar]
- 24.Chiu VK, et al. Ras signalling on the endoplasmic reticulum and the Golgi. Nat Cell Biol. 2002;4(5):343–350. doi: 10.1038/ncb783. [DOI] [PubMed] [Google Scholar]
- 25.Eaton S. Retromer retrieves wntless. Dev Cell. 2008;14(1):4–6. doi: 10.1016/j.devcel.2007.12.014. [DOI] [PubMed] [Google Scholar]
- 26.Korolchuk VI, et al. Drosophila Vps35 function is necessary for normal endocytic trafficking and actin cytoskeleton organisation. J Cell Sci. 2007;120(Pt 24):4367–4376. doi: 10.1242/jcs.012336. [DOI] [PubMed] [Google Scholar]
- 27.Schmitz KR, et al. Golgi localization of glycosyltransferases requires a Vps74p oligomer. Dev Cell. 2008;14(4):523–534. doi: 10.1016/j.devcel.2008.02.016. [DOI] [PMC free article] [PubMed] [Google Scholar]
- 28.Tu L, Tai WC, Chen L, Banfield DK. Signal-mediated dynamic retention of glycosyltransferases in the Golgi. Science. 2008;321(5887):404–407. doi: 10.1126/science.1159411. [DOI] [PubMed] [Google Scholar]
- 29.Ohtsubo K, Marth JD. Glycosylation in cellular mechanisms of health and disease. Cell. 2006;126(5):855–867. doi: 10.1016/j.cell.2006.08.019. [DOI] [PubMed] [Google Scholar]
- 30.Takahashi M, Tsuda T, Ikeda Y, Honke K, Taniguchi N. Role of N-glycans in growth factor signaling. Glycoconj J. 2004;20(3):207–212. doi: 10.1023/B:GLYC.0000024252.63695.5c. [DOI] [PubMed] [Google Scholar]
- 31.Maser RS, et al. Chromosomally unstable mouse tumours have genomic alterations similar to diverse human cancers. Nature. 2007;447(7147):966–971. doi: 10.1038/nature05886. [DOI] [PMC free article] [PubMed] [Google Scholar]
Associated Data
This section collects any data citations, data availability statements, or supplementary materials included in this article.