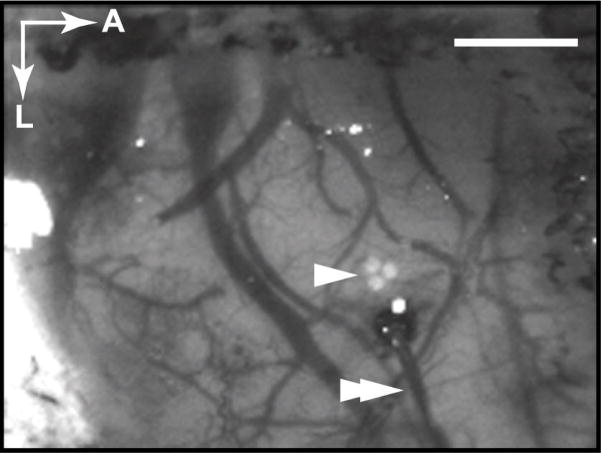
Figure 1. Spectroscopic fiber positioning.
Raw image taken at 569 nm showing the area of cortex exposed under the thinned skull. The location of the hemodynamic response to electrical hindpaw stimulation was first determined with single wavelength imaging at 569 nm. The position of the spectroscopic fiber was identified by shining light through the fiber bundle in reverse, producing an image of the triangular fiber orientation on the cortex (single arrowhead). The fiber position was adjusted to sample the capillary bed at the center of the response area. The image of the fiber position was also used as a region of interest when comparing the results from fiber spectroscopy and 2DOS. With this configuration, a microelectrode (double arrowhead) may also be used for concurrent electrophysiology (data not shown). A, anterior; L, lateral. Scale bar, 1 mm.

