

Abstract
Objective
To evaluate the impact of a multifaceted, school-based intervention on inner city youth at high risk for type 2 diabetes mellitus (T2DM) and to determine whether the addition of coping skills training (CST) and health coaching improves outcomes.
Method
198 students in New Haven, CT at risk for T2DM (BMI > 85th percentile and family history of diabetes) were randomized by school to an educational intervention with or without the addition of CST and health coaching. Students were enrolled from 2004–2007 and followed for 12 months.
Results
Students in both groups showed some improvement in anthropometric measures, lipids, and depressive symptoms over 12 months. BMI was not improved by the intervention. Students who received CST showed greater improvement on some indicators of metabolic risk than students who received education only.
Conclusion
A multifaceted, school-based intervention may hold promise for reducing metabolic risk in urban, minority youth.
Introduction
With the significant increase in the number of youth with obesity and type 2 diabetes mellitus (T2DM), effective approaches to dealing with this problem are urgently needed. Although previous studies have demonstrated that programs combining educational, behavioral, and infrastructure components can be successful in preventing cardiovascular disease in children (e.g., Harrell et al., 1998, Luepker et al., 1996), such studies have not focused on youth at highest risk for T2DM -- inner city, minority youth.
Obesity and Risk for T2DM in Youth
Obesity, defined as Body Mass Index (BMI) ≥ 95th percentile, has rapidly increased in youth; rates have risen among adolescents from 5% in 1970 to over 17% in 2006 (Department of Health and Human Services, 2002, Ogden et al., 2008). Obesity in adolescence is a strong predictor of obesity in adulthood, and obese adolescents are more likely to exhibit increased insulin levels and insulin resistance (IR), indicating the need for early intervention to prevent progression to T2DM (Conwell et al., 2004, Singh et al., 2008, Uwaifo et al., 2002). Recent estimates from a population-based study suggest that the prevalence of T2DM among adolescents is .22 cases per 1,000 youth, with higher rates for Hispanic (.48 cases per 1,000) and Black adolescents (1.05 cases per 1,000), and these rates are likely to increase with the rise in prevalence of obesity, particularly among minority youth (Liese, 2006, Ogden et al., 2008).
Behavioral Interventions
Given the rapid rise in obesity among youth, researchers have focused on developing behavioral interventions with the goal of reducing or preventing increases in BMI. A recent meta-analytic review of 64 programs designed to prevent obesity in youth found that the average effect size across studies was significant, but very small (mean r = .04), and that only 21% of programs had positive effects on weight gain prevention (Stice et al., 2006). On the other hand, a Cochrane review of 64 randomized clinical interventions designed to treat obesity in youth concluded that behavioral lifestyle interventions had a significant effect on reducing BMI in adolescents up to 12 months post-intervention, noting that the most effective interventions combined dietary, physical activity, and behavioral components (Luttikhuis et al., 2009). These findings suggest the promise of behavioral interventions, while highlighting the need for novel approaches for youth at risk for T2DM, particularly urban, minority youth, who may be at the highest risk – rates of obesity as high as 50% have been observed in such populations (The HEALTHY Study Group, 2009).
Knowledge, Skills, and Behavior Change
Studies of obese youth suggest that their understanding of basic nutrition and activity is lacking (Grey et al., 2009). Thus, approaches to lifestyle change in high risk youth need to include education on the basics of nutrition (i.e., the Food Pyramid and extra sources of calories in the diet), and physical activity (i.e., decreasing sedentary behaviors and increasing aerobic capacity) (Davis et al., 2007, Spear et al., 2007). However, this knowledge is not sufficient to produce behavior change, and the lifestyle changes recommended to treat overweight/obesity in youth also require skills to implement knowledge (Spear et al., 2007). Further, obese youth are at increased risk for depression, which may have a negative effect on their ability to engage in healthy lifestyle behaviors (Goodman and Whitaker, 2002).
Interventions need to address barriers to incorporating these lifestyle changes, and training in coping skills has been shown to help people carry out healthy lifestyle behaviors (Grey et al., 2000). Coping Skills Training (CST) is based on Bandura’s social learning theory, which posits that increasing self-efficacy results in positive behavior change (Bandura, 1986). CST focuses on retraining non-constructive coping styles into more productive behaviors, focusing on social problem solving, communication skills, stress reduction, cognitive behavior modification, and conflict resolution (Davidson et al., 1997). Our ongoing studies have demonstrated that in youth with type 1 diabetes, CST may prevent untoward weight gain in girls, in addition to improving metabolic control and psychosocial well-being (Grey et al., 2000).
Health coaching may also be an effective way to support the development and maintenance of healthy lifestyle changes in overweight youth (Saelens et al., 2002). Health coaching is a patient-centered process that consists of setting goals, identifying obstacles, and mobilizing existing supports. In pilot work, health coaching conducted over the telephone, in combination with a multi-component behavioral weight control intervention for adolescents, has shown promise as an effective way to reduce BMI levels and increase healthy behaviors in some youth (Alm et al., 2008, Grey et al., 2004, Saelens et al., 2002). The current study uses health coaching to reinforce coping skills, in addition to nutrition and physical education goals.
In this paper, we report the results of a randomized clinical trial of a program to reduce the risk of T2DM in inner-city, minority youth. Recent studies suggest that as many as 50% of minority, inner city youth are obese and that the rate of T2D in these communities is increasing at a rapid rate (The HEALTHY Study Group, 2009). The purpose of this study is to evaluate the impact of a multifaceted intervention on youth at high risk for T2DM and to determine whether the addition of CST and health coaching improves outcomes. We expected that youth who received the experimental intervention would have lowered metabolic risk (i.e., BMI, adiposity, lipids) and improved health behaviors (i.e., health behaviors, depression, self-efficacy) compared to youth who received the educational intervention alone.
Method
Participants
Students (n = 198) were recruited from 6 schools in New Haven, CT. Seventh grade students were eligible if they had a BMI ≥ 85th percentile, family history of T2DM, parents were English- or Spanish-speaking, and had no other major health problems. Youth and their parents/guardians assented/consented to participate in line with institutional review board requirements (consent forms were translated into Spanish for Spanish-speaking parents/guardians). Table 1 indicates the characteristics of the sample by group.
Table 1.
Sample Characteristics by Group, New Haven, CT 2004–2007
| Variable | CST (N=112) |
GE (N=86) |
p-value |
|---|---|---|---|
| Child age, mean (SD) | 12.8 (0.7) | 12.6 (0.7) | 0.04 |
| Child Gender, N (%) | 0.00 | ||
| Male | 42 (37.5) | 50 (58.4) | |
| Child Race/Ethnicity, N (%) | 0.06 | ||
| White | 1 (0.9) | 4 (4.7) | |
| White Hispanic | 47 (42.0) | 42 (48.8) | |
| African American | 62 (55.4) | 35 (40.7) | |
| Bi/Other | 2 (1.8) | 5 (5.8) | |
| Caregiver Age, mean (SD) | 39.5 (8.5) | 38.7 (5.7) | 0.45 |
| Caregiver Gender | |||
| Female | 99 (88.4) | 83 (96.5) | 0.02 |
| Caregiver Education, N (%) | 0.13 | ||
| < HS | 27 (24.1) | 14 (16.3) | |
| HS | 44 (39.3) | 29 (33.7) | |
| Trade School or College | 41 (36.6) | 43 (50.0) | |
| Caregiver Marital Status | |||
| Single Parent Household | 76 (67.9) | 39 (45.3) | 0.00 |
| Married/Common Law | 36 (32.1) | 47 (54.7) | |
| Caregiver Income | 0.37 | ||
| < $5,000 | 17 (15.2) | 11 (12.8) | |
| $5,000 – $9,999 | 19 (17.0) | 13 (15.1) | |
| $10,000 – $14,999 | 17 (15.2) | 14 (16.3) | |
| $15,000 – $19,999 | 11 (9.8) | 9 (10.5) | |
| $20,000 – $29,000 | 16 (14.3) | 6 (7.0) | |
| $30,000 – $39,000 | 7 (6.3) | 13 (15.1) | |
| ≥ $40,000 | 12 (10.7) | 10 (11.6) | |
| Missing | 13 (11.6) | 10 (11.6) |
Procedures
Between April, 2004 and February, 2007, students were recruited from schools with school-based health centers, similar in ethnicity and socioeconomic status, as measured with percentage of free/reduced cost meals (see CONSORT Table 2). Seventh grade was chosen because adolescents have more control over food and activity choices than younger children, and preventive interventions for T2DM appear to be more effective in adolescents than younger children (Stice et al., 2006). Questionnaire data were collected by trained research staff, and blood samples were collected by experienced research nurses from the Yale Center for Clinical Investigation in the school-based clinics on 198 participants. Students were compensated for their time with a small token (toy worth $5–10) following data collection.
Table 2.
CONSORT Table, New Haven, CT, 2004–2007
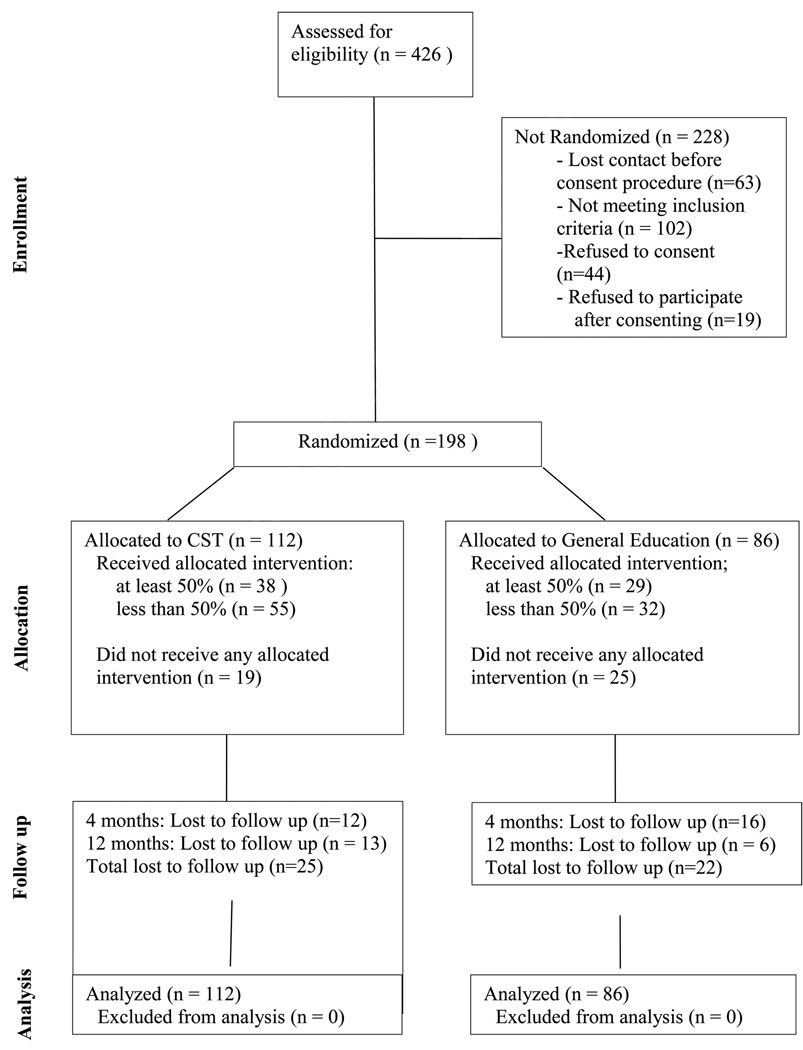 |
Schools were randomized to either the CST intervention (4 schools) or the general education (GE) intervention (2 schools). All seventh graders in the schools received the same nutrition and activity educational component (8 classes), but the CST schools received an additional 5 classes in CST and 9 months of telephone health coaching (see Table 3). Teachers in the schools were trained by study staff to deliver the intervention during regularly scheduled classes over a 16 week period. Although all seventh graders received the classroom intervention, only those who were eligible for the study (BMI ≥ 85th percentile, family history of diabetes) provided data.
Table 3.
Intervention Components, New Haven, CT 2004–2007
| Content | GE | CST |
|---|---|---|
| 1. Getting to Know You | X | |
| 2. Change in Actions | X | |
| 3. Get Up and Move | X | X |
| 4. Stress Identification and Reduction | X | |
| 5. Aim for Life Skills | X | |
| 6. Healthy Lifestyle Tic-Tac-Toe | X | X |
| 7. Resolving Conflict and Effective Communication | X | |
| 8. What’s on Your Plate? | X | X |
| 9. Size Up Your Portions | X | X |
| 10. What’s in a Food Label? | X | X |
| 11. Eating in a Fast Food World | X | X |
| 12. How to “Go Out” without Guilt | X | X |
| 13. Recipe Makeover | X | X |
| Telephone Health Coaching | X |
The intervention components were developed by the study team, which included a nutritionist, two advanced practice nurses, a psychologist, and an exercise physiologist. A non-diet, family-centered approach was used as the nutrition education component. The major dietary goal was to provide the highest nutritional quality for the lowest caloric intake. Emphasis was placed on lowering dietary fat intake to below 30%, improving food and drink choices, and decreasing total calories by focusing on appropriate portion sizes, while including culturally specific foods and being sensitive to the costs of foods. The physical activity component focused on reducing leisure-time sedentary behaviors that may compete with activity. In addition, students learned creative ways to increase physical activity in a non-structured exercise program, including culturally relevant approaches, such as aerobic dancing (e.g., hip-hop, break dancing, Afro-Caribbean, Latin), and activities that could be performed within the school setting (e.g., sports teams) or at home. Materials were developed by a registered dietician.
Nutrition and exercise educational content was enhanced in the experimental schools by the inclusion of Coping Skills Training (see Table 3). To increase students’ sense of competence and mastery, these classes began with open discussion and questions and answers about events occurring in the past week with which the youth had difficulty. The remainder of the CST session was devoted to youth role-playing common situations, while practicing new coping skills. Encouragement and reinforcement were provided by other students and the teacher. Materials were developed by a clinical psychologist who was an expert in CST.
Finally, health coaching was provided only to the experimental subjects, commencing at the end of the 16 week intervention program, and lasting until the 12 month data collection. Coaching was provided via telephone by an advanced practice nurse, nutritionist, family therapist, or psychologist, on a rotating basis. During weekly coaching contacts, lasting about 5–10 minutes, the coach reviewed and discussed weekly nutrition and exercise goals and reinforced healthy behavior changes. In addition, s/he assisted the participants in using CST to overcome barriers to improving dietary and exercise behaviors.
Intervention Fidelity
As described above, teachers were thoroughly trained to implement the protocols. Training included the development of a manual detailing all aspects of the curriculum, a full day on in person training with the nutritionist and an experienced coping skills trainer, and the availability of regular consultation and observation. To assure consistency, we developed a checklist of class content to assure that protocols were consistently followed. Teachers used this checklist to rate how well they covered the material, and research staff used the checklist when during classroom observations (approximately 30% of classes). Observations were conducted on 1 of 3 scheduled classes by trained study staff. If there was drift, teachers were reminded, and, as necessary, retrained (< 10% of classes).
Instruments
Data were collected at baseline, at completion of the intervention phase (4 months), and 12 months post-intervention using the instruments described below.
Demographics
Parents/guardians completed a demographic form, including questions about age, race/ethnicity, marital status, education level, income level, and health of the parent/guardian and child. The demographics form was translated into Spanish for Spanish-speaking parents.
Anthropometric measures
Weight in kilograms and body fat percentage were measured with a scale and body composition analyzer (Model BF-350; Tanita Corporation of America, Inc, Arlington Heights, IL). Height was measured using a wall-mounted stadiometer, calibrated in 1/8 cm intervals. Weight and height were measured in light indoor clothing with bare feet and were used to calculate BMI (kg/m2). To measure waist circumference, a cloth tape measure was placed around the abdomen horizontally at the midpoint between the highest point of the iliac crest and the lowest part of the costal margin in the mid-axillary line. Measurements were performed 3 times and averaged for analyses.
Metabolic measures
Plasma insulin was determined by radioimmunoassay (HI-14; Linco, St. Charles, MO). Normal fasting insulin is < 15 µU/mL, (107.6 pmol/mL). Insulin resistance (IR) was estimated by Homeostasis Model Assessment of Insulin Resistance using the following equation: HOMA-IR = fasting insulin (µU/mL) X fasting glucose (mmol/L)/22.5 (Matthews et al., 1985). Greater HOMA-IR values indicate reduced insulin sensitivity, and a value over 2.2 is indicative of IR. In the current study, HOMA-IR values were log-transformed to normalize the distribution.
Abbreviated Oral Glucose Tolerance Tests (OGTT) were conducted with venous samples for glucose and insulin drawn at 0 and 120 minutes following oral ingestion of a flavored glucose load (Orangedex, Custom Laboratories, Baltimore) in a dose of 1.75 grams per kilogram of body weight up to a maximum of 75 grams. Impaired glucose tolerance is defined as a plasma glucose level < 126 mg/dl and a 2-hour plasma glucose level of 140–200 mg/dl. T2DM is defined as a fasting glucose level ≥ 126 mg/dl or a 2-hour plasma glucose level > 200 mg/dl (American Diabetes Association, 2002) .
Lipids
Fasting total cholesterol, high density and low density lipoproteins, and triglycerides were determined using the CLIA-exempt Cholestex L-D-X system® (Cholestech, Hayward, CA). The system uses capillary whole blood specimens obtained by fingerstick, combining enzymatic methodology and solid-phase technology to measure complete lipid profiles. Precision has been found to range from 2–6 % (excellent) and to be highly correlated with venous plasma specimens (r > 0.95).
Child depressive symptoms
The Children's Depression Inventory (CDI) is a self-report measure of depressive symptoms in children and adolescents, consisting of 27 items (Kovacs, 1985). Total scores range from 0 to 54, with higher scores reflecting greater symptomatology. The CDI has been used extensively; concurrent and discriminant validity has been established in children with known mental health problems and in studies of children with type 1 diabetes (Kovacs et al., 1990). Internal consistency for the current sample was α = .84. A score of 13 has been recommended as a criterion score for detecting depressive disorders (Timbremont et al., 2004). In the current study, a score above the clinical cutoff and/or an indication of current suicidal thoughts (i.e., “I want to kill myself.”) required an immediate assessment by a licensed clinician (clinical psychologist or nurse practitioner). CDI values were square root-transformed to normalize the distribution in analyses.
Health behaviors/attitudes
The Health Behavior Questionnaire was used to measure health behaviors and attitudes (Parcel et al., 1995). The Usual Food Choices (14 items, measures students usual food selections), Dietary Self-Efficacy (15 items, e.g., “How sure are you that you can eat a baked potato instead of French fries?”), and Physical Activity Self-Efficacy (5 items, e.g., “How sure are you that you can choose to jog during recess?”) scales were used in the present study. Acceptable reliability and validity of the instrument was determined during testing in a diverse sample of 5,000 children (Nader et al., 1999). Internal consistency values for the current study are as follows: Usual Food Choices α = .68; Dietary Self-efficacy α = .85; and Physical Activity Self-efficacy α = .64.
The Revised Godin-Shephard Activity Survey (Sallis et al., 1993) is a self-administered instrument in which subjects report the number of times in an average week that they spent more than 15 minutes in activities classified as mild (3 METs), moderate (5 METs), or strenuous (9 METs). The MET is the standard unit of work measure used in exercise physiology that involves the ratio of oxygen consumption, body weight, and unit of time. Testing with adolescent and school-aged children revealed concurrent validity with the 7- and 14-day Physical Activity Record and test-retest coefficients ranging from 0.81 to 0.84. The revised version includes examples of activities relevant to urban middle school populations.
Statistical analyses
Baseline characteristics were compared using t-tests for continuous and chi-square tests for categorical variables. Data were analyzed under the intent-to-treat principle whereby all randomized subjects were analyzed in the group to which they were randomized (Fisher et al., 1990). The intent-to-treat analysis was performed on all 198 randomized subjects. This included 44 children who were randomized and participated in the evaluation, but did not attend the intervention classes. For the primary analysis, a mixed model repeated measures analysis (adjusted for baseline scores, child race, child gender and parental marital status) was used to evaluate changes in outcomes over time and to compare these changes between CST and general education (GE) groups. This model provides unbiased estimates of time and treatment differences in outcomes, assuming missing data are missing at random (MAR), i.e. given the observed outcomes and covariates, missing data are not dependent on unobserved values (Rubin, 1976). School was included as a random factor. We used predicted least square means to calculate changes from baseline to 4 and 12 months in each outcome of interest over time (across both groups) and by group. We also conducted an analysis with last observation carried forward (LOCF, Hollis and Campbell, 1999), which did not substantively alter the results (results not shown). All analyses were performed in SAS V9.1 (Cary, NC).
Results
There were 112 students assessed at baseline in the CST group and 86 students in the general education (GE) group. As seen in Table 1, the CST group had more girls, slightly older students, fewer female primary caretakers, and more single-parent households than the GE group. There was also a greater percentage of Black students in the CST group as compared to the GE group. In addition, some differences existed in metabolic outcomes and lipid profile: students in the GE group had significantly higher values in their 2-hour glucose on the OGTT, triglycerides, and total cholesterol than students in the CST group (Table 4).
Table 4.
Outcomes of Interest at Baseline, New Haven, CT, 2004–2007
| Characteristic | Combined | CST (n=112) |
GE (n=86) |
p-value1 |
|---|---|---|---|---|
| Mean (SD) | Mean (SD) | Mean (SD) | ||
| Anthropometric | ||||
| BMI (kg/m2) | 30.4 (6.7) | 30.5 (7.2) | 30.3 (6.0) | 0.82 |
| Body Fat (%) | 39.4 (10.2) | 39.7 (10.2) | 39.0 (10.4) | 0.65 |
| Waist circumference (cm) | 94.3 (14.8) | 93.0 (14.2) | 95.8 (15.5) | 0.19 |
| Metabolic | ||||
| HOMA* | 9.7 (10.5) | 9.25 (8.2) | 10.2 (12.9) | 0.76 |
| Fasting Insulin* | 42.1 (38.2) | 40.3 (29.1) | 44.4 (47.7) | 0.89 |
| 2-hr Insulin* | 133.6 (125.8) | 124.2 (104.7) | 145.8 (148.7) | 0.30 |
| Fasting OGTT | 90.7 (10.9) | 90.2 (11.4) | 91.4 (10.3) | 0.47 |
| 2-hr OGTT | 103.7 (19.7) | 100.9 (15.7) | 107.4 (23.6) | 0.03 |
| HbA1c | 5.2 (0.4) | 5.2 (0.4) | 5.2 (0.4) | 0.82 |
| Lipids | ||||
| Total Cholesterol | 155.5 (32.9) | 150.1 (31.1) | 162.7 (34.0) | 0.01 |
| Triglyceride | 93.1 (55.6) | 85.0 (46.6) | 104.2 (64.4) | 0.02 |
| HDL | 41.1 (12.2) | 40.2 (11.1) | 42.4 (13.4) | 0.20 |
| LDL | 95.4 (30.8) | 92.9 (30.9) | 98.9 (30.5) | 0.19 |
| Child Depressive Symptoms | ||||
| CDI** | 9.8 (7.0) | 10.0 (6.8) | 9.6 (7.2) | 0.72 |
| Health Behavior | ||||
| Usual Food Choices | −1.5 (5.8) | −2.0 (5.7) | −0.9 (5.9) | 0.18 |
| Dietary Self-Efficacy | 6.4 (6.4) | 6.3 (6.5) | 6.5 (6.3) | 0.86 |
| Physical Activity Self-Efficacy | 2.5 (2.3) | 2.4 (2.2) | 2.5 (2.5) | 0.73 |
| Physical Activity | ||||
| METs | 60.0 (25.2) | 60.4 (25.4) | 59.6 (25.0) | 0.83 |
Note. BMI = Boyd Mass Index; OGTT = Oral Glucose Tolerance Test; HDL = high-density lipoprotein; LDL = low-density lipoprotein; CDI = Child Depression Inventory
Log-transformed for analyses
Square-root transformed for analyses
t-test
Twenty-five students (22.3%) were lost to follow-up at 12 months in the CST group, compared to twenty-two (25.6%) in the GE group (p = 0.93). Students who were lost to follow up, compared to those who completed the study, were more likely to be Hispanic (55.6% vs. 42.0%) and less likely to be Black (37.8% vs. 53.3%) (p = 0.038); had higher depressive symptoms (p = 0.027); lower self-efficacy for physical activity (p = 0.012); and higher triglyceride levels (p = 0.012).
Table 5 summarizes our findings of the effect of intervention on each outcome of interest for the intent-to-treat analysis.
Table 5.
Mixed Model Analysis of Metabolic Risk and Health Behavior/ Attitude Outcomes: Changes from Baseline (95% CI), New Haven, CT, 2004–2007
| Variable | Combined | CST | GE | |||
|---|---|---|---|---|---|---|
| 4 Months | 12 Months | 4 Months | 12 Months | 4 Months | 12 Months | |
| Anthropometric | ||||||
| BMI (kg/m2) | 0.0 (−0.4, 0.5) | 0.5 (0.0, 1.0)2 | 0.1 (−0.4, 0.7) | 0.9 (0.3, 1.5)1 | −0.1 (−0.6, 0.5) | 0.1 (−0.5, 0.8)1 |
| Body fat (%) | −2.2 (−3.3, −1.1) 2 | −1.9 (−3.1, −0.62) | −1.7 (−3.0, −0.4) | −1.0 (−2.4, 0.5) | −2.4 (−4.0, −1.2) | −2.7 (−4.3, −1.2) |
| Waist circumference (cm) | −3.5 (−5.2, −1.7) 2 | −3.4 (−5.3, −1.5) 2 | −3.8 (−5.8, −1.8) | −3.3 (−5.5, −1.0) | −3.2 (−5.3, −1.1) | −3.6 (−6.0, −1.2) |
| Metabolic | ||||||
| HOMA | - | −0.1 (−0.3, −0.0) 2 | - | −0.2 (−0.4, 0.1) | - | −0.3 (−0.5, −0.0) |
| Fasting Insulin | - | −0.1 (−0.3,−0.0) 2 | - | −0.1 (−0.4, 0.1) | - | −0.3 (−0.5, −0.1) |
| 2-hr Insulin | - | −0.3 (−0.4, −0.2) 2 | - | −0.4 (−0.6, −0.2) | - | −0.2 (−0.4, 0.0) |
| OGTT | - | 0.1 (−2.6, 2.4) | - | −1.4 (−4.6, 1.9) | - | 2.5 (−0.8, 5.8) |
| 2-hr OGTT | - | 0.9 (−3.8, 5.7) | - | −6.3 (−13.1, −0.5) 1 | - | 7.5 (0.5, 14.6) 1 |
| Lipids | ||||||
| Triglycerides | - | −9.5 (−17.3, −1.7) 2 | - | −12.4 (−26.2, 1.5) | - | −22.0 (−36.2, −7.7) |
| Total Cholesterol | - | 5.5 (−2.1, 13.1) | - | 2.4 (−7.9, 12.7) | - | 1.3 (−9.0, 11.6) |
| HDL | - | −1.2 (−3.8, 1.4) | - | −0.1 (−3.0, 2.8) | - | −3.3 (−6.2, −0.3) |
| LDL | - | 9.1 (3.3, 14.9) 2 | - | 5.2 (−4.3, 14.7) | - | 9.0 (0.1, 18.7) |
| Child Depressive Symptoms | ||||||
| CDI | −0.3 (−0.4, −0.1) | −0.6 (−0.8, −0.4) 2 | −0.2 (−0.6, 0.1) | −0.5 (−0.9, −0.2) | −0.2 (−0.6, 0.1) | −0.6 (−1.0, −0.3) |
| Health Behavior | ||||||
| Usual Food Choice | 0.2 (−1.0, 1.5) | 1.1 (−0.2, 2.4) | 0.4 (−1.1, 1.9) | 1.2 (−0.4, 2.7) | 0.1 (−1.4, 1.7) | 1.0 (−0.7, 2.6) |
| Dietary Self-Efficacy Physical Activity Self- |
−0.0 (−1.4, 1.3) | 0.3 (−1.1, 1.6) | 0.0 (−1.6, 1.6) | 1.0 (−0.7, 2.6) | −0.1 (−1.8, 1.7) | −0.5 (−2.2, 1.3) |
| Efficacy | 0.5 (−0.1, 1.0) | 0.5 (−0.0, 1.0) | 0.4 (−0.2, 1.1) | 0.6 (0.0, 1.3) | 0.5 (−0.2, 1.2) | 0.3 (−0.3, 1.0) |
| Physical Activity | ||||||
| METs | 5.7 (0.3, 11.2) 2 | 4.6 (−1.1, 10.2) | 7.5 (1.2, 13.8) | 2.6 (−4.1, 9.4) | 3.9 (−2.8, 10.7) | 6.5 (−0.7, 13.7) |
Note. BMI = Boyd Mass Index; OGTT = Oral Glucose Tolerance Test; HDL = high-density lipoprotein; LDL = low-density lipoprotein; CDI = Child Depression Inventory.
significantly different between two groups for that particular month (p < 0.05).
significantly different from baseline (p < 0.05)
Anthropometric characteristics
BMI increased across both groups from baseline to 12 months (p < 0.001). While the difference between the CST and GE groups was not significant at 4 months, BMI was significantly greater in the CST group at 12 months. Percent body fat and waist circumference significantly decreased across both groups from baseline to 4 months, and the effect was sustained at 12 months; however, no differential effect for type of intervention was found.
Metabolic characteristics
Reductions in 2-hour glucose were significantly greater in the CST group, compared to the GE group over 12 months. We also observed improvements in HOMA, fasting insulin and 2-hour insulin levels across both groups over 12 months.
Lipids
The treatment effect for HDL approached significance (p = 0.07), with the CST group showing a greater increase in HDL at 12 months than the GE group. In addition, while levels of triglycerides decreased over time across both groups, LDL and cholesterol increased over time across both groups.
Child Depressive Symptoms
There was no significant effect of intervention type on the change in CDI scores. However, there was a significant decrease in the CDI scores from baseline to 4 months (p = 0.010) and an additional decrease from 4 months to 12 months across both groups (p < 0.001).
Health Behavior
Improvements in usual food choices and self-efficacy for physical activity at 12 months across both intervention groups approached significance (p = .075 and p = 0.052 respectively). There were no significant effects of either time or type of intervention on self-efficacy for diet.
Physical Activity
Self-reported physical activity (METs) significantly increased from baseline to 4 months when both interventions were combined (p= 0.048), but was not statistically different from baseline at 12 months
Additional analyses were conducted to test for intervention effects among adolescents’ who attended at least half of the classes (4 of 8 classes for the GE group, 7 of 13 classes for the CST group, approximately 34% of students in each group). For this subset of students, the difference in BMI gain between the two groups was no longer significant (p = 0.12). Other findings were similar to those for the intent-to-treat analysis.
Discussion
Obesity and its concomitant metabolic disorder, IR, are risk factors for the development of T2DM during adolescence, a disorder that is now epidemic in black and Hispanic youth. Further, obesity is a risk factor for depression, decreased self-efficacy, and poorer health behaviors (Janicke et al., 2007). Given the huge economic toll extracted by obesity and T2DM, and the burden of care necessary to manage these conditions and their complications, interventions that improve the ability of youth to cope with their condition are urgently needed. Therefore, this study was designed to address these gaps in knowledge by furthering our understanding of the potential for a culturally-sensitive, school-based multifaceted program to manage obesity and IR among inner city, minority youth. For the most part, these results suggest that while there was some improvement in both groups on anthropometric measures, lipids, and depressive symptoms, there were few statistically significant differences between the CST and GE groups. The primary outcome, BMI, increased across time for both groups, but in both groups the rate of change was lower than would be expected since both received intervention. The GE group had a significantly smaller increase in BMI over 12 months as compared to the CST group, but additional analyses including only students who received the intervention (attended at last half of the classes) indicated no difference between groups. Further, the increase in BMI in conjunction with a decrease in waist circumference and body fat may suggest that students increased muscle mass. These results suggest that a school-based intervention has promise for stabilizing BMI in this high risk sample, but that future work is needed to find ways to engage students and increase attendance.
Importantly for the reduction of risk for T2DM in this high-risk population, plasma glucose levels at 120 minutes during the oral glucose tolerance test were significantly reduced in the CST group compared to the GE group. Similarly, HDL levels, seen as protective of metabolic risk, were increased to somewhat higher levels in the CST group as compared with the GE group (p = .069). Improvements in both of these markers are associated with reduced risk for the development of T2DM.
Since both groups received the educational intervention, it is not surprising that significant differences were not found between the CST and GE groups in knowledge and health behaviors. Students in both groups showed some improvement over time on usual food choices and self-efficacy for physical activity. Further, self-reported physical activity increased immediately after the intervention (4 months), but this gain was not maintained at 12 months.
Study Limitations and Strengths
There are several limitations that should be taken into account in the interpretation of these data. First, the study was not powered to assess health behaviors and attitudes, so these findings may be preliminary. In addition, the additional classes and health coaching received by students in the CST condition as compared to the GE condition may account for any group differences. Further, due to the sample size, we were unable to address mediator effects. Two of the health behavior scales, usual food choices and self-efficacy for physical activity, had low internal consistency, which may limit the results related to these scales. Finally, although we used an intent-to treat approach with imputation of previous values for analysis and the dropout rate was moderate at 27% for this high-risk population, these results represent the most conservative statistical approach.
A significant limitation was problems with attendance. As noted, only 34% of students in each group received at least half of the intervention. Likewise, most students in the CST condition did not receive a full dose of health coaching. Although the original plan proposed weekly calls, the average rate of contact was less frequent (an average of one coaching every 2.2 weeks). It often took several attempts to reach the student (only 27% of calls resulted in coaching). There are several possible reasons for this low attendance. The schools involved were inner city schools with low reading and math test scores and high absentee rates. Students were routinely pulled from regular classes to attend remedial reading and math classes to improve mastery test scores. These low rates of attendance make it difficult to interpret results, as few students received the full intervention.
One of the strengths of this study was working with teachers in the schools, which has the advantage of more rapid adoption in the community, and the opportunity to ‘reach children where they are.’(Berry et al., 2006) On the other hand, school-based interventions may not do enough to involve parents and influence the home food environment (Gittelson and Kumar, 2007). For example, there is evidence that adolescents obtain more than 90% of their calories outside of school (Nielsen et al., 2002). Future studies are needed to determine whether family and/or community-based interventions are more effective than school-based interventions. More efficient approaches to delivering such complex information and skills need to be developed and tested as well.
Conclusions
This randomized clinical trial of a multifaceted school-based intervention suggests that teachers can deliver such an intervention successfully having received training from expert staff. In addition, urban minority youth, traditionally a difficult population to engage, participated in the program and, for the most part, completed the study. Importantly, our CST intervention was found to improve some key markers of metabolic risk of T2DM, but it is yet to be seen if these effects result in long-term reduction in the incidence of T2DM in youth. Clinicians and teachers can incorporate the approaches used in this study to reduce the risk of T2DM in youth at risk.
Acknowledgements
This project was supported by a grant from the NIH (1R01NR008244) to Margaret Grey and the Yale Center for Clinical Investigation, CTSA Grant Number UL RR023139 from the National Center for Research Resources (NCRR), a component of the National Institutes of Health (NIH), and NIH roadmap for clinical research. Its contents are the sole responsibility of the authors and do not represent the official view of NCRR or NIH. We acknowledge the teachers and advanced practice nurses at the schools who provided the intervention and facilitated recruitment and follow-up of students.
Footnotes
Publisher's Disclaimer: This is a PDF file of an unedited manuscript that has been accepted for publication. As a service to our customers we are providing this early version of the manuscript. The manuscript will undergo copyediting, typesetting, and review of the resulting proof before it is published in its final citable form. Please note that during the production process errors may be discovered which could affect the content, and all legal disclaimers that apply to the journal pertain.
Conflict of Interest Statement:
The authors declare that there are no conflicts of interest.
Contributor Information
Margaret Grey, Yale University School of Nursing.
Sarah S. Jaser, Yale University School of Nursing.
Marita G. Holl, Yale Center for Clinical Investigation.
Vanessa Jefferson, Yale Center for Clinical Investigation.
James Dziura, Yale Center for Clinical Investigation.
Veronika Northrup, Yale Center for Clinical Investigation.
References
- Alm M, Soroudi N, Wylie-Rosett J, Isasi CR, Suchday S, Rieder J, Khan U. A qualitative assessment of barriers and facilitators to achieving behavior goals among obese inner-city adolescents in a weight management program. Diabetes Educ. 2008;34:277–283. doi: 10.1177/0145721708314182. [DOI] [PubMed] [Google Scholar]
- American Diabetes Association. Clinical practice recommendations. Diabetes Care. 2002;25 Supplement 1 doi: 10.2337/diacare.25.2007.s1. [DOI] [PubMed] [Google Scholar]
- Bandura A. Self-efficacy: The exercise of control. New York: W. H. Freeman; 1986. [Google Scholar]
- Berry D, Urban AD, Grey M. Understanding the development and prevention of type 2 diabetes in youth (Part I) J Pediatr Health Care. 2006;20:3–10. doi: 10.1016/j.pedhc.2005.08.009. [DOI] [PubMed] [Google Scholar]
- Conwell LS, Trost SG, Brown WJ, Batch JA. Indexes of insulin resistance and secretion in obese children and adolescents: A validation study. Diabetes Care. 2004;27:314–319. doi: 10.2337/diacare.27.2.314. [DOI] [PubMed] [Google Scholar]
- Davidson M, Boland EA, Grey M. Teaching teens to cope: coping skills training for adolescents with insulin-dependent diabetes mellitus. J Society Pediatr Nurs. 1997;2:65–72. doi: 10.1111/j.1744-6155.1997.tb00062.x. [DOI] [PubMed] [Google Scholar]
- Davis MM, Gance-Cleveland B, Hassink S, Johnson R, Paradis G, Resnicow K. Recommendations for prevention of childhood obesity. Pediatrics. 2007;120 Suppl 4 doi: 10.1542/peds.2007-2329E. [DOI] [PubMed] [Google Scholar]
- Department of Health and Human Services. National health and nutrition examination survey: Overweight among U.S. children and adolescents. Centers for Disease Control and Prevention. 2002 [Google Scholar]
- Fisher L, Dixon D, Herson J, Frankowski RK, Hearron MS, Peace KE. Intention to treat in clinical trials. In: Peace KE, editor. Statistical issues in drug research and development. New York: Marcel Dekker; 1990. [Google Scholar]
- Gittelson J, Kuman MB. Preventing childhood obesity and diabetes: is it time to move out of the school? Pediatr Diabetes. 2007;8:55–69. doi: 10.1111/j.1399-5448.2007.00333.x. [DOI] [PubMed] [Google Scholar]
- Goodman E, Whitaker RC. A prospective study of the role of depression in the development and persistence of adolescent obesity. Pediatrics. 2002;110:497–504. doi: 10.1542/peds.110.3.497. [DOI] [PubMed] [Google Scholar]
- Grey M, Berry D, Davidson M, Galasso P, Gustafson E, Melkus G. Preliminary testing of a program to prevent type 2 diabetes among high-risk youth. J School Health. 2004;74:10–15. doi: 10.1111/j.1746-1561.2004.tb06595.x. [DOI] [PubMed] [Google Scholar]
- Grey M, Boland EA, Davidson M, Li J, Tamborlane WV. Coping skills training for youth with diabetes mellitus has long-lasting effects on metabolic control and quality of life. J Pediatr. 2000;137:107–113. doi: 10.1067/mpd.2000.106568. [DOI] [PubMed] [Google Scholar]
- Grey M, Schreiner BJ, Pyle L Today Study Group. Development of a diabetes education program for youth with type 2 diabetes. Diabetes Educator. 2009;35:108–116. doi: 10.1177/0145721708325156. [DOI] [PMC free article] [PubMed] [Google Scholar]
- Harrell JS, Gansk SA, McMurray RG, Bangdiwala SI, Frauman AC, Bradley CB. School-based interventions improve heart health in children with multiple cardiovascular disease risk factors. Pediatrics. 1998;102:371–380. doi: 10.1542/peds.102.2.371. [DOI] [PubMed] [Google Scholar]
- Hollis S, Campbell F. What is meant by intention to treat analysis? Survey of published randomized controlled trials. BMJ. 1999:670–674. doi: 10.1136/bmj.319.7211.670. [DOI] [PMC free article] [PubMed] [Google Scholar]
- Janicke DM, Marciel KK, Ingerski LM, Novoa W, Lowry KW, Sallinen BJ, Silverstein JH. Impact of psychosocial factors on quality of life in overweight youth. Obesity. 2007;15:1799–1807. doi: 10.1038/oby.2007.214. [DOI] [PubMed] [Google Scholar]
- Kovacs M. The Children's Depression Inventory (CDI) Psychopharm Bull. 1985;21:995–998. [PubMed] [Google Scholar]
- Kovacs M, Iyengar S, Godston D, Steweart J, Obrosky DS, Marsh J. Psychological functioning of children with insulin-dependent diabetes mellitus: a longitudinal study. J Pediatr Psychol. 1990;15:619–632. doi: 10.1093/jpepsy/15.5.619. [DOI] [PubMed] [Google Scholar]
- Liese AD. The burden of diabetes mellitus among US youth: Prevalence estimates from the SEARCH for Diabetes in Youth Study: SEARCH for Diabetes in Youth Study Group. Pediatrics. 2006;118:1510–1518. doi: 10.1542/peds.2006-0690. [DOI] [PubMed] [Google Scholar]
- Luepker RV, Perry CL, McKinlay SM, Nader PR, Parcel GS, Stone EJ, Webber LS, Elder JP, Feldman HA, Johnson CC, et al. CATCH collaborative group. Outcomes of a field trial to improve children's dietary patterns and physical activity. The Child and Adolescent Trial for Cardiovascular Health. JAMA. 1996;275:768–776. doi: 10.1001/jama.1996.03530340032026. [DOI] [PubMed] [Google Scholar]
- Luttikhuis HO, Baur L, Jansen H, Shrewsbury VA, O’Malley C, Stolk RP, Summerbell CD. Interventions for treating obesity in children. Cochrane Database of Systematic Reviews. 2009 doi: 10.1002/14651858.CD001872.pub2. [DOI] [PubMed] [Google Scholar]
- Matthews DR, Hosker JP, Rudenski AS, Naylor BA, Treacher DF, Turner RC. Homeostasis model assessment: Insulin resistance and beta cell function from fasting plasma glucose and insulin concentrations in man. Diabetologia. 1985;28:412–419. doi: 10.1007/BF00280883. [DOI] [PubMed] [Google Scholar]
- Nader PR, Stone EJ, Lytle LA. Three-year maintenance of improved diet and physical activity: The CATCH cohort. Arch Pediatr Adol Med. 1999:153. doi: 10.1001/archpedi.153.7.695. [DOI] [PubMed] [Google Scholar]
- Nielsen SJ, Siega-Riz AM, Popkin BM. Trends in food locations and sources among adolescents and young adults. Prev Med. 2002;35:107–113. doi: 10.1006/pmed.2002.1037. [DOI] [PubMed] [Google Scholar]
- Ogden CL, Carroll MD, Flegal KM. High Body Mass Index for Age Among US Children and Adolescents, 2003–2006. JAMA. 2008;299:2401–2405. doi: 10.1001/jama.299.20.2401. [DOI] [PubMed] [Google Scholar]
- Parcel GS, Emundson E, Perry CL, Feldman HA, O’Hara-Tompkins N, Nader PR. Measurement of self-efficacy for diet-related behaviors among elementary school children. J School Health. 1995;65:23–27. doi: 10.1111/j.1746-1561.1995.tb03335.x. [DOI] [PubMed] [Google Scholar]
- Rubin DB. Inference and missing data. Biometrika. 1976;63:581–592. [Google Scholar]
- Saelens BE, Sallis JF, Wilfley DE, Patrick K, Cella JA, Buchta R. Behavioral weight control for overweight adolescents initiated in primary care. Obes Res. 2002;10:22–31. doi: 10.1038/oby.2002.4. [DOI] [PubMed] [Google Scholar]
- Sallis JF, Buono MJ, Roby JJ, Micale FG, Nelson JA. Seven-day recall and other physical activity self-reports in children and adolescents. Med Sci Sport Exer. 1993;25:99–108. doi: 10.1249/00005768-199301000-00014. [DOI] [PubMed] [Google Scholar]
- Singh AS, Mulder C, Twisk JWR, Van Mechelen W, Chinapaw JMJ. Tracking of childhood overweight into adulthood: A systematic review of the literature. Obes Rev. 2008;9:474–488. doi: 10.1111/j.1467-789X.2008.00475.x. [DOI] [PubMed] [Google Scholar]
- Spear BA, Barlow SE, Ervin C, Ludwig DS, Saelens BE, Schetzina KE, Taveras EM. Recommendations for treatment of child and adolescent overweight and obesity. Pediatrics. 2007;120 Suppl 4 doi: 10.1542/peds.2007-2329F. [DOI] [PubMed] [Google Scholar]
- Stice E, Shaw H, Marti CN. A meta-analytic review of the obesity prevention programs for children and adolescents: The skinny on interventions that work. Psychol Bull. 2006;132:667–691. doi: 10.1037/0033-2909.132.5.667. [DOI] [PMC free article] [PubMed] [Google Scholar]
- The HEALTHY Study Group. Risk factors for type 2 diabetes in a sixth-grade multiracial cohort. Diabetes Care. 2009;32:953–955. doi: 10.2337/dc08-1774. [DOI] [PMC free article] [PubMed] [Google Scholar]
- Timbremont B, Braet C, Dreessen L. Assessing Depression in Youth: Relation Between the Children's Depression Inventory and a Structured Interview. J Clin Child Adol Psychol. 2004;33:149–157. doi: 10.1207/S15374424JCCP3301_14. [DOI] [PubMed] [Google Scholar]
- Uwaifo GI, Fallon EM, Chin J, Elberg J, Parikh SJ, Yanovski JA. Indices of insulin action, disposal, and secretion derived from fasting samples and clamps in normal glucose-tolerant black and white children. Diabetes Care. 2002;25:2081–2087. doi: 10.2337/diacare.25.11.2081. [DOI] [PubMed] [Google Scholar]