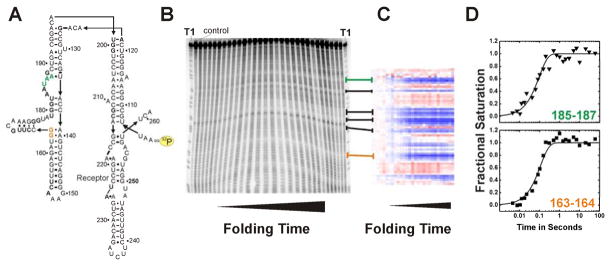
Figure 3.
Example of an •OH radical footprinting experiment complementing time resolved SAXS studies [27]. RNA folding was initiated by addition of 10 mM Mg2+. Green and orange emphasize the exemplary protection sites 163–164 and 185–187, respectively. (A) Secondary structure of the wild-type P4–P6 domain of the Tetrahymena thermophila ribozyme. The yellow label indicates the 32P marked 5′ terminus of the RNA. (B) Autoradiogram of a 15% denaturing polyacrylamide gel. “T1” indicates a guanosine ladder generated by RNase T1 digest of P4–P6 RNA. The control lane shows a radio-labeled RNA that has not been exposed to •OH. From the left to the right footprinted P4–P6 RNA samples with increasing folding times were loaded. (C) Solvent accessibility of P4–P6 nucleotides after SAFA [20] analysis as false color map. Blue and red refer to decrease and increase in solvent exposure, respectively. Lines connecting panel B with C indicate the corresponding areas of the gel and the thermo-blot. (D) Time progression of the solvent accessibility of the RNA backbone. Nucleotides 163–164 and 185–187 participate in local structure formation with rate constants of 9 ± 0.8 s−1 and 10 ± 0.6 s−1, respectively.

