Abstract
There remain conflicting models of the cerebellar control of limb movement, ranging from the suggestion that the inhibitory output from Purkinje cells (PCs) is meant to suppress unwanted muscle activity, to the hypothesis that the cerebellar cortex embodies complex internal models of limb dynamics. To test these ideas, we undertook a quantitative comparison of PC simple spike dynamics to those of muscle activity. We recorded simultaneously from Purkinje cells in the paravermal anterior lobe and from muscles of the hand and arm in the behaving monkey during a simple, sequential button pressing task. The task-related discharge of each neuron was determined from peri-event histograms aligned to the onset of the behavior. Bursts of discharge were more than twice as common as pauses, but there was no difference in their timing relative to movement. From the same recordings, the similarity between discharge and muscle activity was evaluated by calculating the cross correlation between firing rate and rectified EMG. Surprisingly, given the inhibitory projection of PCs, most of the bursts of PC discharge were positively correlated with muscle activity. Although our results do not support a simple correspondence of pauses and bursts with limb acceleration and deceleration respectively, they are consistent with a more complex PC regulation of cerebellar nuclear activity from task-related, corticopontine drive.
Keywords: Primate, Cross correlation, Limb movement, Cerebellar nucleus
1. Introduction
The awareness that the motor disorders resulting from cerebellar lesions do not lead to paralysis, but rather to a complex set of motor signs had dawned at least by the middle of the 19th century. Human patients with damage to the anterior lobes of the cerebellum make limb movements that are relatively slow, hypermetric, and unusually curved, with poor coordination among joints. However, a more specific understanding of the role that the cerebellum normally plays in “fine tuning” the details of movement has been quite elusive. Purkinje cells (PC) have an inhibitory influence on the cerebellar nuclei, which in turn provides an excitatory pathway to primary motor cortex (M1). This fact, combined with the observation that most PCs burst during movement (Fortier et al., 1989; Fu et al., 1997; Harvey et al., 1977; Mano and Yamamoto, 1980; Marple-Horvat and Stein, 1987; Thach, 1970) has led to the suggestion that these bursts may simply serve to suppress activity in unwanted muscles (Frysinger et al., 1984; Smith, 1981). A smaller percentage of PCs pause during movement, such that the resulting disinhibition would be consistent with a signal facilitating movement. More complex roles for the cerebellum in the prediction of sensory inputs (Miall et al., 1993), compensation for joint interaction torques(Bastian, 2006), or anticipation of the effect of limb perturbations (Timmann et al., 2000) have also been described.
In this study we investigate the relationship between PC firing and motor command signals by cross-correlating PC firing with myoelectric (EMG) activity recorded from 6-14 forelimb muscles in two monkeys during a reaching and button pressing tasking. Most PCs increased firing during movement and this discharge was correlated positively with EMG activity. However, PC bursts and pauses did not simply correspond to muscle inhibition and facilitation, respectively. Instead, our observations are consistent with a more complex, predictive PC regulation of movement, accomplished by its modulation of a motor-related corticopontine drive to the cerebellar nuclei.
2. Results
In this study, we recorded from 168 presumed Purkinje cells of two monkeys. Penetration sites were located primarily in lobules III, IV, and V of the intermediate cerebellar cortex, and are indicated on a dorsal view of the cerebellum in figure 1. Multi-electrode arrays of from 4 to 7 electrodes were used at each of these penetration sites. In monkey F, 47 cells were recorded from a linear array, with an inter-electrode distance of 0.75 mm. In monkey G, 121 cells were recorded from electrodes tightly packed in a rosette configuration, with a maximum inter-electrode spacing of less than 0.5 mm.
Figure 1.
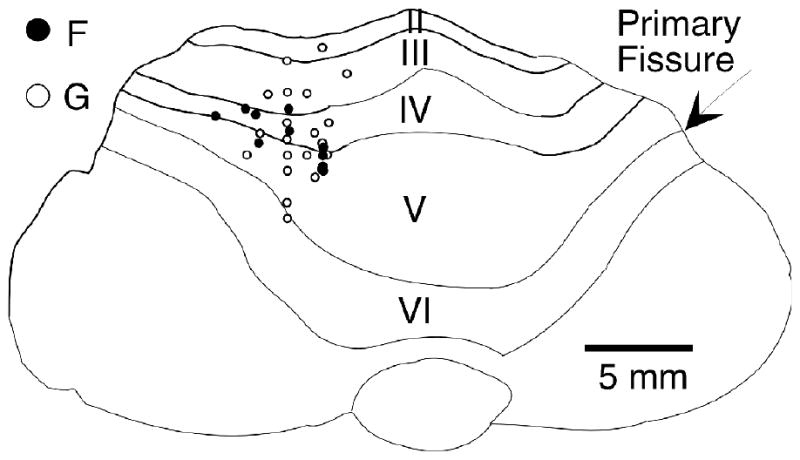
Drawing of top view of cerebellum from monkey F, showing penetrations for monkeys F and G. Most of the penetrations were made in the intermediate hemisphere of lobules III, IV, and V of the anterior lobe. Symbols indicate the penetrations of a multi-electrode array. Several neurons were typically recorded simultaneously from each penetration site.
Myoelectric and neuronal data were recorded while the monkeys performed a sequential reach/button press task. Data files typically consisted of 3 minutes of continuously collected data, including 21 to 25 repetitions of the basic task. Figure 2 is a representative example of a single trial. Purkinje cell simple spike discharge (top trace) was recorded simultaneously with several rectified EMG signals shown immediately below. Because we were interested in the modulation of the signals rather than the individual action potential events, we applied additional digital low-pass filtering to each of the signals (20 Hz, four poles). The remaining “modulation envelope” represents the low-frequency variation in muscle activity or neural discharge rate without the information related to individual action potentials. At the bottom of figure 2 are a number of logical traces indicating the transition through various behavioral states. The touchpad trace is initially elevated, until about 150 ms after the LED for the center button (Center LED) was illuminated. Following this reaction time and an additional 300 ms movement time, the monkey pressed and held the center button for 1 second. A similar series of events preceded the illumination and subsequent press of the outer button (between 53.5 and 55.5 seconds in figure 2), at which point the monkey received a juice reward. An early burst of activity appeared in the pectoralis and biceps muscles, providing liftoff from the touchpad. A later burst in the triceps presumably played a braking or stabilizing role. The wrist and digit muscles had sharply increased activity at the beginning of the button press, which then decreased throughout the subsequent hold period. Several proximal muscles also had tonic activity within the hold period.
Figure 2.
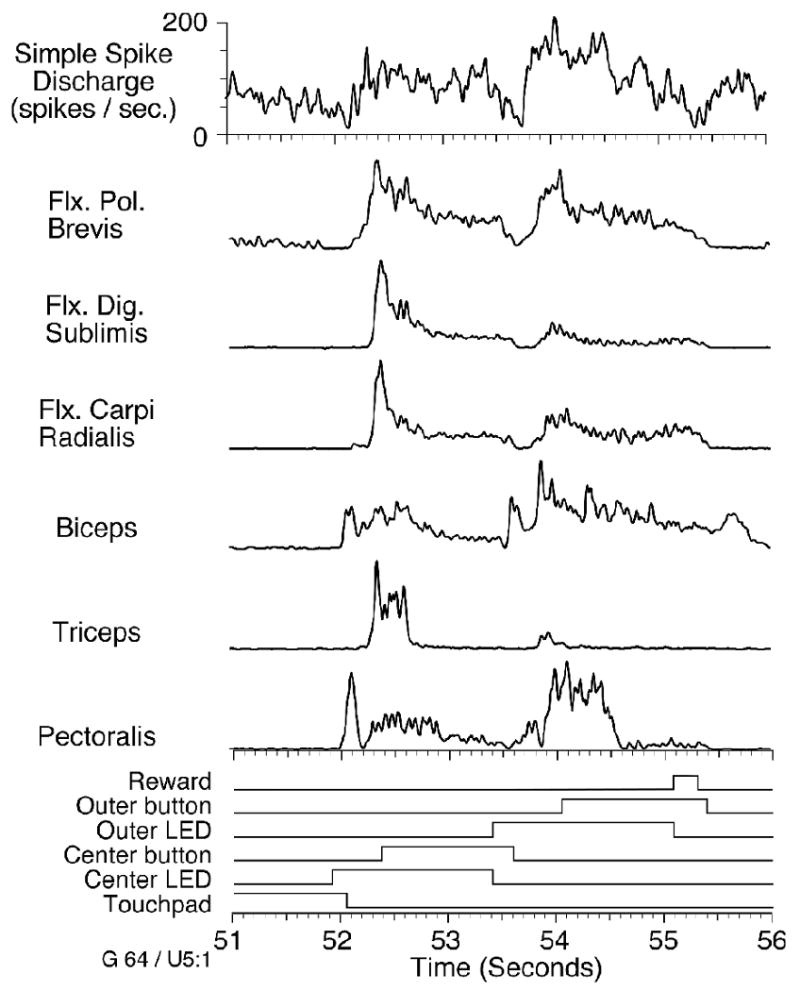
Neuronal discharge rate and muscle activity collected during one trial of the reach/button press task. Behavioral phases are indicated by the lowest set of traces. Center LED indicates the time at which the center button was lighted. Center button and Outer button indicate center and outer button presses, respectively. The decreased activity during reach, and the phasic-tonic bursts associated with the button presses are seen in the simple spike discharge and the EMGs of several muscles, most notably flexor pollicis brevis.
2.1 Purkinje cell discharge
The example in figure 2 was typical of most Purkinje cells from both monkeys, in that there was a large increase in discharge rate during the task. There was also a small decrease in discharge at the onset of the reaches to both center and outer buttons (at 52 and 53.5 s, respectively), but the largest modulation was the phasic / tonic discharge that began just prior to the button presses. For each neuron we calculated peri-event time histograms (PETHs) aligned to both the onset of reach to the center button (as in figures 7 and 8) and the onset of center button press. We defined depth of modulation (DOM) for a given neuron as the largest rate change (either positive or negative) occurring in these histograms, compared to spontaneous activity during the touchpad hold time. Figure 3 summarizes these results for the entire group of cells. We considered the discharge of any given cell to be significant if the change from the spontaneous rate exceeded 4 times the standard deviation of the spontaneous discharge. Most neurons (92% monkey F, 91% monkey G) were significantly modulated during the reach or press phases of the task. Neurons that increased their discharge (F: 81%; G: 75%) were more common than those that decreased their activity (F: 33%; G: 37%). A small percentage of neurons (F: 14%; G: 12%) responded biphasically, with both increased and decreased discharge during a single movement, as in figure 2. There was no difference in the onset latencies for neurons that burst and those that paused for either monkey, although the latencies for the two monkeys were different (t-test, Monkey G: 64 ms vs 48 ms, p = 0.36; Monkey F: 111 ms vs 128 ms, p=0.41).
Figure 7.
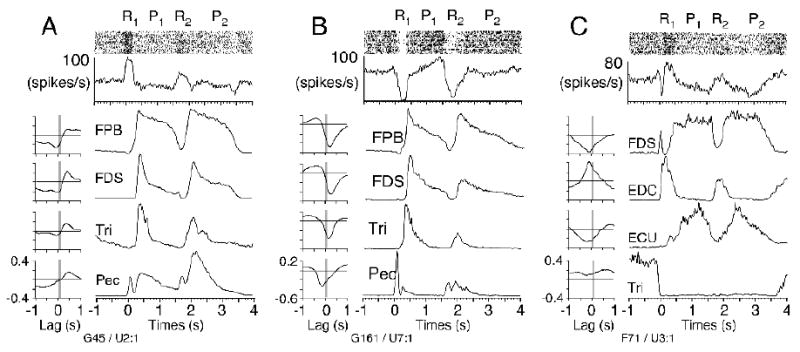
Raster plots, spike histograms, and EMG ensemble averages, all aligned to onset of reach to the center button (R1). In a single trial, the monkey reached toward (R1/R2) and pressed (P1/P2) two buttons sequentially. To the left are the cross correlation functions. The most strongly correlated muscle (plotted at the top of each panel) determined the sign of the correlation in Figure 6. (A) Quadrant IV example (G45 in Figure 6) was approximately out of phase with flexor pollicis brevis, causing a strong, negative correlation. (B,C) Quadrant III examples (G161, F71 in Figure 6), in which pauses in PC discharge were associated with increased muscle activity, also resulting in negative correlations. The biphasic discharge of the neuron in (C) was predominantly negative and its largest magnitude correlation was negative, with flexor digitorum sublimis. This placed it in quadrant III, despite the smaller positive correlations with other muscles.
Figure 8.
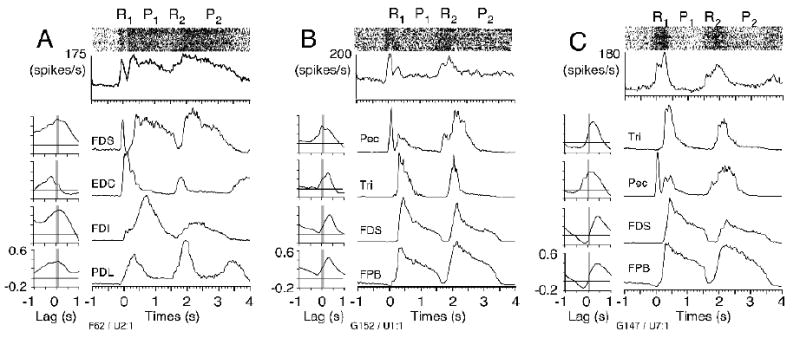
Examples from Quadrant I (F62, G152, and G147 in Figure 6), the most frequent category, in which increased discharge was associated with increased muscle activity, resulting in positive correlations.
Figure 3.
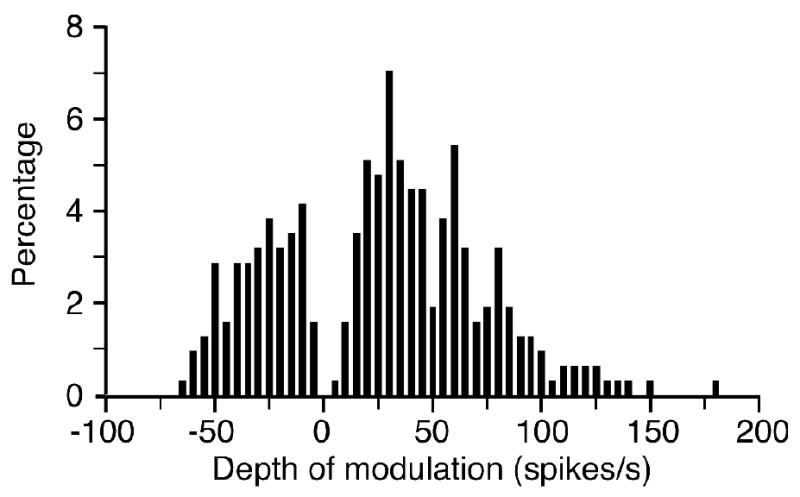
Depth of modulation (DOM), defined as the maximum change in discharge in PETHs aligned to either the onset of reach or center button press. Most Purkinje cells (92%, monkeys G and F) were significantly modulated during the task (DOM > ±4 s.d. of spontaneous firing rate), and of these, increased discharge (77%) was most common.
2.2 Relation between Purkinje cell and EMG activity
In the single trial shown in figure 2, the simple spike discharge of the Purkinje cell closely reflected the activity of the muscle flexor pollicis brevis, including the slight pause in activity prior to the button presses, and the large phasic / tonic burst of activity during the presses. This relation can be quantified by calculating the cross correlation between simple spike discharge rate and each of the muscle signals. The cross correlation is analogous to the more familiar Pearson correlation coefficient, in that it potentially ranges from ±1 for perfect negative and positive correlations. It is also a function of tau, a time shift imposed between the signals, such that the time lag of the peak correlation corresponds to the time shift yielding the maximum overlap between the signals.
Figure 4 shows the cross correlations between the simple spike discharge rate and each of the EMG signals shown in figure 2. These calculations were made using the entire 3 minute data file from which the representative trial shown in figure 2 was taken. The largest correlations were positive, indicating that the modulations of each pair of signals were basically in phase. The wrist and digit flexors (flexor pollicis brevis, flexor digitorum sublimis, flexor carpi radialis) had relatively strong correlations with peaks occurring within the 0 to 50 ms range. The positive lag of the peak indicates that the correlated modulation of the corresponding muscle occurred after that of the neuronal signal. Proximal muscle correlations (e.g., biceps and pectoralis) were weaker, and occurred (with the exception of triceps) at significant negative lags. This indicates that their correlated modulation preceded that of the neuron. We relied not on the strength of the peak correlation, but rather on the strength of correlation within a narrow window of 0 - 100 ms, indicated by the gray vertical bars in figure 4. Based on many other studies, this is the time period in which a burst of neuronal discharge would be expected to influence muscle activity. Very similar methods were used to study groups of muscles thought to be controlled by individual neurons in M1 (Holdefer and Miller, 2002; Morrow et al., 2007). Using this measure, simple spike discharge in this example was most closely related to the activity of flexor pollicis brevis, which clearly reinforces the impression given by the raw data in figure 2.
Figure 4.
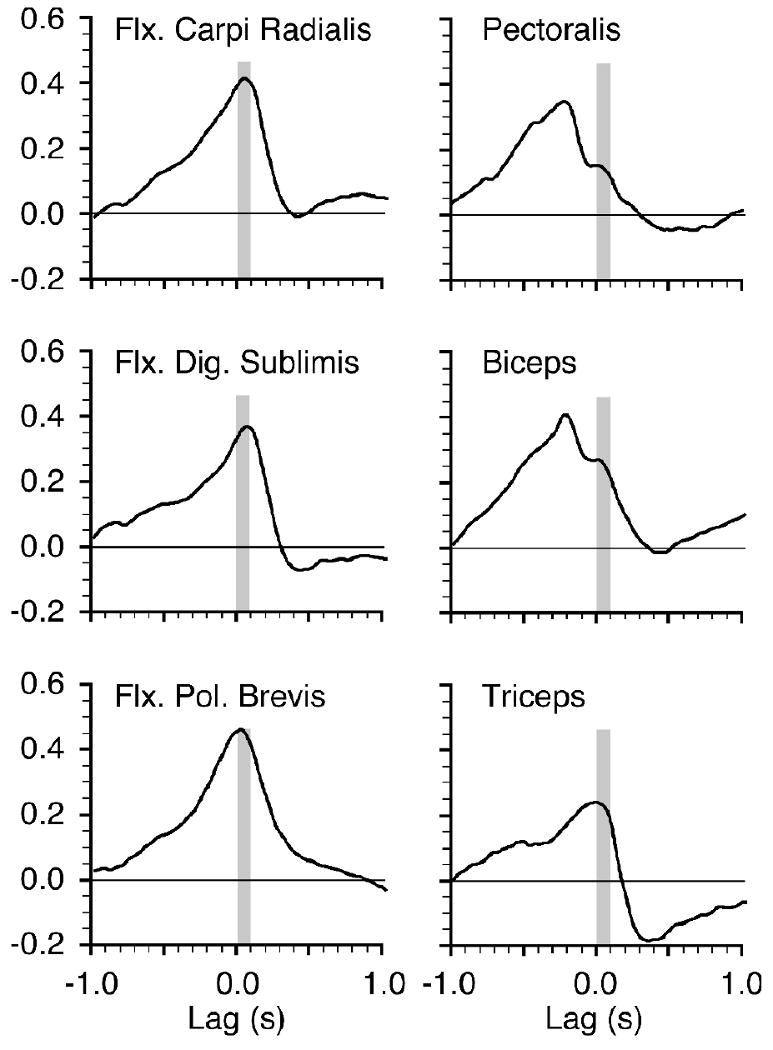
Cross correlation functions calculated between Purkinje cell discharge and EMG from each of six muscles for the entire 3 minute data file from which the signals in Figure 2 were taken. The maximum correlation magnitude within a 0-100 ms window (gray bar) for each muscle shows the similarity between that muscle's activity and the Purkinje cell's discharge within this functionally important range of lag times.
The results of this analysis for all of the PCs are shown in figure 5. Seventy-seven percent of the correlations were positive. Given the inhibitory influence of PCs on the cerebellar nucleus, this result seems to be counterintuitive.
Figure 5.
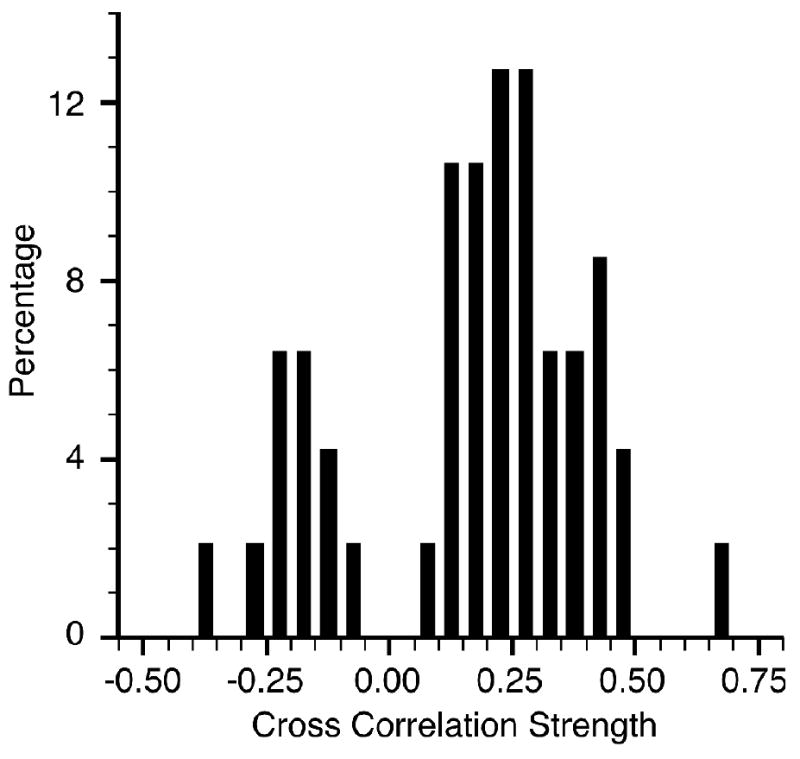
Although Purkinje cells are inhibitory, most (77%) of their correlations with muscle activity were positive (monkeys G and F). Percentages of cross correlation magnitudes for Purkinje cell discharge and EMG are shown, using the largest correlation within a 0-100 ms range of lag times.
2.3 Relation between correlation strength and depth of modulation
While pauses in PC simple spike discharge would seem to have an obvious role in facilitating movement, the bursts of discharge that more typically accompany movement are more puzzling. Bursting PCs may contribute to the regulation of complex movement by preventing unwanted muscles from being activated (Frysinger et al., 1984; Smith, 1981). If this were true, we would anticipate finding numerous cases in which bursting PCs were negatively correlated with muscle activity. We examined this hypothesis by plotting the strength of each neuron's cross correlation in the 0 - 100 ms window against its task-related DOM. Because each cell yielded a cross correlation with all muscles, we used the single muscle with the greatest magnitude correlation to characterize a given cell. Likewise, we used the largest magnitude modulation in the case of biphasic discharge.
These results are summarized in figure 6. The first quadrant (I) contains cells like that shown in figures 2 and 4 (labeled “G64” on figure 6), namely those for which increased discharge was followed at short latency by increased EMG activity, thereby resulting in positive correlations. The majority (62%) of cases for both monkeys fell within this quadrant. The next most common quadrant (III) had both negative correlations and DOM (20%). Here, decreased PC discharge was associated with increased muscle activity. There were very few cases in which pauses in PC discharge corresponded with decreased EMG activity, resulting in positive correlations. (Quadrant II). The two monkeys differed somewhat with respect to quadrant IV (negative correlations and positive DOM). This is the quadrant in which muscles inhibited by bursting PCs would be found. Sixteen percent of the cases from monkey G fell within this quadrant, but only 6% from monkey F. Despite this difference, it is worth noting that for both monkeys, the magnitude of those correlations was relatively small.
Figure 6.
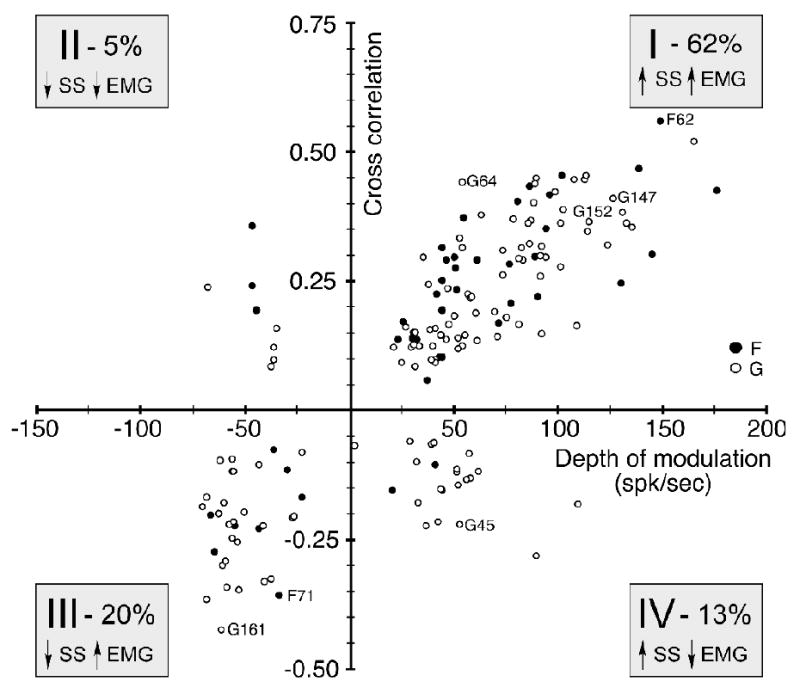
The depth of modulation (DOM) of each Purkinje cell is plotted against the peak correlation for the best correlated muscle. Most cells (62%) were similar to the example shown in Figures 2 and 4 (neuron G64), in that positive DOMs were associated with positive correlation magnitudes (Quadrant I). Purkinje cell discharge which paused during movement and was negatively correlated with muscles was also observed (20%, Quadrant III).
One of the strongest quadrant IV correlations (labeled G45 on figure 6) is shown in more detail in figure 7A. Unlike the single trials of figure 2, this figure displays averages across trials, aligned to the onset of reach. Raster plots are included for each of the unit discharge signals in order to provide an indication of the stereotypy of the neuron's discharge. Patterns of muscle activity (not shown) were at least as stereotypic as the neuronal activity. In this example, the most strongly correlated muscle was flexor pollicis brevis, as in figure 4. However, unlike the figure 4 example, this correlation was negative, reflecting the very different time course of this unit's discharge from that of the first example. The source of the negative correlation can be appreciated from the modulation that occurred during the second reach and button press (between 1.5 and 2.5 s). The burst of unit activity coincided closely with the large decrease in flexor pollicis brevis activity (and to a lesser extent, flexor carpi radialis, not shown) at the end of the first button press. A similar effect may have been present just prior to the first press, but since the muscle activity was already low, it is less obvious.
The remaining panels in figure 7 illustrate several quadrant III examples, characterized by pauses in PC activity associated with increased muscle activity (and consequently, negative cross correlations). In each case, the single muscle that defined the sign of the correlation is plotted first. In some cases (e.g. panel B, the most strongly correlated case in quadrant III) there was a close correspondence between the time courses of the two signals, including both phasic and tonic components. It is worth noting that the example in panel C could have been defined as either quadrant III or II, since flexor digitorum sublimis and EDC were out of phase with one another, and had cross correlations of different sign but very similar magnitude. This is also one example of a cell that had both strong positive and negative DOMs. The increased unit discharge beginning at 0.1 and 1.6 s was accompanied by decreased activity in flexor digitorum sublimis and ECU, which would have contributed to the negative cross correlations.
Figure 8 illustrates a number of examples from quadrant I neurons. The first two (panels A and B) had a prominent early peak which correlated well with flexor digitorum sublimis and pectoralis respectively. The neuron in figure 8C correlated best with triceps, which came on at about the time of the digit flexors, perhaps to brake the limb movement, but did not include the sustained discharge characteristic of button press related activity.
3. Discussion
We recorded the discharge of 168 Purkinje cells from two monkeys during the execution of a button pressing task. Our results are consistent with other studies across a rather wide range of behaviors that have found the majority of cells to burst during movement (Fortier et al., 1989; Fu et al., 1997; Harvey et al., 1977; Mano and Yamamoto, 1980; Marple-Horvat and Stein, 1987; Thach, 1970). In each of these studies, a significant minority of cells paused during movement. The depth of modulation was often shown to be related to the direction and speed of movement, and in some cases, the sign of the modulation was determined by the direction of movement. One study found a small majority (62%) of PCs which paused during a precision grip task. Many of these cells were reciprocally active during wrist flexion and extension (Frysinger et al., 1984). The same group reported that within a small sample of eight PCs, there were only negative correlations between mean discharge and the activity of two groups of muscles (flexors and extensors of the wrist and digits) (Wetts et al., 1985).
3.1 Cerebellum as suppressor of unwanted activity
The disinhibition resulting from cells that pause would appear to have an obvious role in promoting increased motor cortical activity and the onset or augmentation of muscle activity. By contrast, it has been suggested that the many PCs which burst during movement may function to prevent activity in muscles that should not be activated along with the prime movers of the task (Frysinger et al., 1984; Smith, 1981). However, if the role of the bursting PCs were primarily to inactivate unwanted muscles, one would anticipate that their discharge would be negatively correlated with the inactivated muscles. We found relatively few neurons with this type of profile. Of those Purkinje cells that burst during movement, fewer than 20% were negatively correlated with muscle activity (Quadrant IV of figure 6).
However, the relatively small number of quadrant IV cases might also have resulted from an intrinsic limitation of the use of extracellular signals. If a muscle is quiescent prior to movement, additional inhibition imposed by bursting PCs may not be detectable. Indeed, the main effect might be to suppress even further, the already low spontaneous rates of the associated areas of M1 without significantly affecting the drive to motor neurons. Despite this possible limitation, the sequential movements used in this study included the initiation of a second movement from a non-quiescent state, thereby making a potential inhibitory input more obvious (as in figure 7A).
3.2 Cerebellum as accelerator or brake
It would be reasonable to suggest that pausing PCs might help to initiate movement, while bursting PCs might play a role in its termination. These neurons would be found in our quadrants III and IV, respectively. The strength of the acceleration might be enhanced if, as has been suggested, CN neurons undergo a nonlinear burst of rebound excitation evoked by pauses in simple spike discharge (De Schutter and Steuber, 2009). If this were true, one would expect to find latency differences between these groups. Furthermore, this latency difference might be as large as 200-300 ms, the duration of a typical limb movement. In fact, there were no significant differences in timing between the bursting and pausing PCs for either monkey. To the best of our knowledge, this comparison of burst and pause timing has not been made before. Timing comparisons have been made between movement related simple spike discharge and the discharge of cerebellar nuclear neurons in both interpositus and dentate (Thach, 1970; Thach, 1978). The essential conclusion of these studies was that any differences between areas were small compared to the overall broad distribution of discharge times. These studies included neurons with a fairly heterogeneous group of response properties. Perhaps by carefully matching the functional characteristics of pairs of cells or their output connections, more sensitive statistical comparisons could be made. However, none of these studies addressed the timing of PC bursts and pauses. Ultimately, the lack of a timing difference in our data, combined with the wide variety of PC discharge dynamics suggest a more complex relation to movement than a simple correspondence with limb acceleration or deceleration.
3.3 Cerebellum as predictive regulator of on-going movement commands
It has been suggested that the mossy fiber inputs arising from corticopontine projections may be half of a recurrent network which acts as a positive feedback loop (Houk et al., 1993). Recurrent loop activity is thought to provide both a driving force and a means of combining signals produced in related but distant parts of the motor system. Pausing PCs would encourage the development of this activity, while the influence of bursting Purkinje cells might be necessary to restrain the discharge. The effectiveness of these mossy fiber inputs was tested recently by blocking PC inputs to the CN with local injections of GABAa antagonists (Holdefer et al., 2005). The combination of these push-pull effects would allow the activity to develop into an appropriate motor command signal. In the absence of these inputs from PCs, CN movement related bursts became larger, indicating that these mossy fiber projections are an important source of excitatory drive to the nucleus and that the net effect of movement-related PC modulation is suppressive.
There is considerable evidence that the cerebellum may be critical in prediction. Several modeling studies have suggested roles in the prediction of the evolution of sensory inputs, or the sensory consequences of movement (Barto et al., 1999; Kettner et al., 1997; Miall and Wolpert, 1996; Paulin, 1993). Clinical studies of patients with cerebellar damage reveal deficits in motor tasks requiring precise timing, including compensation for joint interaction torques during rapid movements (Bares et al., 2007; Bastian, 2006; Bo et al., 2008; Thach, 1998). If the bursts of PC activity were timed to occur in phase with the motor commands from M1, they would serve to reduce the magnitude of the signal through their effect on the cerebellar nucleus. However, since the bursts of PC discharge would coincide with the bursts of muscle activity, the two signals would be positively correlated, the most common relationship we observed between PC discharge and EMG activity. The critical point is that EMG activity would have been even larger in the absence of the inhibitory PC influence. By contrast, the smaller number of PCs that paused during movement would have increased the magnitude of the EMG bursts with which they were correlated resulting in negatively correlated pauses in PC discharge. This was the second most common relationship between PC discharge and EMG activity. Our results do not support a simple correspondence of PC bursts with movement restraint, nor PC pauses with facilitated limb movement. Instead, they are consistent with a model in which PCs regulate the activity within the recurrent loop that interconnects M1 and the cerebellar nuclei. The cerebellar nuclei integrate the motor-related mossy fiber drive with the modulatory effect of PC discharge. In this regard, Bloedel and colleagues (McDevitt et al., 1987) observed some time ago that PC and CN discharge is not necessarily reciprocal. Instead, PCs may precisely regulate a relatively crude, extracerebellar input in a task-appropriate manner.
4. Experimental Procedures
4.1 Training
Experimental recordings were made from two monkeys, one Macaca mulatta (monkey F) and one Macaca fascicularis (monkey G). The monkeys were trained to press buttons in sequence as they were lighted in order to obtain a liquid reward. Each monkey faced a panel containing 8 buttons arranged in a circle surrounding a central button. The monkey initiated a trial by placing its hand on a touch pad near the lap plate. After 1 second, the central button was illuminated, and the monkey reached to press it. After a fixed hold time (ranging from 0.75 to 1.0 seconds under different conditions) one of the outer targets was illuminated pseudo-randomly, and the monkey reached to it. Following a second fixed hold time, a short tone occurred, and the monkey received a juice reward. The monkey was then free to return its hand to the touch pad. Data were recorded continuously throughout these movements.
4.2 Surgical procedures
After several months of training, aseptic surgery was performed under Halothane anesthesia to implant a head holder, 20 mm diameter stainless steel recording chamber, and EMG recording electrodes. The muscles included 6-14 muscles acting at the shoulder: trapeziusF (Trp), pectoralis (Pec), anteriorF (ADL) and posteriorF deltoid (PDL); elbow: biceps (Bic) and triceps (Tri), pronator teresF (Pro), brachioradialisF (Bra); wrist: flexor carpi radialis (FCR), extensor carpi ulnarisF (ECR); and hand: extensor digitorum communisF (EDC), flexor digitorum sublimis (FDS), flexor pollicis brevis (FPB), and first dorsal interosseousF (FDI). Muscles marked with a superscript were recorded only from monkey F. All leads were passed through subcutaneous tunnels to a connector implanted on the monkey's back (Miller et al., 1993).
After all recordings were completed, each monkey received a lethal dose of sodium pentobarbital and was perfused with physiological saline followed by 10% neutral buffered formalin. The brain was removed and recording sites were identified from the location of pins left in the chamber at the time of perfusion. All animal care, surgical, and research procedures were approved by the Institutional Animal Care and Use Committee of Northwestern University.
4.3 Data collection and analysis
Single unit recordings were made in the intermediate zone of the anterior lobe of the cerebellar cortex. Waveforms and firing patterns of simple and complex spikes have been studied extensively and are commonly accepted as reliable identification criteria for Purkinje cells (Eccles et al., 1966a; Eccles et al., 1966b; Granit and Phillips, 1956; Mano et al., 1986; Thach, 1967). Briefly, sequential cerebellar cortical layers can be recognized based on the waveforms and discharge properties of the known cells in each layer. The Purkinje cell layer is particularly recognizable, with its large amplitude, relatively broad, negative/positive action potentials, and high spontaneous discharge rates. Climbing fiber related potentials can be recorded in either the molecular or Purkinje layers, but the combination of complex spikes and simple spikes was considered further evidence of a Purkinje cell recording.
Neuronal recordings were made using a seven electrode microdrive (Thomas Recording, Giessen, Germany). The microdrive used 100 micron diameter, quartz glass insulated platinum/tungsten electrodes with impedances between 2 and 4 megaohms. Each electrode could be individually adjusted in depth. The microelectrode signals were amplified, filtered, and passed through a microprocessor-based discriminator system (Plexon, Inc., Dallas, Texas). EMG signals were amplified and band-pass filtered, then rectified, low-pass filtered (corner frequency = 16 Hz), and sampled at 200 Hz. Data files of 2-3 minute duration were collected while the monkey performed the task.
All data analysis was performed using the IGOR signal analysis software (Wavemetrics, Inc., Lake Oswego, Oregon). Spike discharge was converted to instantaneous firing rate by computing the inverse of the inter-spike intervals, binning the result in 5 ms bins, and applying a two-point smoothing operation. Mean, task-related discharge rates were determined from peri-event time histograms (PETH) having 10 ms bins, and aligned to the time of touch-pad departure (reach onset) or the onset of center button press. The histograms were low-pass filtered (20 Hz, four poles), and the peak and trough of these averages were determined. The mean and standard deviation during the middle 500 ms of the touchpad hold time were used as measures of spontaneous activity. Depth of modulation (DOM) was defined as the largest change in discharge from the spontaneous rate (whether positive or negative) measured in the PETHs. The DOM was considered significant if it exceeded ±4 s.d. of the spontaneous firing rate. The DOM was considered biphasic if it included both significant increases and decreases in firing rate.
Linear cross correlations were calculated between discharge rate and the EMG signals as a measure of the relation between neuronal and muscle activity. Because we were interested in the relation between the rate modulation of the two signals, rather than the higher frequency spike interval relations, we applied additional low-pass filtering (20 Hz, 4 pole) to both signals before calculating the cross correlations. Hence these low frequency range cross correlations reflect the general correspondence between PC discharge and EMG. We have applied the same methods to recordings from the primary motor cortex (M1) in order to reveal reliable patterns in the modulation of M1 neurons and synergistic groups of muscles (Holdefer and Miller, 2002; Morrow et al., 2007).
Footnotes
Publisher's Disclaimer: This is a PDF file of an unedited manuscript that has been accepted for publication. As a service to our customers we are providing this early version of the manuscript. The manuscript will undergo copyediting, typesetting, and review of the resulting proof before it is published in its final citable form. Please note that during the production process errors may be discovered which could affect the content, and all legal disclaimers that apply to the journal pertain.
References
- Bares M, Lungu O, Liu T, Waechter T, Gomez CM, Ashe J. Impaired predictive motor timing in patients with cerebellar disorders. Exp Brain Res. 2007;180:355–65. doi: 10.1007/s00221-007-0857-8. [DOI] [PubMed] [Google Scholar]
- Barto AG, Fagg AH, Sitkoff N, Houk JC. A cerebellar model of timing and prediction in the control of reaching. Neural Comput. 1999;11:565–94. doi: 10.1162/089976699300016575. [DOI] [PubMed] [Google Scholar]
- Bastian AJ. Learning to predict the future: the cerebellum adapts feedforward movement control. Curr Opin Neurobiol. 2006;16:645–9. doi: 10.1016/j.conb.2006.08.016. [DOI] [PubMed] [Google Scholar]
- Bo J, Block HJ, Clark JE, Bastian AJ. A cerebellar deficit in sensorimotor prediction explains movement timing variability. J Neurophysiol. 2008;100:2825–32. doi: 10.1152/jn.90221.2008. [DOI] [PMC free article] [PubMed] [Google Scholar]
- De Schutter E, Steuber V. Patterns and Pauses in Purkinje Cell Simple Spike Trains: Experiments, Modeling and Theory. Neuroscience. 2009 doi: 10.1016/j.neuroscience.2009.02.040. [DOI] [PubMed] [Google Scholar]
- Eccles JC, Llinas R, Sasaki K. Parallel fibre stimulation and the responses induced thereby in the Purkinje cells of the cerebellum. Exp Brain Res. 1966a;1:17–39. doi: 10.1007/BF00235207. [DOI] [PubMed] [Google Scholar]
- Eccles JC, Llinas R, Sasaki K. The excitatory synaptic action of climbing fibres on the Purkinje cells of the cerebellum. J Physiol. 1966b;182:268–296. doi: 10.1113/jphysiol.1966.sp007824. [DOI] [PMC free article] [PubMed] [Google Scholar]
- Fortier PA, Kalaska JF, Smith AM. Cerebellar neuronal activity related to whole-arm reaching movements in the monkey. J Neurophysiol. 1989;62:198–211. doi: 10.1152/jn.1989.62.1.198. [DOI] [PubMed] [Google Scholar]
- Frysinger RC, Bourbonnais D, Kalaska JF, Smith AM. Cerebellar cortical activity during antagonist cocontraction and reciprocal inhibition of forearm muscles. J Neurophysiol. 1984;51:32–49. doi: 10.1152/jn.1984.51.1.32. [DOI] [PubMed] [Google Scholar]
- Fu QG, Flament D, Coltz JD, Ebner TJ. Relationship of cerebellar Purkinje cell simple spike discharge to movement kinematics in the monkey. J Neurophysiol. 1997;78:478–491. doi: 10.1152/jn.1997.78.1.478. [DOI] [PubMed] [Google Scholar]
- Granit R, Phillips CG. Excitatory and inhibitory processes acting upon individual Purkinje cells of the cerebellum in cats. J Physiol. 1956;133:520–47. doi: 10.1113/jphysiol.1956.sp005606. [DOI] [PMC free article] [PubMed] [Google Scholar]
- Harvey RJ, Porter R, Rawson JA. The natural discharges of Purkinje cells in paravermal regions of lobules V and VI of the monkey's cerebellum. J Physiol. 1977;271:515–536. doi: 10.1113/jphysiol.1977.sp012012. [DOI] [PMC free article] [PubMed] [Google Scholar]
- Holdefer RN, Miller LE. Primary motor cortical neurons encode functional muscle synergies. Exp Brain Res. 2002;146:233–243. doi: 10.1007/s00221-002-1166-x. [DOI] [PubMed] [Google Scholar]
- Holdefer RN, Houk JC, Miller LE. Movement-related discharge in the cerebellar nuclei persists after local injections of GABA(A) antagonists. J Neurophysiol. 2005;93:35–43. doi: 10.1152/jn.00603.2004. [DOI] [PMC free article] [PubMed] [Google Scholar]
- Houk JC, Keifer J, Barto AG. Distributed motor commands in the limb premotor network. Trends in Neurosci. 1993;16:27–33. doi: 10.1016/0166-2236(93)90049-r. [DOI] [PubMed] [Google Scholar]
- Kettner RE, Mahamud S, Leung HC, Sitkoff N, Houk JC, Peterson BW, Barto AG. Prediction of complex two-dimensional trajectories by a cerebellar model of smooth pursuit eye movement. J Neurophysiol. 1997;77:2115–30. doi: 10.1152/jn.1997.77.4.2115. [DOI] [PubMed] [Google Scholar]
- Mano NI, Yamamoto KI. Simple-spike activity of cerebellar purkinje cells related to visually guided wrist tracking movement in the monkey. J Neurophysiol. 1980;43:713–728. doi: 10.1152/jn.1980.43.3.713. [DOI] [PubMed] [Google Scholar]
- Mano NI, Kanazawa I, Yamamoto KI. Complex-spike activity of cerebellar Purkinje cells related to wrist tracking movement in the monkey. J Neurophysiol. 1986;56:137–158. doi: 10.1152/jn.1986.56.1.137. [DOI] [PubMed] [Google Scholar]
- Marple-Horvat DE, Stein JF. Cerebellar neuronal activity related to arm movements in trained rhesus monkeys. J Physiol. 1987;394:351–366. doi: 10.1113/jphysiol.1987.sp016874. [DOI] [PMC free article] [PubMed] [Google Scholar]
- McDevitt CJ, Ebner TJ, Bloedel JR. Relationships between simultaneously recorded purkinje cells and nuclear neurons. Brain Research. 1987;425:1–13. doi: 10.1016/0006-8993(87)90477-x. [DOI] [PubMed] [Google Scholar]
- Miall RC, Weir DJ, Wolpert DM, Stein JF. Is the cerebellum a Smith predictor? J Motor Behavior. 1993;25:203–216. doi: 10.1080/00222895.1993.9942050. [DOI] [PubMed] [Google Scholar]
- Miall RC, Wolpert DM. Forward models for physiological motor control. Neural networks. 1996;9:1265–1279. doi: 10.1016/s0893-6080(96)00035-4. [DOI] [PubMed] [Google Scholar]
- Miller LE, van Kan PLE, Sinkjaer T, Andersen T, Harris GD, Houk JC. Correlation of primate red nucleus discharge with muscle activity during free-form arm movements. J Physiol London. 1993;469:213–243. doi: 10.1113/jphysiol.1993.sp019812. [DOI] [PMC free article] [PubMed] [Google Scholar]
- Morrow MM, Jordan LR, Miller LE. Direct comparison of the task-dependent discharge of M1 in hand space and muscle space. J Neurophysiol. 2007;97:1786–98. doi: 10.1152/jn.00150.2006. [DOI] [PMC free article] [PubMed] [Google Scholar]
- Paulin MG. The role of the cerebellum in motor control and perception. Brain Behav Evol. 1993;41:39–50. doi: 10.1159/000113822. [DOI] [PubMed] [Google Scholar]
- Smith AM. The coactivation of antagonist muscles. Can J Physiol Pharmacol. 1981;59:733–47. doi: 10.1139/y81-110. [DOI] [PubMed] [Google Scholar]
- Thach WT. Discharge of cerebellar neurons related to two maintained postures and two prompt movements. II. Purkinje cell output and input. J Neurophysiol. 1970;33:537–547. doi: 10.1152/jn.1970.33.4.537. [DOI] [PubMed] [Google Scholar]
- Thach WT. Correlation of neural discharge with pattern and force of muscular activity, joint position, and direction of next movement in motor cortex and cerebellum. J Neurophysiol. 1978;41:654–676. doi: 10.1152/jn.1978.41.3.654. [DOI] [PubMed] [Google Scholar]
- Thach WT. What is the role of the cerebellum in motor learning and cognition? Trends in cognitive science. 1998;9:331–337. doi: 10.1016/s1364-6613(98)01223-6. [DOI] [PubMed] [Google Scholar]
- Thach WT., Jr Somatosensory receptive fields of single units in cat cerebellar cortex. J Neurophysiol. 1967;30:675–96. doi: 10.1152/jn.1967.30.4.675. [DOI] [PubMed] [Google Scholar]
- Timmann D, Richter S, Bestmann S, Kalveram KT, Konczak J. Predictive control of muscle responses to arm perturbations in cerebellar patients. J Neurol Neurosurg Psychiatry. 2000;69:345–52. doi: 10.1136/jnnp.69.3.345. [DOI] [PMC free article] [PubMed] [Google Scholar]
- Wetts R, Kalaska JF, Smith AM. Cerebellar nuclear cell activity during antagonist cocontraction and reciprocal inhibition of forearm muscles. J Neurophysiol. 1985;54:231–44. doi: 10.1152/jn.1985.54.2.231. [DOI] [PubMed] [Google Scholar]


