

Abstract
Hemispheric asymmetry reduction in older adults (HAROLD) has been frequently reported in studies of functional brain aging. It is commonly considered to be a plastic brain reorganization that provides compensation for declining unilateral neural efficiency. However, plastic functional alterations may also be associated with neural connectivity changes. Using activation and resting state functional magnetic resonance imaging (fMRI) as well as diffusion tensor imaging (DTI), we examined whether functional and structural connectivity related to prefrontal working memory function is asymmetrically reduced in the two hemispheres of the aging brain; and if yes, whether these asymmetric connectivity declines are correlated with asymmetry reduction in functional activation. With regions of interests defined by verbal working memory activations, it is revealed that although neural connectivity is generally reduced in the aging brain, prefrontal-parietal resting functional connectivity is better preserved in the left hemisphere while prefrontal DTI fiber pathways are better preserved in the right hemisphere. In addition, the laterality change of the functional activation is negatively correlated with that of the resting connectivity and positively correlated with that of the structural connectivity. These results reveal additional aspects of the neuronal alterations of aging and suggest a link between asymmetric connectivity reduction and HAROLD.
Keywords: aging, brain connectivity, functional magnetic resonance imaging, diffusion tensor imaging, verbal working memory
1. Introduction
Cognitive neuroimaging studies have shown consistently that prefrontal activation tends to be less lateralized in old adults compared with young (Cabeza et al., 1997; Cabeza et al., 2002; Cabeza et al., 2004; Dennis et al., 2007; Morcom et al., 2003; Reuter-Lorenz et al., 2000). This phenomenon is known as the HAROLD (hemispheric asymmetry reduction in older adults) effect (Cabeza, 2002), which has also been documented with electroencephalography (Bellis et al., 2000), near-infrared spectroscopy (Herrmann et al., 2006) and behavioral (Reuter-Lorenz et al., 1999) studies.
Cabeza and colleagues interpreted the HAROLD effect as a compensatory neural mechanism that can counteract age-related unilateral working efficiency decline (Cabeza et al., 2002). Their data showed that in a memory task, low-performing old subjects exhibited similar unilateral prefrontal activation as young adults, while high-performing old subjects engaged prefrontal regions bilaterally. Together with additional support from studies that suggest bilateral engagement facilitates language recovery from unilateral brain damage (Cao et al., 1999; Thulborn et al., 1999), contralateral compensation is considered a likely interpretation of neuroimaging evidence of HAROLD.
However, there are also reports of increased bilateral prefrontal engagement in old subjects where the contralateral involvement is not universally beneficial. For example, Colcombe and colleagues found significantly greater bilateral frontal recruitment in old (than young) adults during an inhibition task but the additional contralateral activation predicted poor, rather than good performance (Colcombe et al., 2005). Similarly, in a language study, Wierenga et al. found in old adults a negative correlation between picture naming accuracy and fMRI response in the non-dominant hemisphere (Wierenga et al., 2008). These data suggest that contralateral compensation is consistent with some neuroimaging findings, but there are likely other factors contributing to the HAROLD phenomenon.
The aforementioned aging studies all focused on associations between behavior and activation. However, as brain functions are supported by coordinated activations across distributed neural networks, it is highly possible that plastic functional reorganization in the aging brain is also associated with neural connectivity changes. Behavioral compensation aside, the degree to which a region activates may also be affected by how this region is connected to other collaborating areas. Specifically in the context of HAROLD, one important yet unexplored question is whether the observed activation asymmetry reduction is associated with an asymmetric connectivity decline.
This question is valid because previous studies have demonstrated that functional (Greicius et al., 2004; Rombouts et al., 2005; Sorg et al., 2007) and structural connectivity (Grieve et al., 2007; Madden et al., 2007; Makris et al., 2007; Pefefferbaum et al., 2005; Salat et al., 2005) were both non-uniformly (more pronounced in anterior regions than posterior) reduced in aging brain. With fMRI and DTI data collected in multiple sclerosis patients, Bonzano and colleagues also found that reduced structural connectivity could influence brain activation asymmetry (Bonzano et al., 2009) indicating that changes in activation pattern may have a connectivity basis. With regard to HAROLD, the activation asymmetry reduction may also be a consequence of functional and/or structural connectivity changes. For example, for typically left dominant activations, the increased right hemisphere activity in old subjects could be due to more reduced neural connectivity in the left side such that some of the processing load needs to be shifted to the relatively intact right homologue. To examine this possible activation-connectivity association behind HAROLD, the present study attempted to answer two questions: (i) whether functional and structural connectivity associated with prefrontal verbal working memory function are asymmetrically reduced in older adults; and if yes, (ii) whether these asymmetric connectivity reductions are correlated with prefrontal activation asymmetry reduction.
We collected verbal working memory and resting-state fMRI as well as DTI data from groups of old and young subjects. With the task fMRI data, we defined regions of interest (ROI) in bilateral prefrontal areas based on memory activation, and the prefrontal HAROLD effect was assessed through the activation map and laterality index. As the prefrontal and parietal regions usually co-activate (functionally linked) in working memory tasks (D’Esposito et al., 1998) and they both are known to be part of the “executive-control network” (Seeley et al., 2007), resting fMRI was used to assess hemispheric decline of this frontal-parietal functional connectivity (low frequency signal correlation). With DTI, because the precise fiber connections between the prefrontal verbal working memory area and other brain regions are difficult to ascertain, the DTI measurement of structural connectivity between prefrontal ROIs and other specific brain regions may not be valid. Instead, a fiber tracking algorithm that can calculate all possible fiber pathways passing through the bilateral prefrontal ROIs was used. It provided pathway number/amount as the connectivity strength index for the assessment of hemispheric reduction of structural connectivity. With the ROIs and connectivity indices determined, we examined the hemisphere differences of these connectivity reductions and their correlations with the prefrontal hemisphere activation changes in old subjects.
2. Results
2.1. Behavior performances
The accuracy and reaction time (RT) of subjects’ responses made at the end of each trial were compared (via a 2×2 ANOVA) between groups (young vs. old) and experiment conditions (memory vs. control trial) with the results shown in Table 1. The old subjects were generally less accurate and slower than the young subjects and this group difference was greater in the memory condition.
Table 1.
Behavior performance comparison between groups and experiment conditions
| Accuracy | Reaction Time | ||||||
|---|---|---|---|---|---|---|---|
| Memory trial | Control trial | Memory trial | Control trial | ||||
| Young group | 95% | 98% | 1162 ms | 1126 ms | |||
| Old group | 86% | 98% | 1487 ms | 1287 ms | |||
| F1, 29 | p | Partial Eta2 | F1, 29 | p | Partial Eta2 | ||
| ANOVA | AGE effect | 4.9 | 0.036 | 0.14 | 27 | 0.001 | 0.49 |
| Condition effect | 32 | <0.001 | 0.52 | 13 | 0.001 | 0.32 | |
| AGE × Condition | 10 | 0.004 | 0.26 | 6.6 | 0.016 | 0.19 | |
2.2. Activation state fMRI
The memory task activated all brain areas typically reported in verbal working memory studies, including lateral and medial prefrontal cortices as well as superior and inferior parietal regions. A comparison of prefrontal activations between the old and young groups is shown in Fig.1. Consistent with the reports of hemispheric asymmetry reduction, more prefrontal activation in the right hemisphere was seen in the old subjects.
Fig.1.
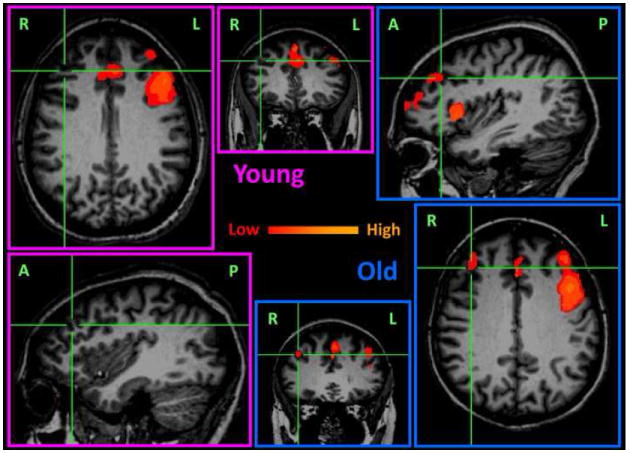
Prefrontal activation comparison between the young (outlined in pink) and old (outlined in blue) subjects. Activations were averaged within group and overlaid (p<0.01/voxel plus 377 mm3 cluster, multiple comparison corrected p<0.05) on the anatomical images of one subject from the same group. By putting the mouse cursor on an activated voxel in the right prefrontal cortex of the old group, corresponding activation maps can be compared in the axial, sagittal and coronal view. The color coding represents the IRF integration increase in the memory trials as compared to the controls. The labels L/R/A/P in the images respectively indicate left/right/anterior/posterior.
Based on the mean activation of all the participants, bilateral prefrontal and parietal ROIs were defined and are shown in Fig.2A. Clearly indicated by the ROI volumes, the evoked brain activations were left dominant in the prefrontal cortex. The impulse response functions (IRF) of bilateral prefrontal ROIs are compared between conditions (memory vs. control trial) and groups (old vs. young) in Fig.2B. In the left prefrontal ROI, memory induced IRF increase (memory - control) was higher in the young group; but in the right prefrontal ROI, this IRF increase was higher in the old group. With the memory activation level extracted from the bilateral prefrontal ROIs, the 2 (young vs. old) × 2 (left vs. right) ANOVA showed a significant (F1, 29=4.7, p=0.39, partial Eta2=0.14) AGE × HEMISPHERE interaction1 (Fig.2C, pink and blue bar plots). By scaling the old subject’s activation level with the mean value of young group, this activation asymmetry change is clearly revealed by the green and yellow bar plots in Fig.2C. Compared to the young subjects, the old subjects exhibited decreased (scaled activation < 1) prefrontal activation in the left hemisphere but increased (scaled activation > 1) prefrontal activation in the right hemisphere. The scaled activation was also significantly (paired t-test, t16=3.5, p=0.003) different between the two hemispheres. For a left dominant function, decreased left and increased right activation in the older subjects replicated the HAROLD effect.
Fig.2.
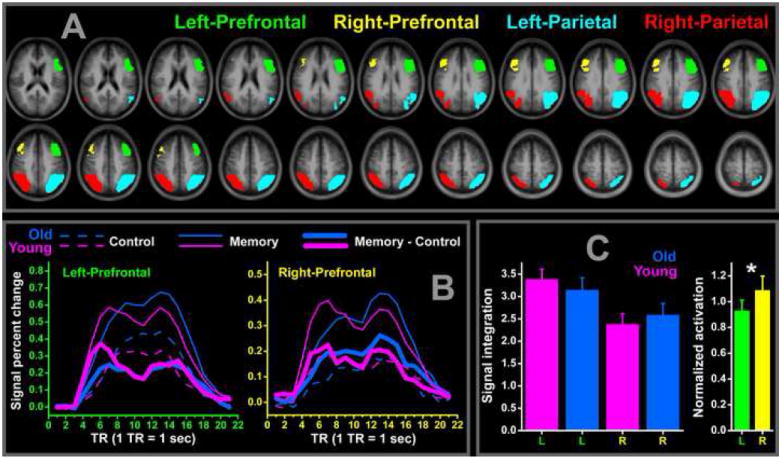
ROIs and prefrontal signal level comparison. The 4 functionally defined ROIs (labeled in same color) are shown in the top frame (A) with the mean anatomical images of all the participants as the underlay. In the bottom left frame (B), the IRFs of left and right prefrontal ROIs are compared between experimental conditions (control vs. memory trial) and groups (old vs. young). The memory associated IRF integration increases (corresponding to the thick line covered areas in the IRF plots) are compared between groups and hemispheres in the bottom right frame (C). Compared to the young group (pink bars), old subjects (blue bars) showed a decreased/increased prefrontal activation in the left/right side. This group × hemisphere interaction can also be seen in the left (L, green bar) vs. right (R, yellow bar) comparison of the normalized old group activations with significant hemisphere difference depicted by the asterisk.
For the old subjects, we also examined the behavior-activation correlation using the prefrontal ROI activation data and RTs of the memory trials. Instead of percent accuracy, RT data could avoid “ceiling effect” in this correlation analysis for those subjects who achieved 100% accuracy in the task. The correlation between prefrontal activation laterality indices and the RTs was not significant (r=0.32, p=0.22), but suggested that subjects with a shorter RT had a more rightward shift to their prefrontal activation. By splitting the group into low (mean accuracy: 80%) and high (mean accuracy: 94%) performing halves, a lower laterality index (more activation in the right hemisphere) was found in the high performing subjects. However, this laterality index group difference (-0.059high-performing vs. -0.014low-performing) was not significant either (group t-test t15=1.5, p=0.15).
2.3. Resting-state fMRI
Significant correlations of low frequency fMRI signal with prefrontal ROIs were observed in the ipsilateral parietal, medial prefrontal, as well as the contralateral prefrontal regions (see Fig.3). The parietal regions identified by this connectivity analysis largely overlap with those activated in the working memory task. These results show a close functional association between the prefrontal and parietal regions, not only during “task”, but also during “rest”.
Fig.3.
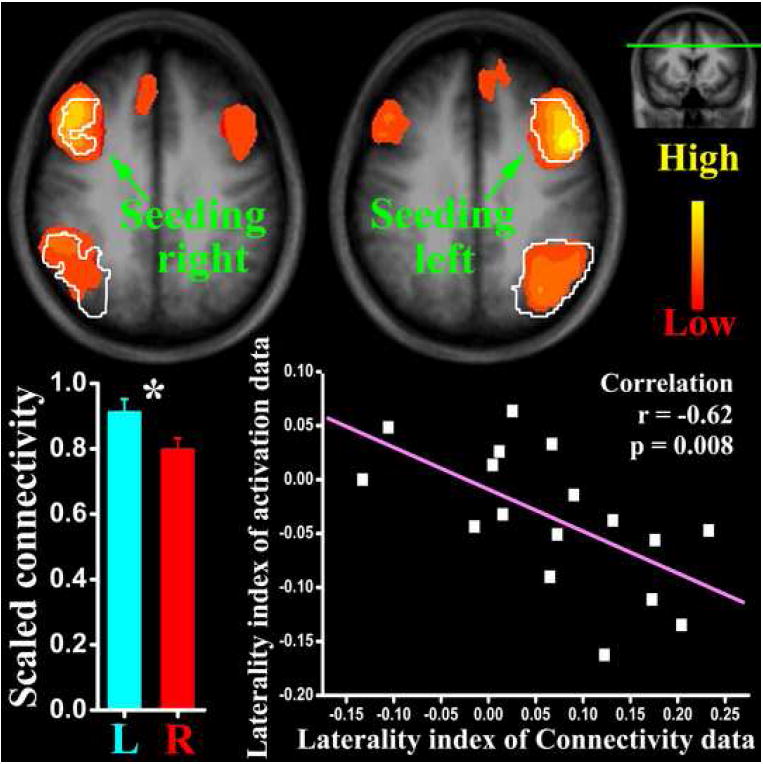
The results of resting connectivity data analysis. The two axial slices (position marked on a coronal image at the upper-right corner) show brain areas with resting signal significantly correlated, respectively, with the left and right prefrontal seeding areas (color coding here represents correlation coefficients; anatomical underlay is the mean of all participants). The white contour areas in these two images indicate the functionally defined ROIs showed in Fig.2. The bar graph shows significant (marked by the asterisk) hemispheric difference of scaled (to young level) prefrontal-parietal connectivity in the old group. The laterality index of resting connectivity and activation is negatively correlated as depicted in the dot-line plot.
With the prefrontal-parietal correlation z-scores as the input, the 2 (young vs. old) × 2 (left vs. right) ANOVA showed a significant AGE effect (F1, 29=11, p=0.002, partial Eta2=0.28) and an AGE by HEMISPHERE interaction2 (F1, 29=4.2, p=0.051, partial Eta2=0.13). For the old subjects, the functional connectivity between prefrontal and parietal ROIs is decreased in both hemispheres. In addition, this decrease was asymmetric, with the connectivity better preserved in the left hemisphere than in the right. Similar to the activation data, the old subjects’ correlation z-scores were scaled by the mean value of the young group and their hemispheric connectivity changes are compared (paired t-test, t16=2.6, p=0.02) in Fig.3. To examine the association of hemisphere connectivity and activation changes in the old subjects, laterality indices calculated from the scaled connectivity z-scores and activation values were submitted to a cross-correlation analysis and a significantly (r=-0.62, p=0.008) negative correlation was observed (Fig.3).
2.4. DTI
The tract tracing approach identified possible fiber connection in all directions for the bilateral prefrontal ROIs (Fig.4). Similar to the resting data, asymmetric pathway reductions were observed in the old subjects’ DTI data (AGE effect, F1, 24=1.8, p=0.19, partial Eta2=0.072; AGE × HEMISPHERE interaction3, F1, 24=3.1, p=0.091, partial Eta2=0.12). With old subjects’ pathway numbers scaled by young group means, their left hemisphere pathways are significantly (paired t-test, t15=2.5, p=0.026) more reduced than the right (Fig.4). For the DTI data, this scaled value hemisphere comparison is more pertinent than the unscaled value ANOVA, because the activation based prefrontal ROI had a larger volume (thus more fibers passing through) in the left hemisphere than in the right. For example, if the young subjects have a pathway number of 100 and 30 respectively in the left and right prefrontal ROIs, and both of these numbers are 20% reduced by aging, which makes them 80 and 24 for the old group, one may get a significant Age × Hemisphere interaction in this situation as the aging reduction is 20 in the left but only 6 in the right hemisphere. However, it is obvious that this hemisphere difference may simply reflect the ROI volume difference. In contrast, the scaled data comparison indicates that the structural connectivity is disproportionally more reduced in one hemisphere than the other, which can not be explained by the ROI volume difference.
Fig.4.
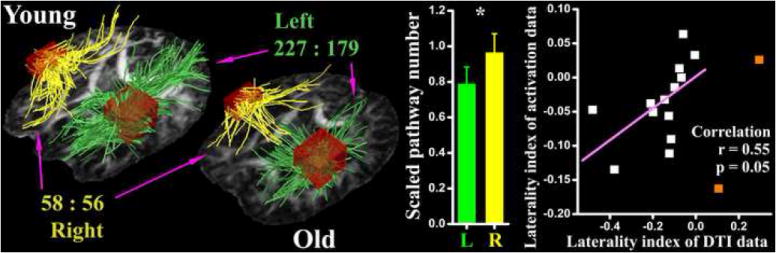
The results of DTI data analysis. Representative (from one young and one old subject) fiber pathways passing through the left (green) and right (yellow) prefrontal ROIs (the dark red cubes) are shown with an axial FA image as the underlay. With group mean pathway numbers depicted (227:179 for the left and 58:56 for the right hemisphere), hemisphere difference on structural connectivity reduction is evident. This left vs. right comparison is also shown in the bar graph. The laterality index of DTI data is correlated with that of activation data in the dot-line plot. Except two outliers (orange dots) that have better pathway preservation on the left side, DTI and fMRI laterality indices are positively correlated in the old subjects.
On the scatter plot of DTI and activation laterality index, there are two outliers whose DTI indices are distinctly distant from those of the others. Namely, their structural connectivity was better preserved in the left than in the right hemisphere (laterality index > 0). If only including old subjects with better right preservation (laterality index < 0, exclude the two outliers), the DTI laterality index calculated from the scaled pathway numbers was significantly (r=0.55, p=0.05) correlated with that of the activation data (Fig.4).
3. Discussion
In this study, with activation and resting-state fMRI as well as DTI data collected from the same group of subjects, both functional and structural connectivity associated with prefrontal working memory function were found to exhibit asymmetric reduction in the old subjects. In addition, these asymmetric declines in connectivity were correlated with the activation asymmetry reduction, suggesting a possible connectivity basis for the HAROLD effect.
Dorsolateral prefrontal and parietal regions typically co-activate in supporting many cognitive functions (Bor and Owen, 2006; Curtis and D’Esposito, 2003; Li et al., 2004; Marshuetz et al., 2000; Menon et al., 2001). Consistent with the view that brain regions with similar functionality tend to be correlated in their spontaneous fMRI activity (Fox and Raichle, 2007), recent findings from Seeley and colleagues also have shown that these two regions are intrinsically connected as the “executive-control” network (Seeley et al., 2007). Given this close functional association, aging-related alterations of prefrontal activity (asymmetry reduction) may reflect changes in the prefrontal-parietal collaboration. Our resting-state fMRI data demonstrate significant functional connection between the prefrontal area and the ipsilateral parietal area. Although both declined in the old subjects, this functional connectivity was found to be better preserved in the left hemisphere than the right. For the HAROLD effect, the rightward shifted prefrontal activation could indicate that the right prefrontal cortex needs to exert more effort as the assistance from the right parietal area is more reduced. This possibility has support from the present observation that the more right side connectivity reduces relative to the left, the more prefrontal activation shifts from the left to the right.
In addition to the HAROLD effect, different functional aging alterations taking place in the two hemispheres were also interpreted by the right hemi-aging model (Dolcos et al., 2002). Supported by behavioral studies, the model posits that the right hemisphere declines more than the left in the aging brain. For example, given the well-accepted view that verbal and spatial functions are respectively left and right dominant, Goldstein and Shelley observed more impaired spatial capability in the old subjects as compared to verbal skills (Goldstein and Shelly, 1981). In addition to those behavioral data, the present resting-state data, which showed more functional connectivity reduction in the right, provided neuroimaging support to this right hemi-aging view. As Dolcos and colleagues stated, the right hemi-aging and HAROLD model are not incompatible. Evidences of both views are found in the present study. However, different models may only reflect different aspects of the neurobiology of aging as they each were concluded from different pieces of experimental evidence.
White matter pathways are shown to be asymmetrically distributed even in healthy young individuals (Barrick et al., 2007), suggesting the possibility that the decline of structural connectivity in aging could also be asymmetric in the two hemispheres. Our DTI data support this hypothesis in the prefrontal fiber pathways associated with verbal working memory (and probably other cognitive functions). In fact, similar results can also be found in a previous aging study (Pefefferbaum et al., 2005). Also based on DTI, Pefefferbaum and colleagues reported that the proportions of coronal slices yielding significant fractional anisotropy (FA) group differences were 74% for the left hemisphere and 71% for the right. In addition, their group comparison for different brain regions showed a better FA preservation in the right middle-frontal gyrus than the left. Similar to functional connectivity, asymmetrically declining prefrontal structural connectivity could also contribute to HAROD. Namely, the prefrontal activation may shift towards the right side, as the structural connectivity is relatively intact there. This hypothesis has support from the present DTI-activation correlation. For those old subjects with a better preservation of fiber pathways in the right side, their prefrontal activations were more shifted to the right hemisphere. A similar activation-connectivity association has been reported recently by a joint fMRI-DTI study on multiple sclerosis patients (Bonzano et al., 2009). There, when left superior longitudinal fasciculus (SLF) is relatively intact, patients show left dominant brain activation, similar to the healthy controls; however, right hemisphere activation was greater if the left SLF was severely damaged.
The tractography pathways computed in the present study represent neither actual nerve fibers, nor bundles of these fibers. Rather, they are only representations of possible white matter routes. As the structural connectivity index used here, the pathway number only reflects one measure of the structural connection strength. There are also other DTI indexes that could be used, such as the FA or pathway length. We also examined the FA data and arrived at similar conclusions regarding structural connectivity changes (more reduced in the left prefrontal region). However, because (i) the local FA only reflects connectivity characteristics within the ROI but not how the ROI connects to other brain regions, and (ii) the FA value may not accurately reflect the local connectivity strength when nerve fibers cross (especially in cortical gray matter dominant regions), only the tractography results are reported here.
Our data indicates that the functional connectivity is more reduced in the right and structural connectivity is more reduced in the left. These observations are somewhat paradoxical; however, based on these data alone, a conclusion could not be made regarding the correspondence between the two types of connectivity changes because of the following considerations. First, our measurement of functional connectivity was restricted between the prefrontal and parietal regions whereas the structural connections were modeled in all directions (see Fig.4). Second, the spontaneous signal correlation may not necessarily have a direct corresponding with anatomical connections (Fox and Raichle, 2007; Koch et al., 2002). The relationship between functional and structural connectivity, especially the correspondence between their changes during aging, remains to be further investigated.
The HAROLD effect was previously postulated to be associated with behavioral compensation (Cabeza, 2002) based on the observation that low-performing old subjects exhibited unilateral prefrontal activation whereas that of high-performing subjects was bilateral (Cabeza et al., 2002). In the present data, old subjects showed a moderate correlation between RT and activation laterality with shorter RT associated with more rightward shifted prefrontal activation. This result was in agreement with the prediction of behavioral compensation. Following Cabeza and colleagues, we also separated the old subjects into high (more accurate) and low (less accurate) performing groups and found high-performing subjects on average had a more rightward biased prefrontal activation. However, the behavior-activation correlations did not reach statistical significance in the present data. With more significant connectivity-activation correlations, our data suggest that at least in the present experiment circumstance, the behavioral compensation theory could not fully explain the HAROLD phenomenon. The activation asymmetry reduction may also indicate that the neural connections supporting these activations are changed. The HAROLD model was originally proposed based on activation and behavioral data, yet it may not be limited to activation and behavior. Like Cabeza stated, HAROLD may reflect regional and network mechanisms (Cabeza, 2002). Functional and structural connectivities decline asymmetrically in the aging brain, and our study extends the HAROLD model by providing evidence supporting the network mechanisms.
As the first attempt to consider connectivity-activation association in HAROLD framework, some limitations of the present study need to be noted. First, the relatively small sample size limits the power of the statistical test performed. It is particularly so for the DTI data as fewer subjects were used. Second, bivariate correlation does not examine the predictive contribution of multiple factors (e.g. behavioral performance, functional and structural connectivity) on activation asymmetry reduction. Conclusions regarding potential predictors should rely on more sophisticated data analysis, such as hierarchical regression, which needs a much larger sample size as well. Third, generalization of the observations is limited as only female subjects were examined in the present study. As sex-specific hormone may considerably influence biological aging of the brain (Veiga et al., 2004), activation and connectivity changes could be different between the genders, and this possible gender difference is still open for future investigation.
4. Methods
4.1. Participants
Fourteen young (age 22±2.6, years of education 13±1.9) and seventeen old (age 73±5.9, years of education 16±3.5) neurologically healthy, right-handed, native English speaking women participated in the present study. We only collected female data at present as gender is a potential confounding factor in group comparison with stimuli that have semantic meanings (Konrad et al., 2008; Laiacona et al., 1998). Potential volunteers were excluded if they had a history of major psychiatric disturbance, substance abuse, or neurological injury/insult, including loss of consciousness greater than five minutes, stroke, and neurodegenerative illness. Cognitive screening of all subjects was conducted with the Wechsler Memory Scale – Third Edition (WMS-III), Logical Memory Subtest (Wechsler, 1997) and the Brief Visuospatial Memory Test – Revised (Benedict, 1997). These measures are described elsewhere (Lezak et al., 2004) and all participants scored within the normal range. All subjects gave informed consent in accordance with the guidelines established by the Emory University Institutional Review Board and the Atlanta Veterans Affairs Medical Center Research and Development Committee. For the activation and resting-state scans, imaging data from every subject were successfully collected. The DTI data in 3 young and 2 old subjects were unusable due to technical reasons.
4.2. Verbal working memory paradigm
Subjects were instructed to indicate (with a two-button response box) whether there was a semantic relationship between two words (e.g., answer YES for word pair beach-sand and NO for mud-doctor). In the memory condition, these two words were separately presented at the beginning and end of a trial with a time lag in-between. This required the participants to keep the first word in working memory in order to make a correct response upon seeing the second word. In the control condition, the two words were presented simultaneously at the end of each trial, thus eliminating the memory demand.
Fig.5 shows a schematic diagram of the task paradigm. Each trial in the present study comprised 5 slides presented with slides 1-4 each lasting 2 s and slide 5 lasting 4 s. In the memory trials, the two words were respectively shown in the 1st and 5th slides and subjects made a semantic relation judgment upon seeing the 5th slide. In the control trials, subjects made a judgment also on the 5th slide with both words on display. Because no word needs to be memorized at the display of 1st slide in the control condition, only a series of letter Xs were presented for visual perception matching between memory and control trials. Slides 2-4 in both conditions were distracters used to minimize rehearsal; there were word pairs on each of them requiring subjects to make semantic relation judgments as well. The memory and control trials were randomly distributed in all task scans with a 10 s blank screen inter-trial interval for hemodynamic response recovery. Each subject completed 35 memory and 35 control trials.
Fig. 5.
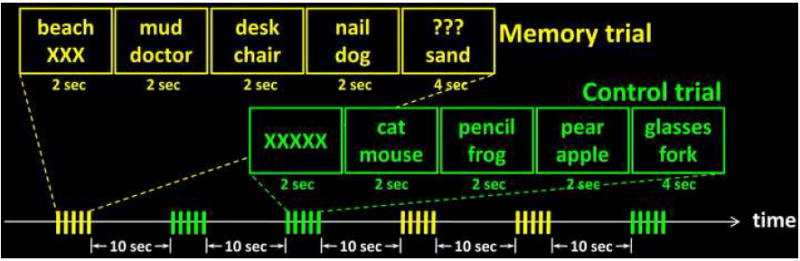
Schematic diagram of the task paradigm. There were 5 consecutively presented slides in each trial. Example stimuli for both the memory (yellow) and control (green) trials are show with the timing information depicted.
4.3. Imaging data acquisition
Imaging data were collected with a Siemens 3T Trio scanner (Siemens Medical Solutions, Malvern, PA). To minimize task interference, resting-state data were collected first, during which subjects were instructed to simply gaze at a central fixation cross. Five activation fMRI scans were performed subsequently with the subjects performing the aforementioned task. Imaging acquisition parameters are identical for resting and task fMRI scans (T2* weighted EPI sequence, 308 volume measurements, 16 axial slices, slice thickness: 5 mm, slice gap: 0 mm, FOV: 220 mm, matrix: 64×64, bandwidth: 2240 Hz/pixel, TE: 30 ms, TR: 1 s, flip angle: 60°). High-resolution T1 weighted 3D anatomical (192 sagittal slices, TR/TE: 2600/3.02 ms, flip angle: 8°, 3D FOV: 256×224×192 mm3) and DTI (diffusion-weighted, single-shot, spin-echo echo-planar imaging sequence, 12 directions, b: 0, 1000 s/mm2, TR/TE/FOV: 6500 ms/90 ms/220 mm, bandwidth: 1562 Hz/pixel, flip angle: 90°, Matrix: 128×128, 34 axial 3.5 mm slices with 0 mm gap, 6 averages) data were acquired after the functional scans. The DTI sequence used a dual spin-echo technique combined with bipolar gradients (Alexander et al., 1997), which minimizes the geometric distortion induced by eddy currents.
4.4. Imaging data analysis
AFNI (http://afni.nimh.nih.gov) was used in all the resting, activation, and DTI data analyses. In addition, DTI-Query (http://graphics.stanford.edu/projects/dti/dti-query) was used for tract path computing and visualization. For all the activation, resting and DTI data variables used in multi-factorial ANOVA analysis, a one-sample Kolmogorov-Smirnov test was performed to check whether the data were significantly different from normal distribution. The results showed no significant difference for all variable tested (all p>0.2)4, therefore, that the sample distribution reflects an underlying normal distribution was reasonably assumed.
4.4.1. Task fMRI data analysis
The memory fMRI data were analyzed with the general linear model. After the preprocessing steps, which included slice timing correction, multiple scan concatenation, rigid body volume registration, percent signal change normalization, and 5 mm FWHM Gaussian smoothing, each subject’s signal time courses were submitted to a “deconvolution” analysis. Fed with the onset (the 1st slide) timing of memory and control trials as well as the acquired fMRI signal, the analysis estimated the impulse response function (IRF) of these two conditions. The working memory network was subsequently identified by contrasting the integration of these two impulse response functions through a general linear test. After transforming (by means of anatomical markers and scaling) the resulting contrast maps spatially into the Talairach space (Talairach and Tournoux, 1998) and statistically into z-score maps, group average of brain activations across all old and young individuals was generated. For multiple-comparison correction, a voxel-wise threshold of p<0.05 plus 1653 mm3 cluster threshold (determined by a Monte Carlo simulation for corrected p<0.01) were applied. On this mean activation map, 4 activated clusters located in the bilateral prefrontal (left/right, coordinate L41.4/R40.6 mm, A15.1/A18.5 mm, S30.1/S33.7 mm, volume 15053/4620 mm3) and parietal (left/right, coordinate L36.5/R37.0 mm, P59.4/P58.6 mm, S39.9/S40.3 mm, volume 27994/22125 mm3) regions were defined as the ROIs. To ascertain the HAROLD effect, the increase of memory associated IRF integration (memory-control) was calculated for left and right prefrontal ROIs, respectively, in each subject. These IRF increase values were subsequently compared between groups and hemispheres via a 2 (young vs. old) × 2 (left vs. right) ANOVA.
We also normalized the IRF increase values of each old subject with the mean of the young subjects so that we could examine the activation in the old subjects relative to that of the young group. With these normalized activations, laterality indices were calculated with the following expression
where
4.4.2 Resting-state data analysis
The resting-state fMRI data analysis was performed with processing steps similar to those used by Fox and colleagues (Fox et al., 2005), which successfully identified the intrinsic resting functional networks. The preprocessing steps included slice timing correction, rigid body registration, temporal band-pass filtering (0.009 Hz < f < 0.08 Hz) and 5 mm FWHM Gaussian smoothing. Meanwhile, high resolution anatomical images for each individual were segmented into white matter (WM), gray matter (GM) and cerebral spinal fluid (CSF). After these preparations, cross-correlation of a reference waveform with each brain voxel time series was calculated. We used two reference waveforms that were average low-frequency time courses respectively extracted from the left and right prefrontal ROIs. Because resting-state functional connectivity measurements are based on distant gray matter region correlations (Damoiseaux et al., 2006; Lowe et al., 1998; Nir et al., 2006), spurious contributions from the WM, CSF and whole brain signals, as well as the 6 parameters (X-Y-Z shifts and yaw-pitch-roll rotations) of rigid body head motion were removed in the cross-correlation analysis through multiple linear regression. In order to combine/compare correlation results within/between groups, correlation coefficient maps for each individual subject were converted to z-scores and then transformed into the Talairach space. These z-score maps were averaged across all the subjects and a threshold of p<0.01/voxel plus 705 mm3 cluster (yielding p<0.01/overall) was applied. To determine the degree of frontal-parietal functional connectivity, correlation z-scores in bilateral parietal ROIs were extracted from each subject. Similar to the activation data analysis, these z-scores were compared between groups and hemispheres by an AGE × HEMISPHERE ANOVA. The data of the old subjects were also scaled by the corresponding young group means. With the scaled ROI connectivity measures calculated for the left and right hemispheres, a corresponding laterality index was calculated and correlated with that of the activation data.
4.4.3 DTI data analysis
The DTI data were preprocessed by rigid body image registration (to the b0 image) for each subject and the 6 principle direction tensors were then calculated. In each individual’s native space, tractography paths were computed with the “TEND” (Tensor deflection) approach, which uses the tensor at each point to multiply the incoming path vector, resulting a new vector that is deflected toward the principal direction of diffusion (Lazar et al., 2003). This fiber tracking algorithm was run in the whole brain (path step size: 2 mm, space between seeds: 4 mm, FA/angle termination threshold: 0.15/45°, min/max path length: 5 mm/300 mm) and derived all possible routes throughout the white matter. After the pathway computation, bilateral prefrontal ROIs, projected from the Talairach space back to each individual’s native space, were used to “prune” the results so that only pathways going through these two regions were retained. In addition, an average (through the path) fractional anisotropy (FA) threshold of 0.2 was applied for the final result rendering. Because DTI-Query only accepts cubical ROIs, the prefrontal ROIs used for pathway selection were not identical to those defined based on the functional activation. Instead, we kept the centroid coordinates and volumes the same but proportionally adjusted the length, width and height of the cube according to the 3 dimensions of the activation ROIs. For each subject, the left and right prefrontal pathway numbers were respectively obtained and submitted to the AGE × HEMISPHERE ANOVA. The data for the old subjects were scaled with the young group means and compared between the two hemispheres as well. Finally, the old group’s laterality index was calculated and correlated with that of the activation data.
Acknowledgments
This study has funding support from National Institutes of Health (RO1 DA17795, RO1 EB00200 to XH); Georgia Research Alliance (to XH); American Federation for Aging Research (to ABM), and Department of Veterans Affairs (B4954N, B3323K to ABM). We thank Drs. Bruce Crosson and Stuart Zola for comment and input on the design of the behavioral paradigm adopted for use in the scanner. We also thank Center for Health in Aging at Emory University for support in subject recruitment.
Footnotes
AGE main effect, F1, 29=0.002, p=0.97, partial Eta2<0.001; HEMISPHERE main effect, F1, 29=58, p<0.001, partial Eta2=0.67
HEMISPHERE main effect, F1, 29=1.7, p=0.21, partial Eta2=0.055
HEMISPHERE main effect, F1, 24=125, p<0.001, partial Eta2=0.84
Kolmogorov-Smirnov test p values of the Young-Left / Old-Left / Young-Right / Old-Right variable: Activation-Data, 0.94 / 0.22 / 0.64 / 0.21; Resting-Data, 0.87 / 0.65 / 0.67 / 0.98; DTI-Data, 0.99 / 0.89 / 0.79 / 0.83
Publisher's Disclaimer: This is a PDF file of an unedited manuscript that has been accepted for publication. As a service to our customers we are providing this early version of the manuscript. The manuscript will undergo copyediting, typesetting, and review of the resulting proof before it is published in its final citable form. Please note that during the production process errors may be discovered which could affect the content, and all legal disclaimers that apply to the journal pertain.
References
- Alexander AL, Tsuruda JS, Parker DL. Elimination of eddy current artifacts in diffusion-weighted echo-planar images: the use of bipolar gradients. Magn Reson Med. 1997;38:1016–1021. doi: 10.1002/mrm.1910380623. [DOI] [PubMed] [Google Scholar]
- Barrick TR, Lawes IN, Mackay CE, Clark CA. White matter pathway asymmetry underlies functional lateralization. Cereb Cortex. 2007;17:591–598. doi: 10.1093/cercor/bhk004. [DOI] [PubMed] [Google Scholar]
- Bellis TJ, Nocol T, Kraus N. Aging affects hemispheric asymmetry in the neural representation of speech sounds. J Neurosci. 2000;20:791–797. doi: 10.1523/JNEUROSCI.20-02-00791.2000. [DOI] [PMC free article] [PubMed] [Google Scholar]
- Benedict RHB. Brief Visuospatial Memory Test-Revised: Professional manual. Psychological Assessment Resources, Inc; Odessa, FL: 1997. [Google Scholar]
- Bonzano L, Pardini M, Mancardi GL, Pizzorno M, Roccatagliata L. Structural connectivity influences brain activation during PVSAT in multiple sclerosis. NeuroImage. 2009;44:9–15. doi: 10.1016/j.neuroimage.2008.08.015. [DOI] [PubMed] [Google Scholar]
- Bor D, Owen AM. A common prefrontal-parietal network for mnemonic and mathematical recoding strategies within working memory. Cereb Cortex. 2006;17:778–786. doi: 10.1093/cercor/bhk035. [DOI] [PubMed] [Google Scholar]
- Cabeza R, Grady CL, Nyberg L, Mclntosh AR, Tulving E, Kapur S, Jennings JM, Houle S, Craik FIM. Age-related differences in neural activity during memory encoding and retrieval: a positron emission tomography study. J Neurosci. 1997;17:391–400. doi: 10.1523/JNEUROSCI.17-01-00391.1997. [DOI] [PMC free article] [PubMed] [Google Scholar]
- Cabeza R. Hemispheric asymmetry reduction in older adults: the HAROLD model. Psychol Aging. 2002;17:85–100. doi: 10.1037//0882-7974.17.1.85. [DOI] [PubMed] [Google Scholar]
- Cabeza R, Anderson ND, Locantore JK, McIntosh AR. Aging gracefully: compensatory brain activity in high-performing older adults. NeuroImage. 2002;17:1394–1402. doi: 10.1006/nimg.2002.1280. [DOI] [PubMed] [Google Scholar]
- Cabeza R, Daselaar SM, Dolcos F, Prince SE, Budde M, Nyberg L. Task-independent and task-specific age effects on brain activity during working memory, visual attention and episodic retrieval. Cereb Cortex. 2004;14:364–375. doi: 10.1093/cercor/bhg133. [DOI] [PubMed] [Google Scholar]
- Cao Y, Vikingstad EM, George KP, Johnson AF, Welch KMA. Cortical language activation in stroke patients recovering from aphasia with functional MRI. Stroke. 1999;30:2331–2340. doi: 10.1161/01.str.30.11.2331. [DOI] [PubMed] [Google Scholar]
- Colcombe SJ, Krarner AF, Erickson KI, Scalf P. The implications of cortical recruitment and brain morphology for individual differences in inhibitory function in aging humans. Psychol Aging. 2005;20:363–375. doi: 10.1037/0882-7974.20.3.363. [DOI] [PubMed] [Google Scholar]
- Curtis CE, D’Esposito M. Persistent activity in the prefrontal cortex during working memory. Trends Cogn Sci. 2003;7:415–423. doi: 10.1016/s1364-6613(03)00197-9. [DOI] [PubMed] [Google Scholar]
- D’Esposito M, Aguirre GK, Zarahn E, Ballard D, Shin RR, Lease J. Functional MRI studies of spatial and nonspatial working memory. Brain Res Cogn Brain Res. 1998;7:1–13. doi: 10.1016/s0926-6410(98)00004-4. [DOI] [PubMed] [Google Scholar]
- Damoiseaux JS, Rombouts SARB, Barkhof F, Scheltens P, Stam CJ, Smith SM, Beckmann CF. Consistent resting-state networks across healthy subjects. Proc Natl Acad Sci U S A. 2006;103:13848–13853. doi: 10.1073/pnas.0601417103. [DOI] [PMC free article] [PubMed] [Google Scholar]
- Dennis NA, Kim H, Cabeza R. Effects of aging on true and false memory formation: an fMRI study. Neuropsychologia. 2007;45:3157–3166. doi: 10.1016/j.neuropsychologia.2007.07.003. [DOI] [PubMed] [Google Scholar]
- Dolcos F, Rice HJ, Cabeza R. Hemispheric asymmetry and aging: right hemisphere decline or asymmetry reduction. Neurosci Biobehav Rev. 2002;26:819–825. doi: 10.1016/s0149-7634(02)00068-4. [DOI] [PubMed] [Google Scholar]
- Fox MD, Snyder AZ, Vincent JL, Corbetta M, Essen DCV, Raichle ME. The human brain is intrinsically organized into dynamic, anticorrelated functional networks. Proc Natl Acad Sci U S A. 2005;102:9673–9678. doi: 10.1073/pnas.0504136102. [DOI] [PMC free article] [PubMed] [Google Scholar]
- Fox MD, Raichle ME. Spontaneous fluctuations in brain activity observed with functional magnetic resonance imaging. Nat Rev Neurosci. 2007;8:700–711. doi: 10.1038/nrn2201. [DOI] [PubMed] [Google Scholar]
- Goldstein G, Shelly D. Does the right hemisphere age more reapidly than the left? J Clin Neuropsychol. 1981;3:65–78. doi: 10.1080/01688638108403114. [DOI] [PubMed] [Google Scholar]
- Greicius MD, Srivastava G, Reiss AL, Menon V. Deault-mode network activity distinguishes Alzheimer’s disease from healthy aging: evidence from functional MRI. Proc Natl Acad Sci U S A. 2004;101:4637–4642. doi: 10.1073/pnas.0308627101. [DOI] [PMC free article] [PubMed] [Google Scholar]
- Grieve SM, Williams LM, Paul RH, Clark CR, Gordon E. Cognitive aging, executive function and fractional anisotropy: a diffusion tensor MR imaging study. AJNR Am J Neuroradiol. 2007;28:226–235. [PMC free article] [PubMed] [Google Scholar]
- Herrmann MJ, Walter A, Ehlis A-C, Fallgatter AJ. Cerebral oxygenation changes in the prefrontal cortex: effects of age and gender. Neurobiol Aging. 2006;27:888–894. doi: 10.1016/j.neurobiolaging.2005.04.013. [DOI] [PubMed] [Google Scholar]
- Koch MA, Norris DG, Hund-Georgiadis M. An investigation of functional and anatomical connectivity using magnetic resonance imaging. NeuroImage. 2002;16:241–250. doi: 10.1006/nimg.2001.1052. [DOI] [PubMed] [Google Scholar]
- Konrad C, Engelien A, Schoning S, Zwitserlood P, Jansen A, Pletziger E, Beizai P, Kersting A, Ohrmann P, Luders E, Greb RR, Heindel W, Arolt V, Kugel H. The functional anatomy of semantic retrieval is influenced by gender, menstrual cycle, and sex hormones. J Neural Transm. 2008;115:1327–1337. doi: 10.1007/s00702-008-0073-0. [DOI] [PMC free article] [PubMed] [Google Scholar]
- Laiacona M, Barbarotto R, Capitani E. Semantic category dissociations in naming: is there a gender effect in Alzheimer’s disease? Neuropsychologia. 1998;36:407–419. doi: 10.1016/s0028-3932(97)00125-5. [DOI] [PubMed] [Google Scholar]
- Lazar M, Weinstein DM, tsuruda JS, Hasan KM, Arfanakis K, Meyerand ME, Badie B, Rowley HA, Haughton V, Field A, Alexander AL. White matter tractography using diffusion tensor deflection. Hum Brain Mapp. 2003;18:306–321. doi: 10.1002/hbm.10102. [DOI] [PMC free article] [PubMed] [Google Scholar]
- Lezak MD, Howieson DB, Loring DW. Neuropsychological Assessment. Oxford University Press; New York: 2004. [Google Scholar]
- Li Z, Sun X, Wang Z, Zhang X, Zhang D, He S, Hu X. Behavioral and functional MRI study of attention shift in human verbal working memory. NeuroImage. 2004;21:181–191. doi: 10.1016/j.neuroimage.2003.08.043. [DOI] [PubMed] [Google Scholar]
- Lowe MJ, Mock BJ, Sorenson JA. Functional connectivity in single and multislice echoplanar imaging using resting-state fluctuations. Neuroimage. 1998;7:119–132. doi: 10.1006/nimg.1997.0315. [DOI] [PubMed] [Google Scholar]
- Madden DJ, Spaniol J, Whiting WL, Bucur B, Provenzale JM, Cabeza R, White LE, Huettel SA. Adult age differences in the functional neuroanatomy of visual attention: a combined fMRI and DTI study. Neurobiol Aging. 2007;28:459–476. doi: 10.1016/j.neurobiolaging.2006.01.005. [DOI] [PMC free article] [PubMed] [Google Scholar]
- Makris N, Papadimitriou GM, Kouwe Avd, Kennedy DN, Hodge SM, Dale AM, Benner T, Wald LL, Wu O, Tuch DS, Caviness VS, Moore TL, Killiany RJ, Moss MB, Rosene DL. Frontal connections and cognitive changes in normal aging rhesus monkeys: a DTI study. Neurobiol Aging. 2007;28:1556–1567. doi: 10.1016/j.neurobiolaging.2006.07.005. [DOI] [PubMed] [Google Scholar]
- Marshuetz C, Smith EE, Jonides J, DeGutis J, Chenevert TL. Order information in working memory: fMRI evidence for parietal and prefrontal mechanisms. J Cogn Neurosci. 2000;12(Supplement):130–144. doi: 10.1162/08989290051137459. [DOI] [PubMed] [Google Scholar]
- Menon V, Adleman NE, White CD, Glover GH, Reiss AL. Error-related brain activation during a Go/NoGo response inhibition task. Hum Brain Mapp. 2001;12:131–143. doi: 10.1002/1097-0193(200103)12:3<131::AID-HBM1010>3.0.CO;2-C. [DOI] [PMC free article] [PubMed] [Google Scholar]
- Morcom AM, Good CD, Frackowiak RSJ, Rugg MD. Age effects on the neural correlates of successful memory encoding. Brain. 2003;126:213–229. doi: 10.1093/brain/awg020. [DOI] [PubMed] [Google Scholar]
- Nir Y, Hasson U, Levy I, Yeshurun Y, Malach R. Widespread functional connectivity and fMRI fluctuations in human visual cortex in the absence of visual stimulation. Neuroimage. 2006;30:1313–1324. doi: 10.1016/j.neuroimage.2005.11.018. [DOI] [PubMed] [Google Scholar]
- Pefefferbaum A, Adalsteinsson E, Sullivan EV. Frontal circuitry degradation marks healthy adult aging: evidence from diffusion tensor imaging. NeuroImage. 2005;26:891–899. doi: 10.1016/j.neuroimage.2005.02.034. [DOI] [PubMed] [Google Scholar]
- Reuter-Lorenz PA, Stanczak L, Miller AC. Neural recruitment and cognitive aging: two hemispheres are better than one, expecially as you age. Psychol Sci. 1999;10:494–500. [Google Scholar]
- Reuter-Lorenz PA, Jonides J, Smith EE, Hartley A, Miller A, Marshuetz C, Koeppe RA. Age differences in the frontal lateralization of verbal and spatial working memory revealed by PET. J Cogn Neurosci. 2000;12:174–187. doi: 10.1162/089892900561814. [DOI] [PubMed] [Google Scholar]
- Rombouts SARB, Barkhof F, Goekoop R, Stam CJ, Scheltens P. Altered resting state networks in mild cognitive impairment and mild Alzheimer’s disease: an fMRI study. Hum Brain Mapp. 2005;26:231–239. doi: 10.1002/hbm.20160. [DOI] [PMC free article] [PubMed] [Google Scholar]
- Salat DH, Tuch DS, Greve DN, Kouwe AJWvd, Hevelone ND, Zaleta AK, Rosen BR, Fischl B, Corkin S, Rosas HD, Dale AM. Age-related alterations in white matter microstructure measured by diffusion tensor imaging. Neurobiol Aging. 2005;26:1215–1227. doi: 10.1016/j.neurobiolaging.2004.09.017. [DOI] [PubMed] [Google Scholar]
- Seeley WW, Menon V, Schatzberg AF, Keller J, Glover GH, Kenna H, Reiss AL, Greicius MD. Dissociable intrinsic connectivity networks for salience processing and executive control. J Neurosci. 2007;27:2349–2356. doi: 10.1523/JNEUROSCI.5587-06.2007. [DOI] [PMC free article] [PubMed] [Google Scholar]
- Sorg C, Riedl V, Muhlau M, Calhoun VD, Eichele T, Laer L, Drzezga A, Forstl H, Kurz A, Zimmer C, Wohlschlager AM. Selective changes of resting-state networks in individuals at risk for Alzheimer’s disease. Proc Natl Acad Sci U S A. 2007;104:18760–18765. doi: 10.1073/pnas.0708803104. [DOI] [PMC free article] [PubMed] [Google Scholar]
- Talairach J, Tournoux P. Co-planar stereotaxic atlas of the human brain. Thieme Medical Publishers, Inc.; New York: 1998. [Google Scholar]
- Thulborn KR, Carpenter PA, Just MA. Plasticity of language-related brain function during recovery from stroke. Stroke. 1999;30:749–754. doi: 10.1161/01.str.30.4.749. [DOI] [PubMed] [Google Scholar]
- Veiga S, Melcangi RC, DonCarlos LL, Garcia-Segura LM, Azcoitia I. Sex hormones and brain aging. Exp Gerontol. 2004;39:1623–1631. doi: 10.1016/j.exger.2004.05.008. [DOI] [PubMed] [Google Scholar]
- Wechsler D. Wechsler Memory Scale. Psychological Corporation; San Antonio, TX: 1997. [Google Scholar]
- Wierenga CE, Benjamin M, Gopinath K, Perlstein WM, Leonard CM, Rothi LJG, Conway T, Cato MA, Briggs R, Crosson B. Age-related changes in word retrieval: role of bilateral frontal and subcortical networks. Neurobiol Aging. 2008;29:436–451. doi: 10.1016/j.neurobiolaging.2006.10.024. [DOI] [PubMed] [Google Scholar]