Abstract
Background
Liver regeneration following partial hepatectomy requires the orchestration of highly regulated molecular pathways; a change in the abundance or activity of a specific gene product has the potential to adversely affect this process. The NFAT (nuclear factor of activated T-cells) transcription factors represent a family of gene transcription signaling intermediates that translate receptor-dependent signaling events into specific transcriptional responses using the Ras/Raf pathway.
Materials/Methods
Eight week old NFAT4 knockout (KO) mice and their wild type counterparts (Balb-c) underwent two-thirds partial hepatectomy. The animals were sacrificed and their livers were harvested at specific timepoints during regeneration. Recovery of liver mass was measured for each timepoint. PCR analysis was used to analyze expression levels of the immediate early genes c-fos, c-jun and c-myc as well as downstream effectors of NFAT4 including FGF-18 and BMP-4.
Results
Hepatocyte proliferation and thus liver regeneration following hepatectomy was suppressed in NFAT4 knockout (KO) mice. Statistical significance was reached at 1 hour, 7 days and 10 days (p < 0.05) with a 22% median reduction in regeneration of liver mass in the NFAT4 KO mice by 10 days, at which time liver regeneration should be complete in mice. The immediate early gene c-fos was elevated in NFAT4 KO mice during early regeneration with a median value at one hour and one day of 1.60E-08 and 1.09E-08 vs 6.10E-09 and 1.55E-09 in the Balb-c mice. C-jun, in contrast, was elevated during late regeneration in the NFAT4 KO mice (3.40E-09 and 5.67E-09 at 7 and 10 days, respectively) in comparison to the Balb-c mice (7.76E-10 and 1.24E-09, respectively.). NFAT2 was also upregulated in the NFAT4 KO mice; however, no changes were detected in its downstream effectors, CCR1 and CCL3.
Conclusions
We demonstrated that NFAT4 deficiency impairs hepatic regeneration in a murine model proving that NFAT4 plays an important yet unclear role in liver regeneration; its absence may be compensated by c-fos, c-jun and NFAT2 expression changes.
Keywords: NFAT4, regeneration, liver, hepatectomy, mouse
Introduction
Liver regeneration is a physiologic response of liver mass recovery following loss. Normal adult hepatocytes are usually quiescent with the potential to replicate in response to certain stimuli. After surgical procedures that reduce mass, such as partial hepatectomy or living donor liver transplantation, rapid enlargement of remnant or graft liver takes place to restore liver function [1]. Clinically, liver regeneration has important implications because many therapeutic strategies depend on the ability of the liver to selfreplicate. Insufficient liver regeneration can result in death after liver resection or small for size liver transplantation [2].
The best studied model of liver regeneration is 70% partial hepatectomy in rodents. After surgical removal of two-thirds of the liver, hepatocytes exit their mitotically inactive G0 state and synchronously progress through several cell cycles [3]; DNA synthesis initially takes place at 12–16 hours post-hepatectomy and peaks at 24 and 40 hours in the rat and mouse, respectively. Eventual restoration of the original liver mass occurs in 7–10 days [4].
Nuclear factor of activated T-cells (NFAT) is a family of five transcription factors that were initially identified in immune cells; these proteins have subsequently been found to be active in several other cell types. NFAT proteins are activated by diverse stimuli that lead to increased intracellular calcium levels. NFATs were identified in Tcells as rapidly inducible nuclear factors binding to the distal antigen receptor response element, ARRE-2, of the human IL-2 promoter [5]. The physiologic functions of NFATs have been broadly studied, and it is known that the NFAT family plays a crucial role in the development of various organs and in cell proliferation [6]. In addition to their cytokine expression properties, NFATs have been shown to regulate other genes related to cell-cycle progression, cell differentiation and apoptosis, revealing a broader role of these proteins in normal cell physiology [7]. Previous unpublished data from our lab using a model of NFAT5 deficiency demonstrated a down-regulation of NFAT4 in mice with decreased liver regeneration following partial hepatectomy. This led to the study of liver regeneration in NFAT4 deficient mice. In this paper, we demonstrate that NFAT4 is an important player in liver regeneration. In its absence, liver regeneration does not proceed to completion. We further demonstrate that cfos, cjun and NFAT2 are elevated in NFAT4 deficient mice, which may represent a compensatory response to NFAT4 deficiency during liver regeneration.
Materials and Methods
Animals
All experiments were performed in accordance with the National Institutes of Health Guide for the Care and Use of Laboratory Animals, approved by and carried out under the guidelines of the Institutional Animal Care and Use committee at Vanderbilt University Medical Center, Nashville, TN. Eight week old male Balb/c mice (~23g) purchased from Jackson Laboratory (Bar Harbor, ME) were used as control mice. Eight week old male NFAT4 deficient (~22g) mice on a Balb/c background (a generous gift from Dr. Laurie Glimcher, Boston, MA) were used as experimental subjects. All animals were housed under pathogen free conditions in a climate controlled institutional animal facility on a 12-h dark/12-h light cycle where food and water was provided ad libitum.
Genotyping
Transgenic mice were identified by PCR analysis of DNA obtained by tail biopsy using specific PCR primers: NFAT4 – KO primer (5’ – CCAAGAAGATCAGAAGACTGTG – 3’), and WT (Balb/c) primer (5’ – GCTCTAAAGATGGCTCCGTGCTTAAGG – 3’), and Neo primer (5’ – AGCGTTGGCTACCCGTGATATTGCTGAAGA – 3’). Results were confirmed by gel electrophoresis.
Partial Hepatectomy
Fifteen NFAT4 KO mice and fifteen Balb/c mice underwent two- thirds partial hepatectomy. The mice were sacrificed at specific timepoints (1 hour, 1 day, 3 days, 7 days and 10 days), resulting in three mice per genotype at each timepoint. Eight week old mice were anesthetized using inhaled isoflurane anesthesia and subjected to midventral laparotomy. The left lateral, left median and right median lobes were ligated and excised as previously described [8]. Resected specimens were weighed, and the abdominal cavity was then closed. Mean resection percentage with respect to mean adult liver size was determined. Mean adult liver size was determined to be 1.23 +/− 0.02g in an independent experiment using Balb/c control mice. Mean liver resection percentage was 64 +/− 2%. Animals were sacrificed at 1 hour, 1 day, 3 days, 7 days and 10 days post- hepatectomy, and the regenerating livers were harvested. Recovery of liver mass was determined by the ratio of liver mass to body weight at sacrifice divided by the ratio of the estimated total liver mass at resection to body weight at resection. Estimated total liver mass at the time of resection was calculated by taking the mass of the resected liver and dividing by 0.64 [9]. Random sections of liver were fixed in formalin and embedded in paraffin for microscopy and PCNA immunohistochemistry to determine the fraction of proliferating hepatocytes.
Cell Proliferation Assays
PCNA Staining
PCNA staining was performed by the Vanderbilt University Medical Center IHC Core using the following protocol. Actively replicating cells were selectively highlighted within tissue samples by immunostaining for proliferating cell nuclear antigen (PCNA). Five micron sections were placed on charged slides and paraffin embedded. The sections were rehydrated and placed in heated Target Retrieval Solution (Labvision, Fremont, CA) for 20 minutes. Endogenous peroxidase was neutralized with 0. 3% hydrogen peroxide followed by a casein-based protein block (DakoCytomation, Carpinteria, CA) for nonspecific staining inhibition. The sections were incubated with rabbit anti-PCNA (Santa Cruz Biotechnology, Santa Cruz, CA) diluted 1:100 for 60 minutes. Sections without primary antibody served as negative controls. The Dako Envision + System, DAB/Peroxidase (DakoCytomation) was used to produce localized, visible staining. The slides were lightly counterstained with Mayer’s hematoxylin, dehydrated and cover-slipped. PCNA positive cells were counted per 500 hepatocytes in five separate sections of representative slides from each group. Mean values were obtained by averaging the number of PCNA stained cells in each section.
Quantitative Real-time PCR
All real-time quatitative PCR reactions were performed as described elsewhere [10]. Briefly, total RNA was prepared from snap frozen regenerating liver tissue samples using RNAzol B (Tel-Test Inc.) Tissue was homogenized in RNAzol, precipitated using chloroform and isopropanol, washed and dried with ethanol, and re-suspended in DEPC water. mRNA was reverse transcribed to produce cDNA and submitted to real-time quantitative PCR using the Bio-Rad icycler and IQ Supermix buffer containing SYBER Green (Bio-Rad, Hercules, CA). Duplicate or triplicate amplification reactions were performed in 96-well plates (Bio-Rad, Hercules, CA). Each reaction contained 12.5ul IQ supermix buffer, 300nM forward and reverse primers, and 1uL cDNA in a final volume of 25uL. The primers, gene expression assay kits and cycling conditions for each gene are located in table 1.
Table 1. PCR Primers and Cycling Conditions.
Primers and cycling conditions for NFAT1, NFAT2, c-fos, c-myc, NFAT4, NFAT5, c-jun, NFAT 3, BMP-4, FGF-18, GAPDH.
| Gene | Primers | Cycling Conditions |
|---|---|---|
| NFAT1 | Forward 5’ – GAGATGGAAGCTACGGTGGA - 3’ Reverse, 5’ – TGGCTGACTTCGTTTCCTCT - 3’ |
95°C for 30 seconds then 45 cycles at 95°C for 15 seconds, 55°C for 30 seconds, and 72°C for 30 seconds followed by 72°C for 7 minutes then Melt Curve |
| NFAT2 | Forward, 5’ – TTCCGCAACCA GAGGATAAC - 3’ Reverse, 5’ - AACATTGGCAGGAAGGTACG - 3’; |
95°C for 30 seconds then 45 cycles at 95°C for 15 seconds, 55°C for 30 seconds, and 72°C for 30 seconds followed by 72°C for 7 minutes then Melt Curve |
| c-fos | Forward 5’ – ATCCTTGGAGCCAGTCAAGA – 3’ Reverse 5’ – ATGAT GCCGGAAACAAGAAG – 3’ |
95°C for 30 seconds then 45 cycles at 95°C for 15 seconds, 55°C for 30 seconds, and 72°C for 30 seconds followed by 72°C for 7 minutes then Melt Curve |
| c-myc | Forward 5’ – CTGTCCATTCAAGCAGACGA – 3’ Reverse 5’ – TCCAGCTCCTCC TCGAGTTA – 3’ |
95°C for 30 seconds then 45 cycles at 95°C for 15 seconds, 55°C for 30 seconds, and 72°C for 30 seconds followed by 72°C for 7 minutes then Melt Curve |
| NFAT4 | Forward, 5’ – GCTGCAGCCTATGCCTTATC - 3’ Reverse, 5’ – TGGCCTGTACTTTGTGCTTG - 3’ |
95°C for 30 seconds then 45 cycles at 95°C for 15 seconds, 56°C for 30 seconds, and 72°C for 30 seconds followed by 72°C for 7 minutes then Melt Curve |
| NFAT5 | Forward, 5’ – GGGTCAAACGACG AGATTGT - 3’ Reverse, 5’- CCGTGGTAAGCTGAGAAAGC - 3’ |
95°C for 30 seconds then 45 cycles at 95°C for 15 seconds, 53°C for 30 seconds, and 72°C for 30 seconds followed by 72°C for 7 minutes then Melt Curve |
| c-jun | Forward 5’- TCCCCTATCGACATGGAGTC – 3’ Reverse 5’ – TTTTGCGCTTTCAAGGTTTT – 3’ |
95°C for 30 seconds then 45 cycles at 95°C for 15 seconds, 54°C for 30 seconds, and 72°C for 30 seconds followed by 72°C for 7 minutes then Melt Curve |
| NFAT3 | Forward 5’-GGTTGTGCCCGCCTACC-3’ Reverse 5’- CCTCCATATTGATCACCAGGAAA-3’ Probe FAM-TCAGTCTCTCTTTCCTTCCGCGCCC- TAMRA (Applied Biosystems, Inc.) |
50°C for 2 minutes, 95°C for 8 minutes 30 sec then 45 cycles at 95°C for 15 seconds and 60°C for 1 minute. |
| BMP-4 | Taqman Gene Expression Assay # Mm00433286_m1 (Applied Biosystems, Inc.) | 50°C for 2 minutes, 95°C for 8 minutes 30 sec then 45 cycles at 95°C for 15 seconds and 60°C for 1 minute. |
| FGF-18 | Taqman Gene Expression Assay # Mm00432087_m1 (Applied Biosystems, Inc.) | 50°C for 2 minutes, 95°C for 8 minutes 30 sec then 45 cycles at 95°C for 15 seconds and 60°C for 1 minute. |
| GAPDH | Taqman Gene Expression Assay # Mm99999915_g1 (Applied Biosystems, Inc.) | 50°C for 2 minutes, 95°C for 8 minutes 30 sec then 45 cycles at 95°C for 15 seconds and 60°C for 1 minute. |
Data analysis was carried out using the Bio-Rad icycler PCR detection and analysis software version 3.0 (Bio-Rad, Hercules, CA). As a control, expression of glyceraldehyde-3-phosphate dehydrogenase (GAPDH) was detected. Each sample’s expression was normalized by comparison with GAPDH and relative quantification was performed using the standard curve method as described in detail elsewhere. [11]
Western Blot
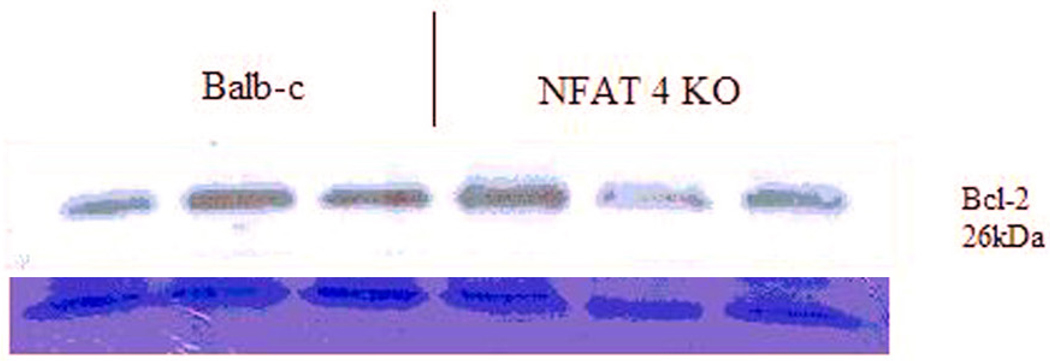
Western blot analysis was carried out to evaluate the levels of Bcl-2 expression between Balb-c and NFAT4 KO mice. Samples from three Balb-c and three NFAT4 KO mice post hepatectomy were homogenized in RIPA buffer to obtain whole cell lysates for protein extraction. 60 micrograms of protein from each sample were then separated by SDS-PAGE and transferred overnight to a nitrocellulose membrane. Western blotting was then performed using the Bcl-2 primary antibody supplied by Santa Cruz at a 1:100 dilution in milk. Secondary antibody blotting was performed using goat anti-mouse horse raddish peroxidase at a 1:5000 dilution in milk.
Statistical Analysis
Student t-test was performed to determine significance for the difference between the means of two groups for normally distributed data. Mann Whitney U was performed to determine statistical significance for the difference between the means of two groups for non-normally distributed data. Friedman ANOVA was used to determine significance for the difference between the means of different measures among the same group. Significance was set at a p-value < 0.05 for liver regeneration data. For all PCR data, a Bonferroni adjustment was necessary for the 5 post hoc comparisons made. Thus, statistical significance for PCR data was set at a p-value ≤ 0.01.
Results
Recovery of liver mass is reduced in NFAT4 deficient mice
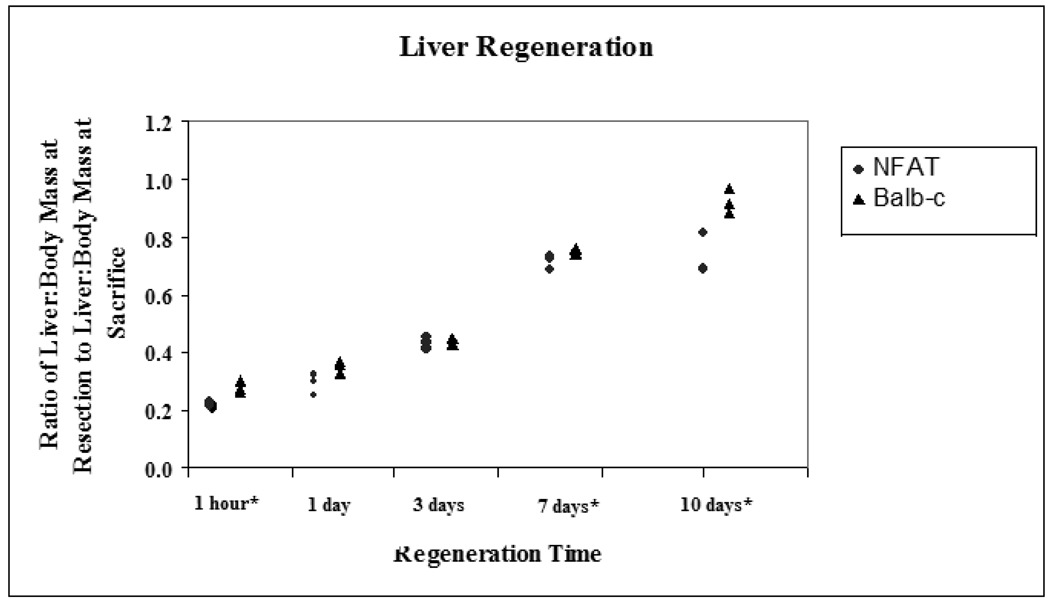
Following two-thirds hepatectomy, recovery of liver mass was reduced in NFAT4 KO mice. NFAT4 deficiency was verified by PCR analysis for NFAT4 (data not shown.) Dot plots comparing the median and ranges for liver regeneration are graphed in figure 1. There was significantly less recovery of liver mass following partial hepatectomy in NFAT4 deficient mice at 1 hour, 7 days and 10 days after partial hepatectomy (p < 0.05.). At 1 hour, median recovery in the NFAT4 KO mice was 22% (22% – 23%) compared to 27% (26% – 30%) in the Balb-c mice. At 7 days, the median recovery and range in the NFAT4 KO mice was 72% (69% – 73%) compared to 75% (74% – 76%) in the Balb-c mice. At 10 days, median recovery and range in the NFAT4 KO mice was 69% (68.8% −81%) compared to 91% (88% – 97%) in the Balb-c mice.
Figure 1.
Liver Regeneration
Median and ranges for liver regeneration are graphed. Balb/c mice are represented by the black triangles and NFAT4 KO mice are represented by the gray circles. Asterisks represent significant values with p ≤ 0.05 taken as statistical significance.
* p < 0.05
Cell proliferation is significantly reduced in NFAT4 deficient mice
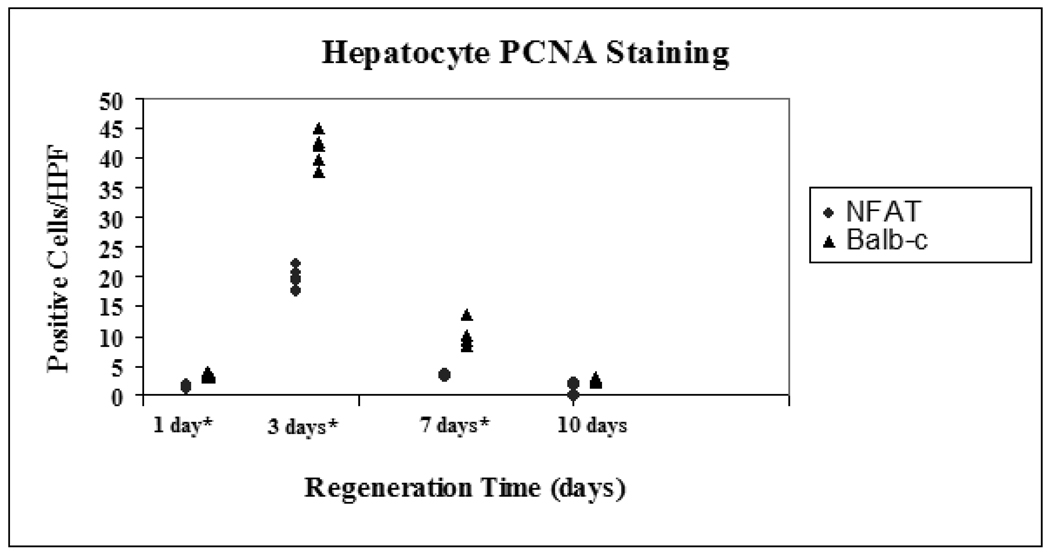
Regenerating cells were identified via immunohistochemical staining for PCNA. Actively replicating cells were selectively highlighted within tissue samples by IHC staining for proliferating cell nuclear antigen (PCNA) and counted per 500 hepatocytes. NFAT4 deficient mice had significantly reduced PCNA staining compared to Balb/c mice at 1, 3, and 7 days (figure 2a). The median and range for NFAT4 KO mice at 1 day was 1.6 (1.0 – 2.0) compared to 3.8 (3.1 – 4.1) for Balb-c mice. At 3 days the median and range was 19.3 (17.4 – 21.8) for NFAT4 KO mice compared to 41.7 (37.4 – 44.8) for Balb-c mice. Median and range for the NFAT4 KO mice at 7 days was 3.3 (3.1 – 3.6) compared to 9.4 (8.4 – 13.7) for the Balb-c mice.
Figure 2.
PCNA staining of actively replicating cells
Median and ranges for PCNA staining of actively regenerating cells are graphed. Balb/c mice are represented by the black triangles and NFAT4 KO mice are represented by the gray circles. Asterisks represent significant values with p ≤ 0.05 taken as statistical significance.
* p < 0.05
NFAT4 KO mice demonstrated early upregulation of c-fos and late up-regulation of c-jun during liver regeneration
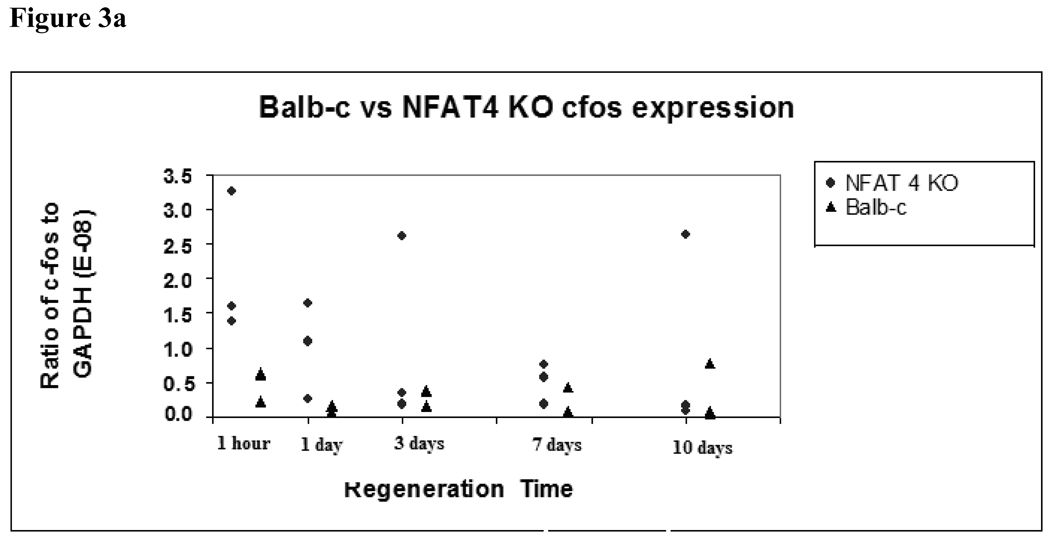
At one hour and one day, there were higher levels of expression of c-fos in the NFAT4 KO mice compared to the Balb/c mice which failed to reach the statistically significant p-value of 0.01, although a definite trend is observed. Median and ranges for cfos expression at one hour and 1 day for NFAT4 KO mice were 1.60E-08 (1.38E-08 to 3.25E-08) and 1.09E-08 (2.43E-09 to 1.64E-08), respectively, compared to 6.10E-09 (2.28E-09 to 6.33E-09) and 1.55E-09 (6.66E-10 to 1.69E-09) for Balb-c mice. Later in regeneration, no significant difference in c-fos expression between NFAT4 KO and Balb/c mice was detected before or after Bonferroni adjustment. (figure 3a.)
Figure 3.
Figure 3a. C-fos expression in Balb/c versus NFAT4 KO mice.
Median and ranges for c-fos expression are graphed normalized to GAPDH expression. Balb/c mice are represented by the black triangles. NFAT4 KO mice are represented by the gray circles. Mann Whitney U test was used to determine significance of the difference between the means of c-fos expression between the two groups.
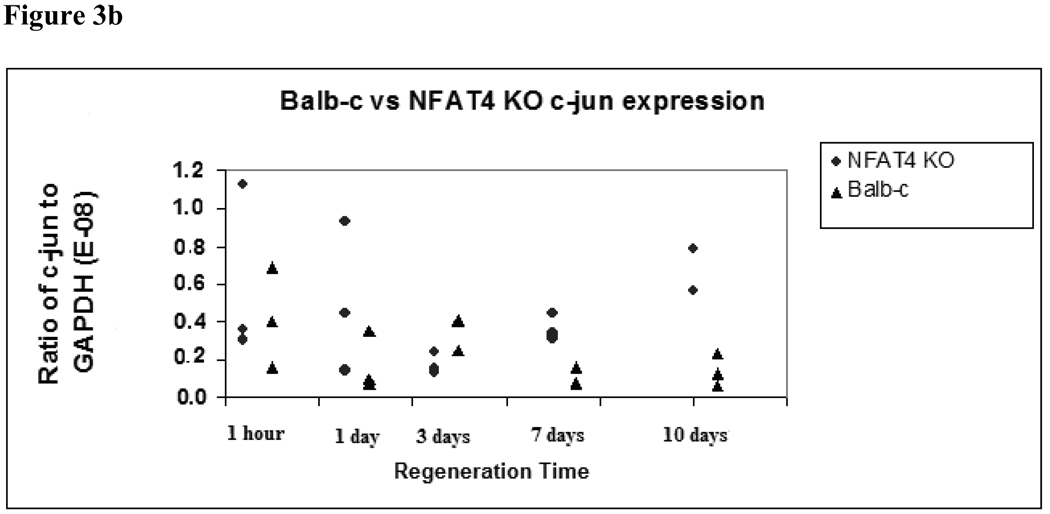
Figure 3b. C-jun expression in Balb/c versus NFAT4 KO mice.
Median and range values for c-jun expression are graphed normalized to GAPDH expression. Balb/c mice are represented by black triangles. NFAT4 KO mice are represented by gray circles. Mann Whitney U test was used to determine significance of the difference between the means of c-jun expression between the two groups.
C-jun also demonstrated time-dependent modulation of expression levels. Figure 3b graphically depicts the median and ranges for c-jun expression in NFAT4 KO mice and Balb/c mice at the specified timepoints. At 3 days, c-jun expression was lower in the NFAT4 KO mice compared to the Balb/c mice although not statistically significant with a median and range of 1.70E-09 (1.54E-09 to 2.63E-09) in the NFAT4 KO mice compared with 4.22E-09 (2.67E-09 to 4.34E-09) in the Balb-c mice.) At 7 and 10 days, there was a reversal in this trend; c-jun expression was greater in the NFAT4 KO mice compared to the Balb/c mice with a median and range of 3.40E-09 (3.16E-09 to 4.45E-09) in the NFAT4 KO mice compared to 7.76E-10 (6.79E-10 to 1.63E-09) in the Balb-c mice at 7 days. At 10 days the median and range for the NFAT4 KO mice was 5.67E-09 (5.61E-09 to 7.89E-09 compared to 1.24E-09 (6.47E-10 to 2.30E-09) in the Balb-c mice. Again, a trend is observed but our results failed to reach statistical significance.
C-myc expression showed no consistent difference in pattern of expression between the NFAT4 KO and Balb/c mice.
BMP-4 and FGF-18 expression levels are unchanged following partial hepatectomy in both NFAT4 KO and Balb/c mice
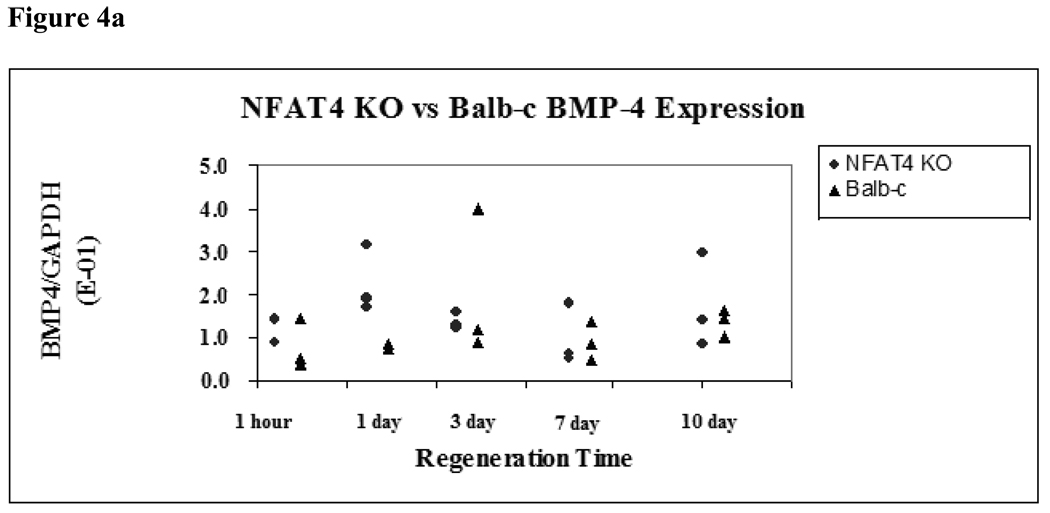
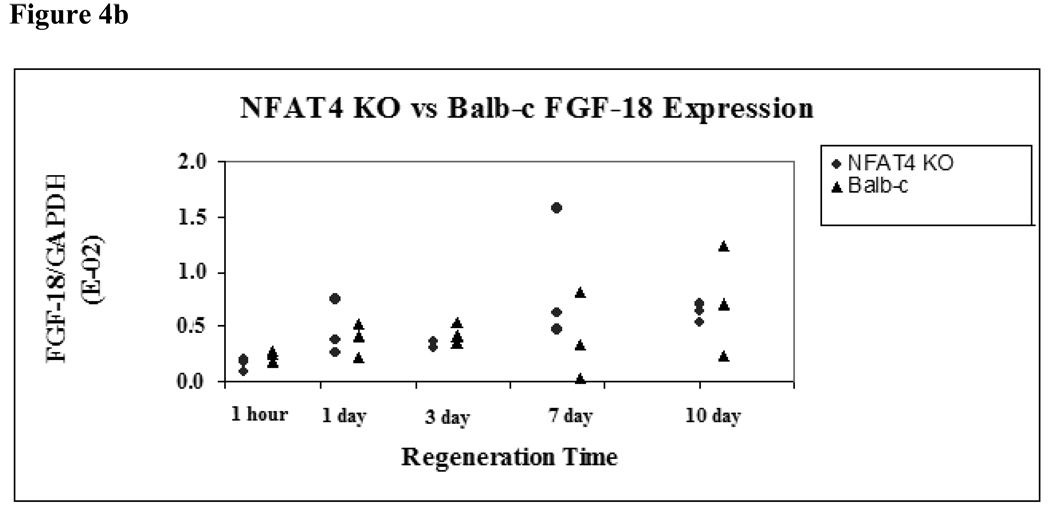
The expression of two downstream mediators of NFAT4, BMP-4 and FGF-18, were assessed using real-time PCR analysis for both groups at the specified timepoints. BMP-4 and FGF-18 showed no statistically significant difference in expression between NFAT4 KO mice and Balb/c mice at any timepoint (Figure 4a and Figure 4b).
Figure 4.
Figure 4a. BMP-4 Expression in NFAT4 KO vs Balb/c Mice
Median and range values for BMP-4 expression are graphed normalized to GAPDH expression. Balb/c mice are represented by the black triangles. NFAT4 KO mice are represented by the gray circles. Mann Whitney U test was used to determine if there was statistical significance in the difference in expression of BMP-4 at the specified timepoints.
Figure 4b. FGF-18 Expression in NFAT4 KO vs Balb/c Mice
Median and range values for FGF-18 expression are graphed normalized to GAPDH expression. Balb/c mice are represented by black triangles. NFAT4 KO mice are represented by gray circles. Mann Whitney U test was used to determine if there was statistical significance in the difference in expression of FGF-18 at the specified timepoints.
NFAT2 expression is significantly elevated in NFAT4 KO mice
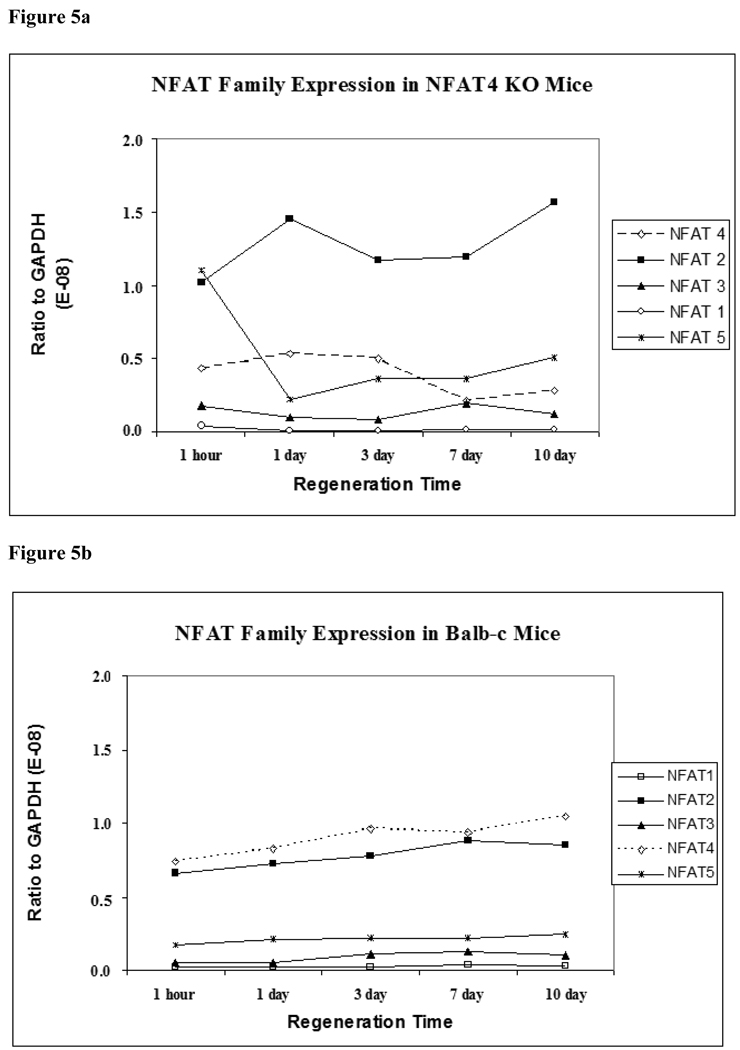
Figure 5a demonstrates the expression patterns of the five members of the NFAT family in NFAT4 KO mice. At all timepoints, NFAT2 shows marginally significant higher levels of expression over all other members of the NFAT family in the NFAT4 KO mice at 1 hour (p = 0.022), 1 day (p = 0.017), 3 days (p = 0.017), 7 days (p = 0.022) and 10 days (p = 0.017).
Figure 5.
Figure 5a. NFAT family expression in NFAT4 KO mice
Mean values for expression of NFAT1, NFAT2, NFAT3, NFAT4 and NFAT5 expression are graphed normalized to GAPDH expression. NFAT1 is represented by the black line with un-shaded circles. NFAT2 is represented by the black line with shaded boxes. NFAT3 is represented by the black line with shaded triangles. NFAT4 is represented by the dashed line with un-shaded diamonds. NFAT5 is represented by the dashed line with interrupting x signs. Friedman’s ANOVA was used to determine if there was a statistical difference between the means of the expression of the NFATs at each timepoint.
Figure 5b. NFAT family expression in Balb-c mice.
Mean values for expression of NFAT1, NFAT2, NFAT3, NFAT4 and NFAT5 expression are graphed normalized to GAPDH expression. NFAT1 is represented by the black line with un-shaded circles. NFAT2 is represented by the black line with shaded boxes. NFAT3 is represented by the black line with shaded triangles. NFAT4 is represented by the dashed line with un-shaded diamonds. NFAT5 is represented by the dashed line with interrupting x signs.
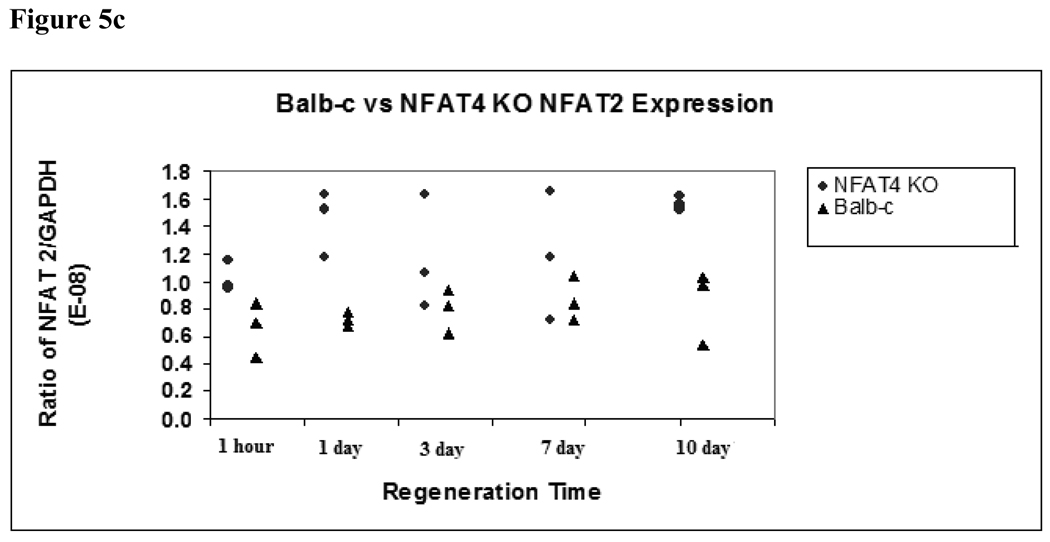
Figure 5c. NFAT2 expression in NFAT4 KO mice and Balb/c mice
Median and range values for NFAT2 expression are graphed normalized to GAPDH expression. Balb/c mice are represented by black triangles. NFAT4 KO mice are represented by gray circles. A student’s t-test was used to determine if there was statistical significance in the difference of expression of NFAT2 at the specified timepoints.
NFAT4 KO mice also had significantly higher levels of expression of NFAT2 compared to their wild-type counterparts at 1 day (p = 0.007), and marginally significant higher levels of expression at 10 days (p = 0.011) following partial hepatectomy (Figure 5c). Median and ranges for NFAT2 expression in NFAT4 KO mice at 1 day and 10 days were 1.53E-08 (1.17E-08 to 1.63E-08) and 1.55E-08 (1.52E-08 to 1.62E-08), respectively, compared to 7.23E-09 (6.78E-09 to 7.81E-09) and 9.68E-09 (5.44E-09 to 1.04E-08) in the Balb-c mice.
At one hour status post partial hepatectomy, there was a trend toward significance (p = 0.052) in NFAT2 expression differences between the NFAT 4 KO mice with a median and range of 9.76E-09 (9.47E-09 to 1.15E-08) and the Balb-c mice with a median and range of 6.95E-09 (4.46E-09 to 8.44E-09.)
There were no differences in apoptosis to explain impaired liver regeneration in NFAT4 KO mice
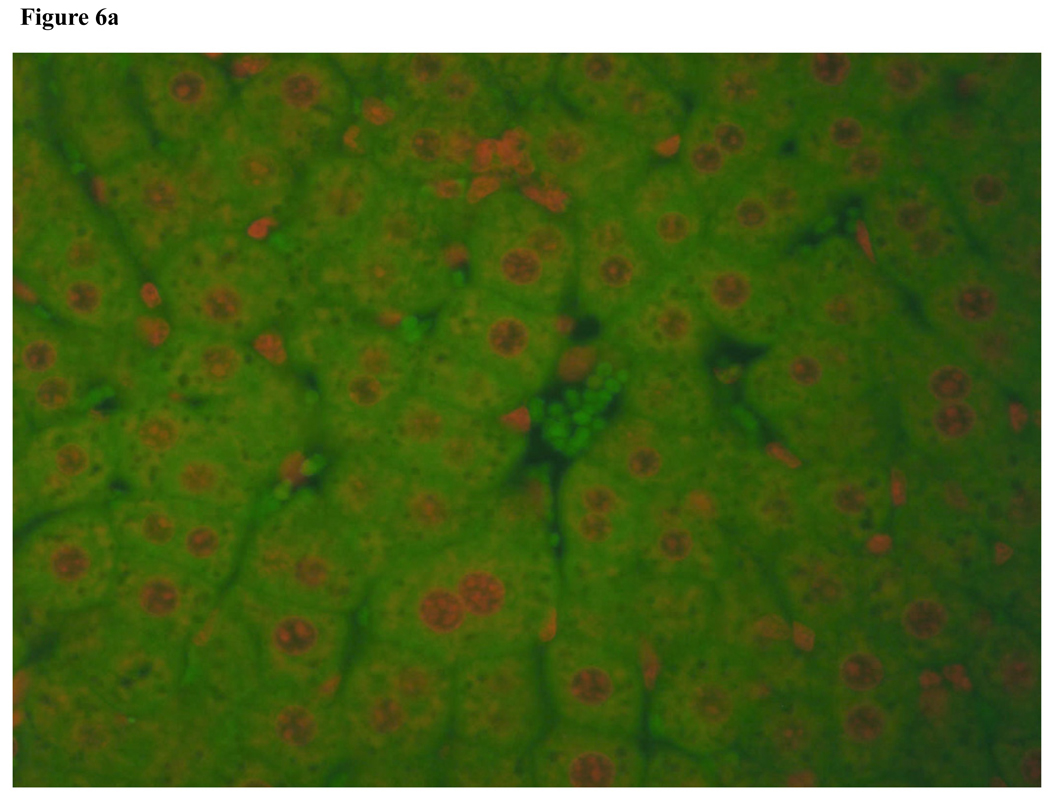
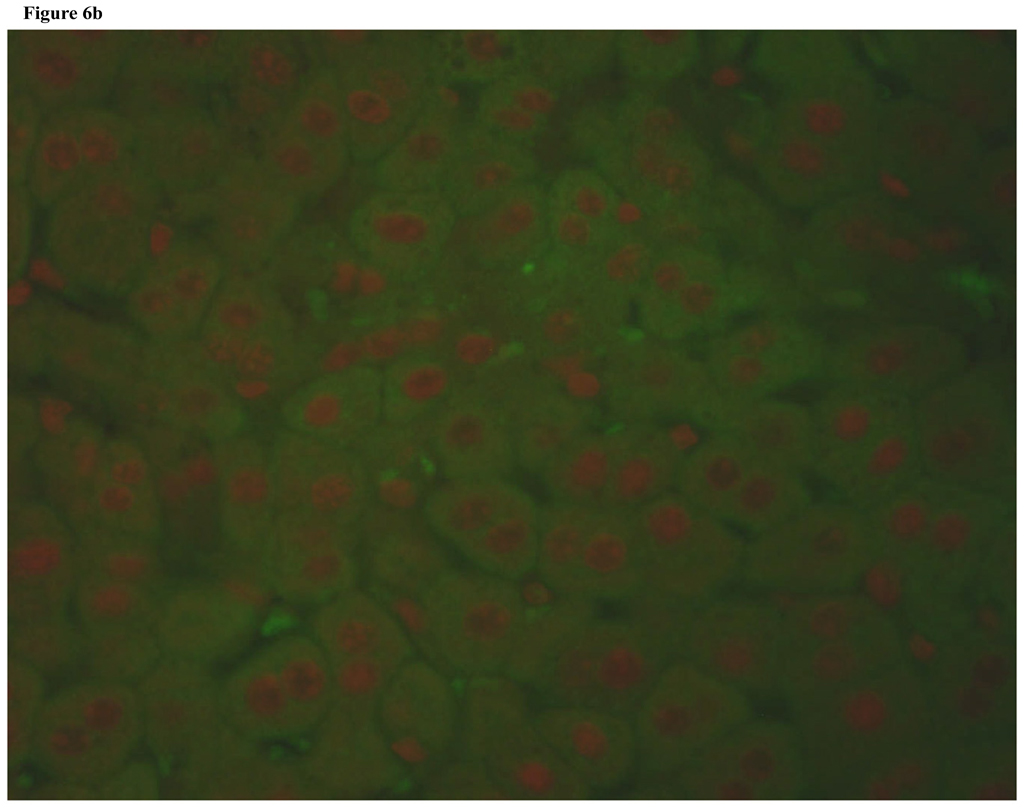
To determine if increased apoptosis was responsible for the impaired liver regeneration in NFAT4 KO mice, we used a TUNEL assay. Figure 6a and Figure 6b demonstrate TUNEL staining of regenerating liver from a Balb-c mouse and an NFAT4 KO mouse, respectively. TUNEL positive cells which indicate apoptosis are absent from both slides indicating that there is no observed apoptosis. The protein levels of expression for Bcl-2 (an anti-apoptosis marker) were assessed in parallel with TUNEL staining. Figure 7 demonstrates the results which indicate that there were no differences in the protein expression of Bcl-2 between NFAT4 KO mice and controls.
Figure 6.
Figure 6a. Fluorescent Tunel staining of regenerating liver from Balb-c mouse.
Figure 6b. Fluorescent Tunel staining of regenerating liver from NFAT4 KO mouse.
Figure 7.
Western blot for Bcl-2 protein expression with coomassie stain.
Discussion
The NFAT family of transcription factors have been shown in previous studies to play a role in cell cycle progression and morphogenesis of various organs. In this paper, we demonstrated that in NFAT4 deficient mice, liver regeneration is impaired following partial hepatectomy. At ten days, when liver regeneration is thought to be complete in rodents, the NFAT4 KO mice had significantly less recovery of liver mass as compared to their wild-type counterparts. Impaired regeneration was also demonstrated by a reduction in mitotic activity in the NFAT4 KO mice.
Prior studies have implicated the immediate early genes c-fos, c-jun and c-myc in the priming phase of liver regeneration [12]. We examined the expression of these immediate early genes in the NFAT4 KO and Balb/c mice expecting to find a significantly lower level of expression in the NFAT4 KO mice given their reduced liver regeneration. In contrast, we found a pattern of higher expression of c-fos in the NFAT4 KO mice during the earlier stages of liver regeneration and higher expression of c-jun in the NFAT4 KO mice during the later stages of liver regeneration. Although we failed to reach statistical significance, the trend observed suggests that c-fos and c-jun may be elevated as a compensatory response to liver regeneration occurring in the setting of NFAT4 deficiency. While some studies have suggested that c-fos, c-jun and c-myc up-regulation are necessary for liver regeneration to proceed, several studies have shown otherwise [13,14]. This debate was not resolved by the present study.
In studying the role of NFAT4 in the process of liver regeneration, we evaluated the expression of FGF-18, a known downstream effecter of NFAT4 [15]. There was no differential expression of FGF-18 noted between the NFAT4 KO and Balb/c mice indicating that the impaired liver regeneration in the NFAT4 KO mice was not related to alterations in FGF-18 expression. Given previous work demonstrating the interdependence between FGF-18 and bone morphogenic protein (BMP) and prior studies into the role of BMP-4 in hepatogenesis [16–18], we also evaluated the expression pattern of BMP-4 following partial hepatectomy. Again, no differential expression of BMP-4 was demonstrated between NFAT4 KO and Balb/c mice. This would indicate that the effect of NFAT4 on liver regeneration is not mediated through FGF-18 or BMP-4.
PCR analysis of the entire NFAT family demonstrated that NFAT2 had marginally significant higher levels of expression in the NFAT4 KO mice over all other family members. We also showed that NFAT2 expression in the NFAT4 KO mice was elevated compared to the Balb/c mice. As a result, we subsequently explored the expression of the downstream effectors of NFAT2 (CCR1 and CCL3) in both groups of mice to compare their post-hepatectomy expression levels. We found no difference in expression of either CCR1 or CCL3 between the two groups of mice (data not shown) illustrating that the impaired liver regeneration in the NFAT4 KO mice is not attributable to either of these factors.
This study demonstrates that NFAT4 deficient mice have impaired liver regeneration compared to wild-type controls. The mechanism of liver regeneration in these mice may occur through a pathway involving compensatory up-regulation of c-fos and c-jun. In studies of normal human T-cells, AP-1 (activator protein 1) is a component of the NFAT protein complex[19]. The two most common proteins comprising AP-1 are c-fos and c-jun. This provides a link between NFAT4 and c-fos and c-jun expression perhaps further supporting the possibility that in the NFAT4 KO mice, c-fos and c-jun overexpression is an attempt to compensate for lack of NFAT4.
In a study by Oukka et al., the authors discovered that NFAT4 KO mice had impaired expression of the anti-apoptotic protein Bcl-2 which resulted in increased thymocyte apoptosis during t-cell development in the thymus[20]. This observation might have explained the incomplete liver regeneration in NFAT4 KO mice following partial hepatectomy; however, tunel staining did not demonstrate any evidence of apoptosis in our NFAT4 KO mice. We also failed to demonstrate any differential protein expression of Bcl-2 between the NFAT4 KO mice and their wild-type counterparts. Of note, with respect to apoptosis, NFAT2 has been shown previously to protect against apoptosis [21] to which NFAT4 KO mice are thought to be prone. Since we did not demonstrate an increase in apoptosis in our mouse model of NFAT4 deficiency, it is possible that NFAT2 upregulation is acting in this fashion.
There were several limitations in this study. The first and most important of which is our sample size. Given the small sample sizes of 3 per group used in this study, our overall power was limited at the outset which minimized the overall detectable significance of our results. The small sample size used in this study resulted from the limitation in the number of transgenic NFAT4 KO offspring produced. The knowledge to be attained from this study was felt to be important enough to proceed even with the power limitations. The other limitation that needs to be addressed is one of method. The method used in this paper to calculate recovery of liver mass has the inherent flaw of possibly accounting for more than simply the degree of liver regeneration since it can be affected by gross weight variations resulting from individual complications during recovery. Although, this possibility is true, any major weight changes occurring due to illness should not go unnoticed and data from any animal that is not well should be omitted from final analysis to reduce the chance of data bias. Any normal weight fluctuations should bias toward the null and would ultimately have no effect.
In summary, NFAT4 KO mice demonstrate incomplete liver regeneration following partial hepatectomy. In the NFAT4 KO mice, c-fos and c-jun show a trend towards time-dependent overexpression which may be an attempt to compensate for the lack of NFAT4 during liver regeneration through an alternate pathway. Additionally, NFAT2 is upregulated in NFAT4 KO mice which may be protective against apoptosis. A clear link between c-jun, c-fos, NFAT2 and NFAT4 has yet to be established.
Acknowledgements
Support provided by the National Institutes of Health 5T32CA106183-03 (KBP), R01 DK64669-01 A2 (RSC) and 5F32 DK072796 (TME)
Laurie Glimcher (Boston, MA) for the gift of the NFAT4 knockout (KO) mice.
Footnotes
Publisher's Disclaimer: This is a PDF file of an unedited manuscript that has been accepted for publication. As a service to our customers we are providing this early version of the manuscript. The manuscript will undergo copyediting, typesetting, and review of the resulting proof before it is published in its final citable form. Please note that during the production process errors may be discovered which could affect the content, and all legal disclaimers that apply to the journal pertain.
References
- 1.Yokoi H, Isaji S, et al. Donor Outcome and Liver Regeneration After Right Lobe Graft Donation. Transplanation International. 2005;18:915–922. doi: 10.1111/j.1432-2277.2005.00158.x. [DOI] [PubMed] [Google Scholar]
- 2.Vetelainen R, van Vliet AK, et al. Severe steatosis increases hepatocellular injury and impairs liver regeneration in a rat model of partial hepatectomy. Annals of Surgery. 2007;245:44–50. doi: 10.1097/01.sla.0000225253.84501.0e. [DOI] [PMC free article] [PubMed] [Google Scholar]
- 3.Taub R. Liver Regeneration: From Myth to Mechanism. Nature Reviews Molecular Cell Biology. 2004;5:836–847. doi: 10.1038/nrm1489. [DOI] [PubMed] [Google Scholar]
- 4.Koniaris LG, McKillop IH, et al. Liver Regeneration. Journal of the American College of Surgeons. 2003;197:634–659. doi: 10.1016/S1072-7515(03)00374-0. [DOI] [PubMed] [Google Scholar]
- 5.Shaw JP, Utz PJ, et al. Identification of a putative regulator of early T cell activation. Science. 1988;241:202–205. [PubMed] [Google Scholar]
- 6.Chang CP, Nielson JR, et al. A field of myocardial-endocardial NFAT signaling underlies heart valve morphogenesis. Cell. 2004;118:649–663. doi: 10.1016/j.cell.2004.08.010. [DOI] [PubMed] [Google Scholar]
- 7.Viola JP, Carvalho LD, et al. NFAT Transcription Factors: From Cell Cycle to Tumor Development. Brazilian Journal of Medical and Biological Research. 2005;38:335–344. doi: 10.1590/s0100-879x2005000300003. [DOI] [PubMed] [Google Scholar]
- 8.Harkness RD. The spatial distribution of dividing cells in the liver of the rat after partial hepatectomy. Journal of Physiology. 1952;116:373–379. doi: 10.1113/jphysiol.1952.sp004711. [DOI] [PMC free article] [PubMed] [Google Scholar]
- 9.Kaibori M, Tomohisa Inoue, et al. Exogenously Administered HGF Activator Augments Liver Regeneration through the Production of Biologically Active HGF. Biochemical and Biophysical Research Communications. 2002;290:475–481. doi: 10.1006/bbrc.2001.6170. [DOI] [PubMed] [Google Scholar]
- 10.Kruse N, Pette M, et al. Quantification of Cytokine mRNA Expression by RT PCR in Samples of Previously Frozen Blood. Journal of Immunological Methods. 1997;210:195–203. doi: 10.1016/s0022-1759(97)00188-9. [DOI] [PubMed] [Google Scholar]
- 11.Peirson SN, Butler JN, Foster RG.Experimental validation of novel and conventional approaches to quantitative real-time PCR data analysis Nucleic Acids Research 200331pe73 [DOI] [PMC free article] [PubMed] [Google Scholar]
- 12.Morello D. Differential regulation and expression of jun, c-fos and c-myc proto- oncogenes during mouse liver regeneration and after inhibition of protein synthesis. Oncogene. 1990;5:1511–1519. [PubMed] [Google Scholar]
- 13.Li F, Xiang Y, et al. Conditional Deletion of c-myc does not impair liver regeneration. Cancer Research. 2006;66:5608–5612. doi: 10.1158/0008-5472.CAN-05-4242. [DOI] [PubMed] [Google Scholar]
- 14.Columbano A, Ledda-Columbano GM, et al. Increased expression of c-fos, c-jun and LFR-1 is not required for in-vivo priming of hepatocytes by the mitogen TCPOBOP. Oncogene. 1997;14:857–863. doi: 10.1038/sj.onc.1200891. [DOI] [PubMed] [Google Scholar]
- 15.Reinhold MI, Abe M, et al. FGF 18 represses noggin expression and is induced by calcineurin. The Journal of Biological Chemistry. 2004;279:38209–38219. doi: 10.1074/jbc.M404855200. [DOI] [PubMed] [Google Scholar]
- 16.Rossi JM, Dunn NR. Distinct mesodermal signal, including BMPs from the septum transversum mesenchyme, are required in combination for hepatogenesis from the endoderm. Genes and Development. 2001;15:1998–2009. doi: 10.1101/gad.904601. [DOI] [PMC free article] [PubMed] [Google Scholar]
- 17.Ader T, Norel R, et al. Transcriptional profiling implicates TGF-beta/BMP and notch signaling pathways in ductular differentiation of fetal murine hepatoblasts. Mechanisms of Development. 2006;123:177–194. doi: 10.1016/j.mod.2005.10.003. [DOI] [PubMed] [Google Scholar]
- 18.Zhang W, Yatskievych TA, et al. Regulation of hex gene expression and initial stages of avian hepatogenesis by BMP and FGF signaling. Developmental Biology. 2004;268:312–326. doi: 10.1016/j.ydbio.2004.01.019. [DOI] [PubMed] [Google Scholar]
- 19.Castigli E, Chatila T, Geha R, et al. A Protein of the AP-1 Family Is a Component of Nuclear Factor of Activated T Cells. The Journal of Immunology. 1993;150:3284–3290. [PubMed] [Google Scholar]
- 20.Oukka M, Ho IC, et al. The Transcription Factor NFAT4 Is Involved In Generation and Survival of T Cells. Immunity. 1998;9:295–304. doi: 10.1016/s1074-7613(00)80612-3. [DOI] [PubMed] [Google Scholar]
- 21.Neal JW, Clipstone NA. A Constitutively Active NFATc1 Mutant Induces a Transformed Phenotype in 3T3-L1 Fibroblasts. Journal of Biological Chemistry. 2003;278:17246–17254. doi: 10.1074/jbc.M300528200. [DOI] [PubMed] [Google Scholar]


