

Abstract
Fluorescein is one of the most widely used fluorescent probes in microscopy, biotechnology, and clinical assays. One dificulty with fluorescein is its self-quenching, which results in decreased intensities with increasing labeling density. In this study we examined human serum albumin (HSA), which contained one to nine covalently linked fluorescein molecules per molecule of HSA. The occurrence of homo resonance energy transfer for labeling ratios greater than 1 were confirmed by decreases in the relative quantum yields, anisotropies, and lifetimes. We found that most of the self-quenching can be partially eliminated by proximity of the labeled protein to metallic silver particles. These results suggest the use of heavily labeled proteins and metallic colloids to obtain ultrabright reagents for use in immunoassays, imaging, and other applications.
Fluorescein and rhodamine are widely used as fluorescent probes. These probes have the favorable spectral properties of visible absorption and emission wavelengths, high extinction coefficients, and reasonable quantum yields. However, these probes display the undesired property of self-quenching due to nonfluorescent traps in the process of homo resonance energy transfer (RET).1 These traps act as a “sink” for the excited state energy.
Self-quenching of fluorescein and other xantene-type dyes is one of the oldest observations in fluorescence spectroscopy and is due to resonance energy transfer between fluorescein molecules (homo RET). This process was frequently studied by decreases in the quantum yield and polarization or anisotropy of viscous solutions with high probe concentrations [1–6]. In the case of fluorescein the Forster distance for homo RET is about 42Å [7]. Since this distance is comparable to or larger than the size of many proteins, RET is expected to occur when a macromolecule contains more than a single fluorophore. This phenomenon is particularly important for labeled antibodies used in immunoassays, where self-quenching of fluorescein limits the brightness available per labeled protein [8]. In some cases the phenomenon of self-quenching is turned into an advantage and has been used to study protein folding [9], distance measurements [10] or macromolecule association reactions [11,12].
One widespread use of fluorescein is in fluorescence immunoassays, which are widely used in clinical diagnostics and research [13–16]. In this application it is desirable that the labeled antibodies be as bright as possible for maximal sensitivity and observability over sample autofluorescence. However, the obvious approach to increasing the molecule brightness by increasing the extent of labeling is not useful due to self-quenching.
In the present report we describe a new approach to increasing the brightness of heavily labeled macromolecules. We examined human serum albumin (HSA)- labeled covalently with fluorescein-5-isothiocyanate (FITC). We selected HSA, rather than an immunoglobulin, because of its low cost, stability, and affinity for surfaces. Since the phenomenon of homo RET is a through-space interaction, the results obtained using HSA will be directly comparable with antibodies and other labeled macromolecules. We examined fluorescein- labeled HSA when bound to glass (quartz) and to silver island films (SIFs). The SIFs are subwavelength-size particles of metallic silver on a glass substrate. We found that binding of fluorescein-labeled HSA to SIFs eliminated much of the self-quenching. This effect is based on interactions of the fluorophore with free electrons in the metal, the plasmon absorption, which can result in increased quantum yields and increased rates of radiative decay [17,18]. The dramatic difference in the intensity of heavily labeled HSA on glass and on SIFs is shown pictorially in Scheme 1. The effect is dramatic as seen from the nearby invisible intensity on quartz (left) and the bright image on the SIFs (right) in this unretouched photograph. We conclude that SIFs, and most probably colloidal silver, can be utilized to obtain dramatically increased intensities of fluorescein-labeled macromolecules.
Scheme 1.

Photograph of fluorescein-labeled HSA (molar ratio of fluorescein/HSA near 7) on quartz (left) and on a SIF (right) as observed with 430- nm excitation and a 480-nm long-pass filter (Corning 3–71).
Materials and methods
Labeling of HAS
Human serum albumin (2 mg; Sigma) was dissolved in 1ml of 0.1M bicarbonate buffer (pH 9.2) and mixed with 5–90 μl of fluorescein-5-isothiocyanate (Molecular Probes) solution in DMSO (2 mg FITC/200 μl DMSO). The reaction mixture was incubated for 2 h at room temperature and the labeled protein was separated from the unreacted probe by passing over a Sephadex G-25 column equilibrated with 0.1×PBS.
Determining the degree of labeling
The ratio FITC/HSA in stock solution of labeled protein was determined by independent measurements of dye and protein concentrations, respectively. The amount of FITC was calculated using absorbance of FITC–HSA conjugates in 0.1M bicarbonate buffer (pH 9.2) at 495nm and molar extinction coefficient of FITC ε(495 nm)=76,000M−1 cm−1. The HSA concentration was determined by using Coomassie Plus Protein Assay Reagent (Pierce, Rockford, IL, USA). For fluorescence measurements we used the samples with averages FITC/HSA ratios of 1, 3, 7, and 9.
Preparation of silver island films
Silver island film on quartz slides was prepared as described previously [18]. Before SIF deposition quartz slides were covered with poly-lysine (0.01% poly-lysine in 0.1× PBS buffer spin-coated at 3000 rpm) and only half of each slide was coated with SIF.
FITC–HSA deposition
FITC–HSA solution (250 μl, 10 μM) in 0.1× PBS was deposited on each quartz slide (45×12.5 mm, half-coated with SIF) and placed in a humid chamber at 5 °C overnight. Next, slides were washed three times with 0.1× PBS and covered with one part of 0.5-mm demountable cuvette filled with 0.1× PBS. As judged by absorbance measurement at 490 nm of 0.004 for a layer of FITC–HSA (L=9), and using ε(490 nm)= 42,500M−1 cm−1 for fluorescein in 0.1× PBS, the coverage of protein on surface was about 10 pmol cm−2. This density of protein is consistent with a monolayer of protein with an individual diameter of 4 nm.
Fluorescence measurements
All measurements were performed using front-face geometry in 0.5-mm demountable cuvettes (Scheme 2). For measurements on quartz and silver, one side of a demountable cuvette was prepared as described above. The cuvette was filled with buffer. HSA binds spontaneously to the quartz surface and appears to bind to a similar extent to the SIF.
Scheme 2.

Experimental sample geometry.
Emission spectra were measured using an SLM 8000 spectrofluorometer. For the time-resolved frequency-domain measurements, the 514-nm excitation was obtained from a mode-locked argon ion laser, 76MHz repetition rate. The emission was observed through a combination of long-pass 530-nm filter and a 540-nm interference filter, which reduced scattered and/or background signal to less than 1% of the sample signal. Excitation and emission polarizers were oriented vertically and 54.7° from the vertical, respectively.
The FD intensity decays were analyzed in terms of the multiexponential model
| (1) |
where τi are the lifetimes with amplitudes αi and Σ αi = 1.0. Fitting to the multiexponential model was performed as described previously [19,20]. The contribution of each component to the steady state intensity is given by
| (2) |
where the sum in the denominator is over all the decay times and amplitudes. The mean decay time is given by
| (3) |
The amplitude-weighted lifetime is given by
| (4) |
Results
Spectra properties of FITC–HSA in solution
While it is widely known that fluorescein bound to proteins is self-quenched, there is surprisingly little published data on this effect [8]. Hence we first examined the spectral properties of FITC–HSA with molar labeling ratios (L) ranging from 1-to-1 (L=1) to 1-to-9 (L=9). Emission spectra are shown in Fig. 1 for samples which had the same optical density at 490 nm. The relative intensity decreased progressively with increased labeling. The insert in Fig. 1 shows the intensities normalized to the same amount of protein, so that the relative fluorescein concentration increases ninefold along the x axis. It is important to notice that the intensity per labeled protein molecule does not increase and in fact decreases, as the labeling ratio is increased from 1 to 9.
Fig. 1.
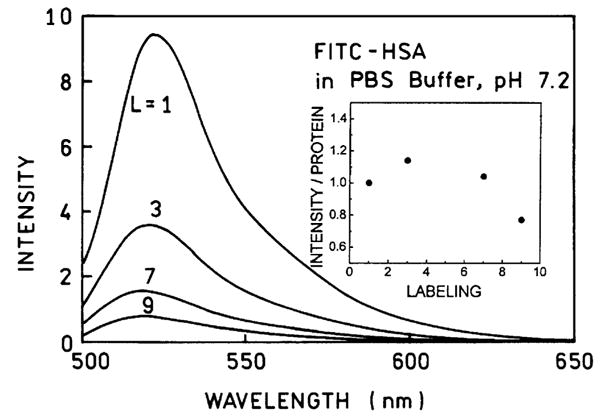
Emission spectra of FITC-labeled HSA solutions. The samples had the same fluorescein absorption at 490 nm.
Self-quenching of fluorescein is expected to decrease the lifetimes, at least under some conditions. Frequency-domain intensity decays are shown in Fig. 2 for labeling ratios of 1 (top) and 7 (bottom). A decreased lifetime is evident from the frequency response shifted to higher frequency. The amplitude-weighted lifetime decreased nearly fourfold for the higher labeling ratio L=7 (Fig. 2, bottom). Additionally, the intensity decay becomes more heterogeneous, as can be seen from the need for these decay times to fit the data (Table 1). Fluorescence depolarization is one of the most reliable indicators of homo transfer [1–6]. Fig. 3 shows the steady state anisotropies for various labeling ratios, further demonstrating homo transfer as the origin of fluorescein self-quenching in our samples.
Fig. 2.

Frequency-domain intensity decays of FITC–HSA with L=1 and L=7.
Table 1.
Multiexponential decay analysis of FITC–HSA
| Conditions | L | 〈τ〉 (ns) | τ̄ (ns) | αi | fi | τi (ns) | ||
|---|---|---|---|---|---|---|---|---|
| Cuvette | 1 | 2.37 | 3.12 | 0.454 | 0.174 | 0.91 | ||
| 0.546 | 0.826 | 3.58 | 0.8 | |||||
| 7 | 0.64 | 1.25 | 0.348 | 0.087 | 0.16 | |||
| 0.517 | 0.457 | 0.56 | ||||||
| 0.135 | 0.456 | 2.15 | 1.4 | |||||
| Quartz | 1 | 1.27 | 1.84 | 0.505 | 0.168 | 0.42 | ||
| 0.495 | 0.832 | 2.13 | 1.2 | |||||
| 7 | 0.077 | 0.345 | 0.907 | 0.569 | 0.048 | |||
| 0.085 | 0.270 | 0.242 | ||||||
| 0.008 | 0.161 | 1.57 | 1.5 | |||||
| SIF | 1 | 0.112 | 0.559 | 0.864 | 0.400 | 0.052 | ||
| 0.117 | 0.328 | 0.314 | ||||||
| 0.019 | 0.272 | 1.60 | 1.4 | |||||
| 7 | 0.016 | 0.123 | 0.897 | 0.280 | 0.005 | |||
| 0.097 | 0.562 | 0.091 | ||||||
| 0.006 | 0.158 | 0.447 | 1.8 |
Fig. 3.
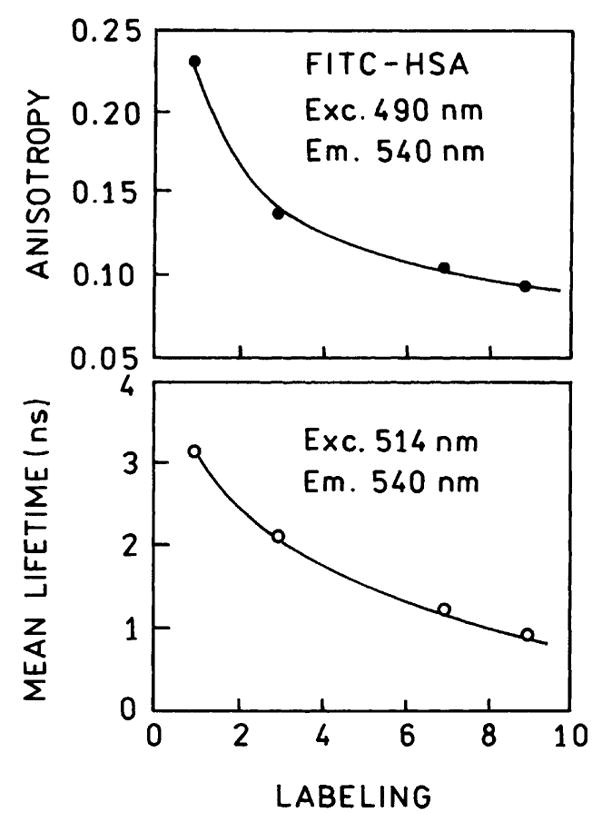
Self-depolarization (top) and self-quenching (bottom) of FITC– HSA observed in a cuvette.
Emission spectra of FITC–HSA on SIFs
The effects of metallic silver were examined using SIFs on quartz. The slides were first coated with poly-lysine, which resulted in shorter-wavelength plasmon absorption maximum and a less-wide absorption than obtained previously for SIFs on quartz without poly-lysine [18] (Fig. 4). Additionally, the silver particles adhered more strongly to the poly-lysine-treated slides than to untreated slides.
Fig. 4.

Absorption spectrum of a SIF on a poly-lysine-treated slide.
We examined the absorption spectra of FITC–HSA on quartz to estimate the amount bound. HSA is known to bind passively to glass surfaces and to form essentially a complete monolayer [21]. For quartz coated with labeled HSA the fluorescein absorption increased roughly linearly with the degree of labeling (Fig. 5). By measuring the absorbance of 0.004 for L=9 we estimate an absorbance near 0.0004 for a monolayer of FITC– HSA with L=1, confirming the presence of a bound monolayer on the quartz surface.
Fig. 5.

Absorption spectra of FITC–HSA adsorbed to poly-lysine-coated quartz slides with L=1 to L=9.
We next examined the emission spectra of FITC– HSA on quartz and SIFs (Fig. 6). The emission intensity for L=1 was increased about fourfold, and for L=7 the intensity was increased 17-fold. The enhancement factor (IS/IQ) increased as the degree of labeling increased (Fig. 7). These results show that proximity of FITC–HSA to metallic silver particles can partially eliminate the self-quenching of fluorescein.
Fig. 6.

Emission spectra of FITC–HSA with the degree of labeling L=1 (top) and L=7 (bottom) on quartz (Q) and SIFs (S).
Fig. 7.

Intensity enhancement of FITC–HSA for various degrees of labeling.
It is informative to consider the intensity per labeled protein molecule (Fig. 8) in the above. In the absence of SIFs the intensity per protein molecule for FITC–HSA bound to quartz decreases as the extent of labeling increases (○) with the maximum intensity seen for an average labeling of fluorescein per HSA molecule (L=1). For FITC–HSA bound to a SIF the intensity is greater than that on quartz for labeling ratios from 1 to 9. The maximum intensity was found for 3 to 6 fluorescein per HSA molecule. We considered the intensities which can be expected for FITC–HSA in the absence of self-quenching (Table 2). For FITC–HSA on quartz the measured intensity decreases to 3% of the expected value for L=9. For FITC–HSA on SIFs the measured intensities do not match the expected values in the absence of self-quenching. However, a significantly larger percentage of the expected intensity is found on the SIFs, 47% at L=3 and 12% at L=9. In the present experiments HSA is directly bound to the SIFs without inert spaces. It is possible that a larger percentage of the maximum intensity, or less self-quenching, may be obtained with modification of the surface chemistry and/or distance to the surface.
Fig. 8.
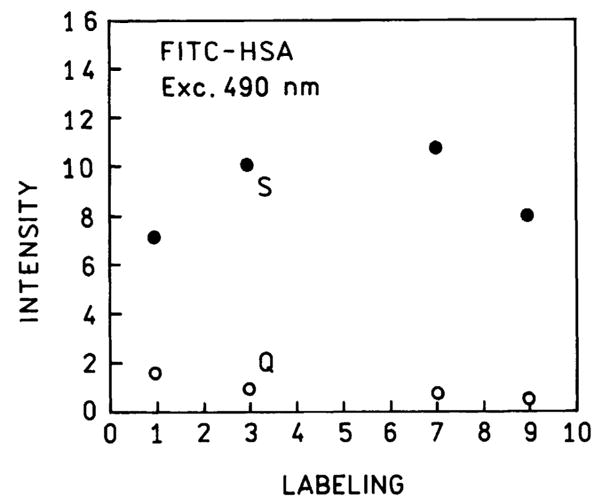
Relative intensities of FITC–HSA on quartz (○) and SIFs (●) for various degrees of labeling. Intensities are corrected to the same protein concentration.
Table 2.
Summary of measured and calculated intensities for FITC–HSA
| Labeling | IS/IQ | 〈τQ〉/〈τS〉 | Relative intensities |
|||||
|---|---|---|---|---|---|---|---|---|
| Quartz |
Silver |
|||||||
| Measured | Max | % | Measured | Max | % | |||
| 1 | 4.47 | 11.34 | 1600 | 1600 | 100 | 7150 | 7150 | 100 |
| 3 | 10.63 | — | 950 | 4800 | 20 | 10,100 | 21,450 | 47 |
| 7 | 16.80 | 4.81 | 640 | 11,200 | 6 | 10,750 | 50,050 | 22 |
| 9 | 16.84 | — | 475 | 14,400 | 3 | 8000 | 64,350 | 12 |
We examined the intensity decays of FITC–HSA on the surfaces. To be certain that scattered light did not contribute to the intensity decays we recorded emission spectra under the precise conditions used for the frequency- domain measurement (Fig. 9). More specifically, we recorded the emission spectra through the filters used for the time-resolved measurements and scanned through the 514-nm excitation wavelength. These spectra showed that scattered light contributed less than 1% to the intensity decay measurements.
Fig. 9.
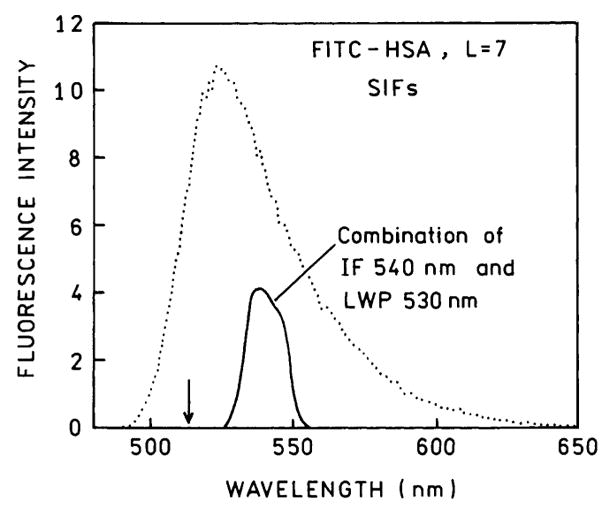
Emission spectra of FITC–HSA recorded without emission filter (…)and through the emission filter used for the time-resolved measurements (—).
Frequency-domain intensity decays are shown for FITC–HSA for L=1 in Fig. 10 and for L=7 in Fig. 11. For L=1 the amplitude-weighted lifetime is reduced 11- fold on the SIFs as compared to quartz. For L=7 the amplitude-weighted lifetime is reduced fivefold relative to quartz. The smaller reduction in lifetime for L=7 suggests a reason for the inability to obtain the expected intensities (Table 2). As the result of a reduced lifetime for the heavily labeled sample the increase in the radiative rate does not completely compensate for the shorter lifetime.
Fig. 10.
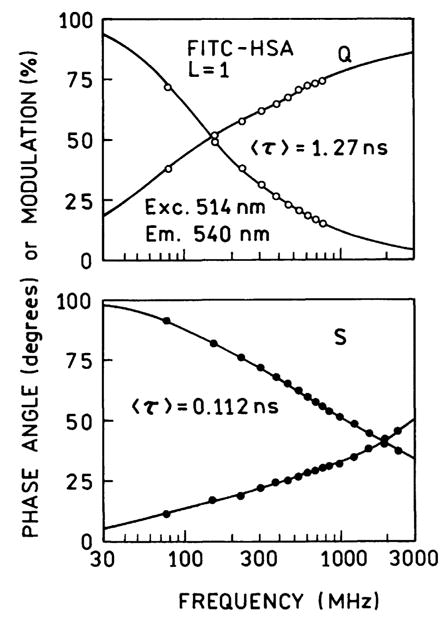
Frequency-domain intensity decays of FITC–HSA (L=1) on quartz (Q, top) and SIFs (S, bottom).
Fig. 11.

Frequency-domain intensity decays of FITC–HSA (L=7) on quartz (Q, top) and SIFs (S, bottom). The solid lines represent the multiexponential fits (Table 1). The dashed lines represent the data for L=1 (Fig. 10).
This speculation is supported by consideration of the relationship between quantum yields and lifetimes. It is well known that the quantum yield (Q) and lifetime (τ) of a fluorophore are given by
| (5) |
and
| (6) |
where Γ is the radiative decay rate and k is the sum of the nonradiative decay rates. The radiative decay rate can be obtained from
| (7) |
Assume that Eqs. (5)–(7) describes the spectral properties of FITC–HSA on quartz (Q) and that a similar set of equations describes the spectral properties on SIFs (S). Then the ratio of the radiative decay rates on silver (ΓS) and quartz (ΓQ) can be obtained from
| (8) |
This equation assumes that the values of k are not altered by the silver. Using the data in Table 2, and using the intensities as quantum yields, we calculated that the radiative decay rate increases 51-fold for L=1 and 87- fold for L=9. This indicates that the metal-induced increase in the rate of radiative decay does not completely offset the decrease in lifetime at higher degrees of labeling. Conversely, if the rate of radiative decay can be increased further then one may obtain the higher expected intensities summarized in Table 2.
Discussion
It is informative to consider how silver-enhanced fluorescence, particularly of a heavily labeled sample, can be used for improved assays. Fig. 12 shows emission spectra of a quartz plate coated with FITC–HSA to which we adjusted the concentration of rhodamine B (0.25 μM) to result in an approximate 1.5-fold larger RhB intensity. One can consider the RhB to be sample autofluorescence or any other interference signal. When the same conditions are used for FITC–HSA on silver with L=1 the fluorescein emission is now two- to threefold higher than that of RhB (Fig. 12, top). When using the heavily labeled sample (L=7) the fluorescein emission becomes dominant (Fig. 12, bottom).
Fig. 12.

Emission spectra of a monolayer of FITC–HSA L=1 (middle) and L=7 (bottom) containing 0.25 μM rhodamine B between the quartz plates (Q) or one SIF (S). The top shows a schematic of this sample with bound fluorescein and free rhodamine B.
In conclusion, silver particles or colloids, when bound to protein heavily labeled with fluorophores, can provide significantly higher intensities due to a decrease in the content of self-quenching.
Acknowledgments
This work was supported by the NIH National Center for Research Resource, RR-08119. The authors thank Dr. Zygmunt Gryczynski for the photograph of the coated slides.
Footnotes
Abbreviations used: FD, frequency domain; FITC, fluorescein-5-isothiocyanate (Isomer I); HSA, human serum albumin; RET, resonance energy transfer; RhB, rhodamine B; SIF(s), silver island film(s); PBS, phosphate-buffered saline; DMSO, dimethyl sulfoxide.
References
- 1.Jablonski J. Self-depolarization and decay of photoluminescence of solutions. Acta Phys Pol. 1955;XIV:295–307. [Google Scholar]
- 2.Bojarski C, Grabowska J, Kulak L, Kusba J. Investigations of the excitation energy transport mechanism in donor-acceptor systems. J Fluoresc. 1991;1:183–191. doi: 10.1007/BF00865365. [DOI] [PubMed] [Google Scholar]
- 3.Knox RS. Theory of polarization quenching by excitation transfer. Physica. 1968;39:361–386. [Google Scholar]
- 4.Bojarski P, Kulak L, Bojarski C, Kawski A. Nonradiative excitation energy transport in one-component disordered systems. J Fluoresc. 1995;5:307–319. doi: 10.1007/BF01152557. [DOI] [PubMed] [Google Scholar]
- 5.Dale RE, Bauer RK. Concentration depolarization of the fluorescence of dyestuffs in viscous solution. Acta Phys Pol A. 1971;40:853–882. [Google Scholar]
- 6.Gocanour CR, Fayer MD. Electronic excited state transport in random systems. Time-resolved fluorescence depolarization measurements. J Phys Chem. 1981;85:1989–1994. [Google Scholar]
- 7.Kawski A. Excitation energy transfer and its manifestation in isotropic media. Photochem Photobiol. 1983;38(4):487–508. [Google Scholar]
- 8.Hemmila IA, editor. Applications of Fluorescence in Immunoassays. Wiley; New York: 1991. p. 113. [Google Scholar]
- 9.Zhuang X, Ha T, Kim HD, Centner T, Labeit S, Chu S. Fluorescence quenching: a tool for single-molecule protein-folding study. Proc Natl Acad Sci USA. 2000;97(26):14241–14244. doi: 10.1073/pnas.97.26.14241. [DOI] [PMC free article] [PubMed] [Google Scholar]
- 10.Kalinin S, Molotkovsky JG, Johansson LBA. Distance measurements using partial donor-donor energy migration within pairs of fluorescent groups in lipid bilayers. J Phys Chem B. 2003;107:3318–3324. [Google Scholar]
- 11.Runnels LW, Scarlata SF. Theory and application of fluorescence homotransfer to melittin oligomerization. Biophys J. 1995;69:1569–1583. doi: 10.1016/S0006-3495(95)80030-5. [DOI] [PMC free article] [PubMed] [Google Scholar]
- 12.Karolin J, Fa M, Wilczynska M, Ny T, Johansson BA. Donor-donor energy migration for determining intramolecular distances in proteins: I. Application of a model to the latent plasminogen activator inhibitor-1 (PAI-1) Biophys J. 1998;74:11–21. doi: 10.1016/S0006-3495(98)77762-8. [DOI] [PMC free article] [PubMed] [Google Scholar]
- 13.Visor GC, Schulman SG. Fluorescence immunoassay. J Pharm Sci. 1981;70(5):469–475. doi: 10.1002/jps.2600700502. [DOI] [PubMed] [Google Scholar]
- 14.Vo-Dinh T, Sepaniak MJ, Griffin GD, Alarie JP. Immunosensors: principles and applications. Immunomethods. 1993;3:85– 92. [Google Scholar]
- 15.Kronick MN, Grossman PD. Immunoassay techniques with fluorescent phycobiliprotein conjugates. Clin Chem. 1983;29(9):1582–1586. [PubMed] [Google Scholar]
- 16.Soini E, Kojola H. Time-resolved fluorometer for lanthanide chelates—a new generation of nonisotropic immunoassays. Clin Chem. 1983;29(1):65–68. [PubMed] [Google Scholar]
- 17.Lakowicz JR. Radiative decay engineering: biophysical and biomedical applications. Anal Biochem. 2001;298:1–24. doi: 10.1006/abio.2001.5377. [DOI] [PMC free article] [PubMed] [Google Scholar]
- 18.Lakowicz JR, Shen Y, D’Auria S, Malicka J, Fang J, Gryczynski Z, Gryczynski I. Radiative decay engineering 2. Effects of silver island films on fluorescence intensity, lifetimes, and resonance energy transfer. Anal Biochem. 2002;301:261–277. doi: 10.1006/abio.2001.5503. [DOI] [PMC free article] [PubMed] [Google Scholar]
- 19.Laczko G, Gryczynski I, Gryczynski Z, Wiczk W, Malak H, Lakowicz JR. A 10-Ghz frequency-domain fluorometer. Rev Sci Instrum. 1990;61:2331–2337. [Google Scholar]
- 20.Lakowicz JR, Laczko G, Cherek H, Gratton E, Limkeman M. Analysis of fluorescence decay kinetics from variable-frequency phase shift and modulation data. Biophys J. 1994;46:463–477. doi: 10.1016/S0006-3495(84)84043-6. [DOI] [PMC free article] [PubMed] [Google Scholar]
- 21.Sokolov K, Chumanov G, Cotton TM. Enhancement of molecular fluorescence near the surface of colloidal metal films. Anal Chem. 1998;70:3898–3905. doi: 10.1021/ac9712310. [DOI] [PubMed] [Google Scholar]