

Abstract
We examined the fluorescence spectral properties of Cy3- and Cy5-labeled oligonucleotides at various distances from the surface of silver island films. The distance to the surface was controlled by alternating layers of biotinylated bovine serum albumin (BSA) and avidin, followed by binding of a biotinylated oligonucleotide. The maximum enhancement of fluorescence near a factor of 12 was observed for the first BSA-avidin layer, with the enhancement decreasing to 2-fold for six layers. The minimum lifetimes were observed for the first BSA-avidin layer, and were about 25-fold shorter than on quartz slides without silver, with the lifetimes being about 2-fold shorter for six BSA-avidin layers. These results suggest that maximum fluorescence enhancements occur about 90 Å from the silver surface, a distance readily obtained by one or two layers of proteins.
In recent publications we described the favorable effects of metallic silver particles on fluorescence [1–3]. In these studies we used silver island films (SIFs),2 which are subwavelength-size silver particles formed by reduction of silver nitrate on a glass surface. The experiments showed that fluorescence intensities could be dramatically increased for fluorophores in close proximity to SIFs, with the largest intensity increases observed for the lowest quantum yield fluorophores. Additionally, the increases in intensity were associated with decreasing lifetimes. These results are consistent with an increase in the radiative decay rate of the fluorophores due to their interactions with the metal. This phenomenon is closely related to surface-enhanced Raman scattering (SERS) and has been the subject of theoretical analysis [4–7]. These theoretical studies predicted that radiative decay rates could be increased 1000-fold or more for fluorophores within 200 Å of a silver particle.
The interactions of fluorophores with metallic particles have been the subject of a number of publications [8–10]. There is reasonable agreement that the maximal enhancements occur about 100 Å from the surface, but some publications report the optimal distance to be as large as 600 Å [11]. In our opinion the use of metallic particles to enhance fluorescence has great potential for advances in medical diagnostics and biotechnological methodology [1]. For this reason we examined the effects of metal-to-fluorophores distance on enhanced fluorescence.
To investigate this distance dependence we use alternating monolayers of biotinylated bovine serum albumin (BSA) and avidin (Scheme 1). It is known that BSA adsorbs as a monolayer onto glass or silver surfaces, and that subsequent exposure to avidin and then biotinylated BSA results in additional monolayers of these proteins [11]. Because of the relevance to genomic analysis, we examined dsDNA oligomers labeled with Cy3 or Cy5 (Scheme 2). An unlabeled biotinylated oligomer was used to bind to the outermost layer of avidin. This biotinylated oligo was previously hybridized to a complementary oligomer labeled with Cy3 or Cy5. By the use of protein layers we found that the maximum increase in intensity and maximum decrease in lifetime were found for a single BSA-avidin layer which positions the fluorophore about 90 Å from the surface. Hence the optimal distance for metal-enhanced fluorescence (MEF) can be readily obtained using protein monolayers.
Scheme 1.
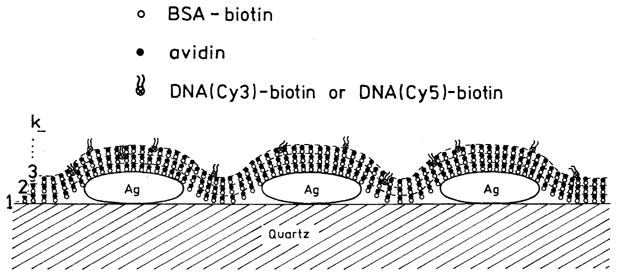
Schematic of BSA-avidin monolayers with labeled DNA.
Scheme 2.
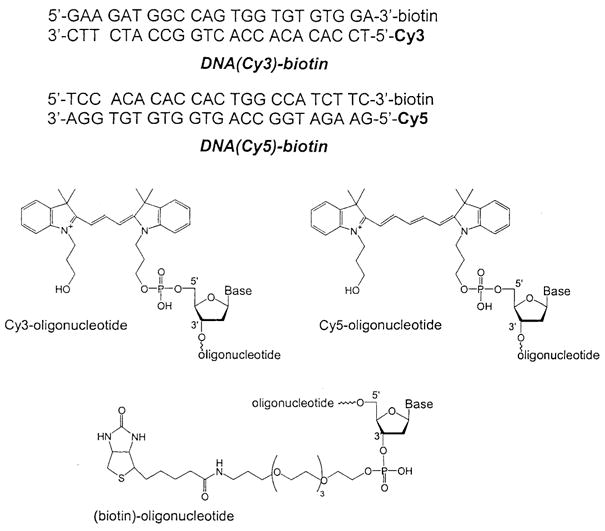
DNA oligomers used in this study.
Materials and methods
The oligonucleotides (Scheme 2) Cy3-5′-TCC ACA CAC CAC TGG CCA TCT TC-3′, 5′-GAA GAT GGC CAG TGG TGT GTG GA-3′-biotin, and 5′-TCC ACA CAC CAC TGG CCA TCT TC-3′-biotin were from Biopolymer Core Facility at the University of Maryland, School of Medicine. Cy5-5′-GAA GAT GGC CAG TGG TGT GTG GA-3′ was from Synthetic Genetics (San Diego, CA).
Silver island film on quartz slides was prepared as described previously [2]. Atomic force microscopy (AFM) studies of silver island films were carried out using a Nanoscope IIIa (Digital Instruments). The image was taken with noncontact silicon nitride probes (NCL-16) manufactured by Nanosensors. The cantilevers with these probes have a resonance frequency of approximately 170 kHz and a nominal spring constant of approximately 40 N/m. Image analyses was carried out using the Digital Instrument Image processing software.
For the fluorescence measurements, each slide (12.5 × 45mm, half-coated with silver island film) was covered with 250 μl of 10 μM BSA-biotin (Sigma) in aqueous solution and placed in humid chamber for 20 h at 5 °C. After washing 3 times with water the slides were placed again in a humid chamber and 250 μl of 5 μM avidin (egg white, Molecular Probes) in 0.1X PBS buffer was deposited on each BSA-biotin-coated surface for 40 min (room temperature). Slides were then washed 3 times with 0.1X PBS buffer. The next layer was built by deposition on each slide of 250 μl of 5 μM BSA-biotin in 0.1X PBS buffer for 40 min, following by washing and by deposition (again for 40 min) of 250 μl of 5 μM avidin in 0.1X PBS. Concentrations of BSA and avidin were calculated using extinction coefficients of ε(280nm) = 43,500 M−1 cm−1 and ε(280nm) = 90,000 M−1 cm−1, respectively.
Solutions of ds-DNA (DNA(Cy3)-biotin, DNA (Cy5)-biotin) were prepared by mixing complementary oligonucleotides in 5 mM Hepes (pH 7.5), 0.1 M KCl, and 0.25 mM EDTA buffer to final concentration 2 μM and very slow cooling after incubation at 70 °C for 2 min. A 250-μl solution of ds-DNA was deposited on each avidin-coated surface for 1 h (room temperature). Next, slides were washed and placed in the buffer solution (5 mM Hepes (pH 7.5), 0.1 M KCl and 0.25 mM EDTA) for 15 min. To protect from scratching during measurements we covered each sample (ds-DNA on multilayer of BSA-biotin-avidin) with one part of a 0.5-mm demountable cuvette filled up with buffer.
Emission spectra were obtained using a SLM 800 spectrofluorometer using 514 nm excitation for Cy3-DNA and 605 nm excitation for Cy5-DNA. In the observation path we used additional 530 and 630 nm long-wave pass filters for Cy3-DNA and Cy5-DNA, respectively. Intensity decays were measured in the frequency domain using instrumentation described previously [12]. For Cy3-DNA the excitation was obtained from a mode-locked argon ion laser, 76-MHz repetition rate, 100-ps pulse width. The Cy3-DNA emission was observed through a combination of a 565-nm interference filter with a long pass 530-nm filter. For Cy5-DNA the excitation was the 3.8-MHz output of a cavity-dumped R6G dye laser, 10-ps pulses. The Cy5 emission was observed through a combination of a 665-nm interference filter with a 630-nm long pass filter. All measurements were performed using front-face geometry in a 0.5-mm demountable cuvettes (Scheme 3).
Scheme 3.
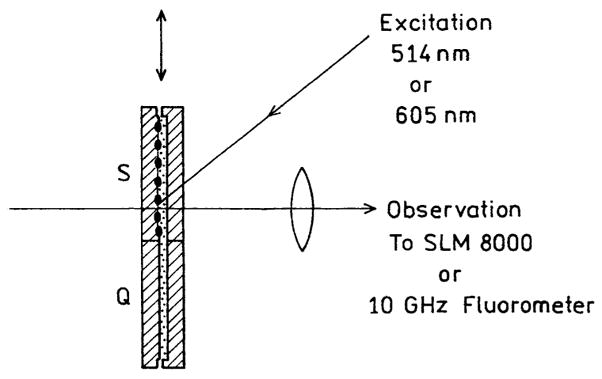
Experimental sample geometry.
The frequency-domain (FD) intensity decay was analyzed in terms of the multiexponential model
| (1) |
where τi is the lifetime with amplitudes αi and Σ αi = 1.0. Fitting to the multiexponential model was performed as described previously [13]. The contribution of each component to the steady-state intensity is given by
| (2) |
The mean decay time is given by
| (3) |
The amplitude-weighted lifetime is given by
| (4) |
Results
Metallic particles and colloids display characteristic absorption spectra due to electron oscillation induced by the incident light, which is called the surface plasmon resonance. Our SIFs display this characteristic absorption (Fig. 1, top) which indicates most of the particles are subwavelength in size. Atomic force microscopy revealed that most of the particles were about 500 nm wide and less than 100 nm high (Fig. 1, bottom). The size of the particles explains the absorption maximum near 440 nm, which for silver in the small particle limit is near 400 nm [14].
Fig. 1.
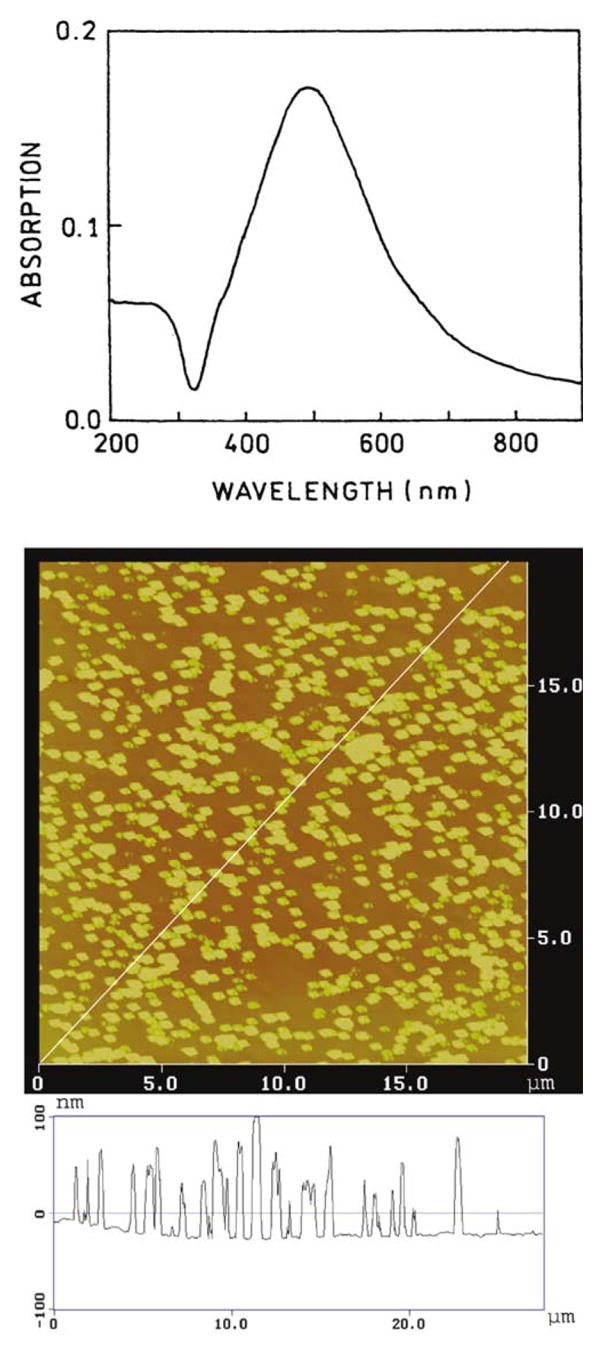
Absorption spectra (top) and AFM image (bottom) of a representative silver island film.
We used absorption spectra to determine the amounts of BSA and avidin bound to the uncoated slides and on the SIFs. Using the density of avidin expected for a monolayer coverage [15], we calculated an optical density of 0.001 for each layer of BSA-biotin-avidin. Absorption spectra are shown in Fig. 2 for 1–6 BSA-biotin-avidin layers on quartz. The optical density increases linearly with the number of protein layers, and the OD is consistent with an almost complete monolayer of each protein.
Fig. 2.
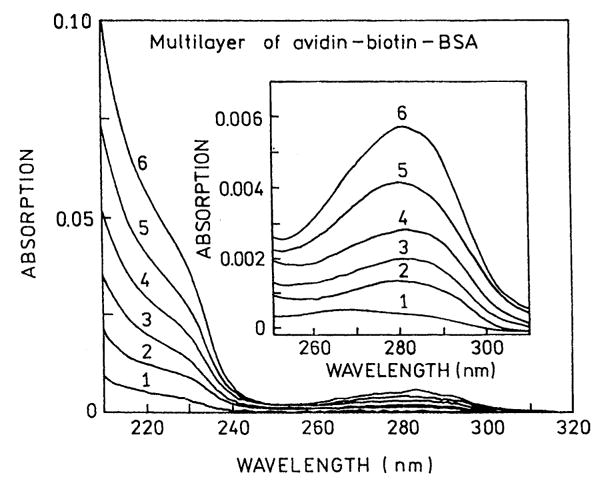
Absorption spectra of BSA-biotin-avidin layers.
Because of the surface plasmon absorption it is more difficult to measure the protein absorption on the SIFs. We were able to reliably measure the absorption of six protein layers (Fig. 3) and found the OD to be consistent with six layers of BSA-biotin-avidin. We conclude that the same amount of protein is bound to the uncoated quartz and on the SIFs, so that differences in fluorescence intensity are not likely to be due to differences in the amount of bound fluorophores.
Fig. 3.
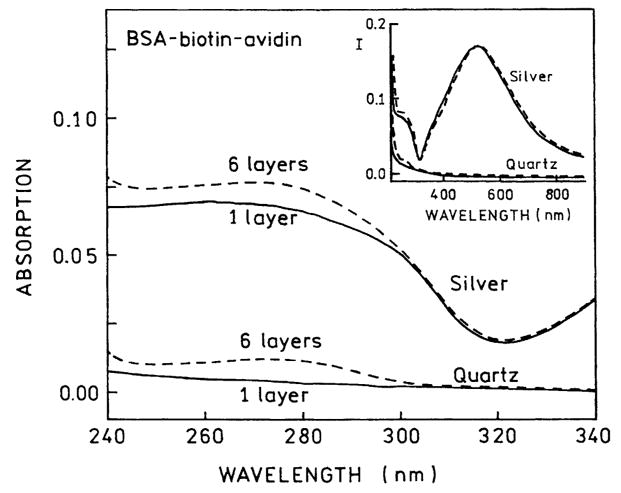
UV absorption of 1 and 6 BSA-biotin-avidin layers on quartz and silver islands.
To determine the effects of SIFs on fluorescence we exposed the protein-coated slides to DNA(Cy3)-biotin or DNA(Cy5)-biotin. Emission spectra are shown in Fig. 4 for the Cy3- and Cy5-labeled oligomers. The highest intensity is seen for the labeled DNA bound to a single layer of BSA-biotin-avidin. The intensity, relative to uncoated quartz, decreases progressively with the number of protein layers to an enhancement near 2 for six layers. We note that the intensities were measured relative to that found for the labeled oligomers on quartz with the same number of protein layers. We noticed a progressive increase in the intensity of both probes on quartz with increasing numbers of protein layers, with the overall increase being about 3-fold for six layers. We interpret this increase as due to penetration of the labeled DNA to lower layers of BSA-biotin-avidin. Assuming this interpretation is correct then the 2-fold enhancements seen for six layers may be an overestimate of the actual enhancement for six protein layers. This penetration may explain the difference between our results and that of Sokolov et al. [11] who found increasing enhancements of fluorescein out to six layers. It was not clear from the article whether they considered the penetration of deeper protein layers. An increasing amount of bound fluoresceinbiotin, and normalization of the signal to that with a single layer of protein, would explain the apparent increase in intensity out to six layers reported in [11].
Fig. 4.
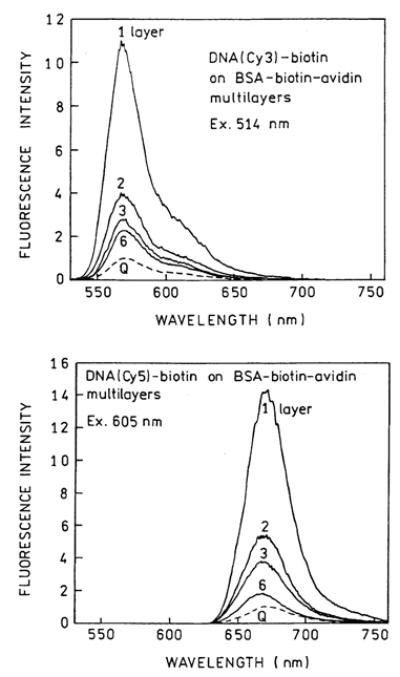
Emission spectra of DNA(Cy3)-biotin (top) and DNA(Cy5)-biotin (bottom) on BSA-biotin-avidin layers. Spectra are normalized to the spectrum on quartz (Q) with the same number of protein layers.
Prior to measurements of the intensity decays we recorded control emission spectra to test for the possibility of scattered light. These control spectra were important because one can obtain large scattering intensities from the surfaces of the slides, and possibly from the metal particles which are known to be strongly scattering [16–18]. We recorded the emission spectra through the emission filters which were used for the time-resolved measurements (Fig. 5), and scanned the emission monochromator through the excitation wavelengths. These spectra showed that the emission filters effectively removed the scattered light so its total contribution was less than 1%.
Fig. 5.
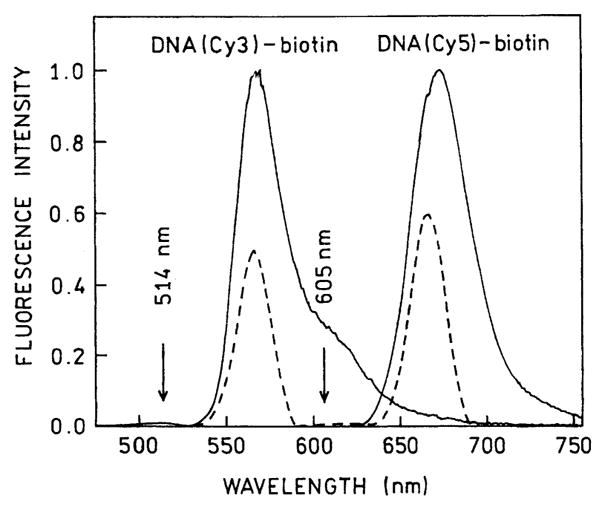
Emission spectra of DNA(Cy3)-biotin and DNA(Cy5)-biotin on three layers of BSA-biotin-avidin deposited on silver, through the filters used for time-resolved measurements (– – –). For both excitations, 514 and 605 nm, the backgrounds from scattering were less than 1%.
We measured the frequency-domain intensity decays of Cy5- and Cy3-labeled oligomers with increasing numbers (k) of protein layers (Figs. 6 and 7). For both probes the frequency responses were most shifted to higher frequencies for the first protein layers, with the smallest shift found for six layers. For better visualization the recovered multiexponential decays (Tables 1 and 2) are shown as the time-domain impulse response functions in Figs. 8 and 9. In both cases the silver island films result in a short decay time component in the intensity decays, the amplitude of which is largest for the smaller number of protein layers. In contrast, the intensity decays on quartz are mostly independent of the number of protein layers. A short lifetime component remains in the intensity decays even with six layers, but its value becomes somewhat longer with increasing numbers of layers, 6–69 ps for Cy3 and 14–94 ps for Cy5 (Tables 1 and 2).
Fig. 6.
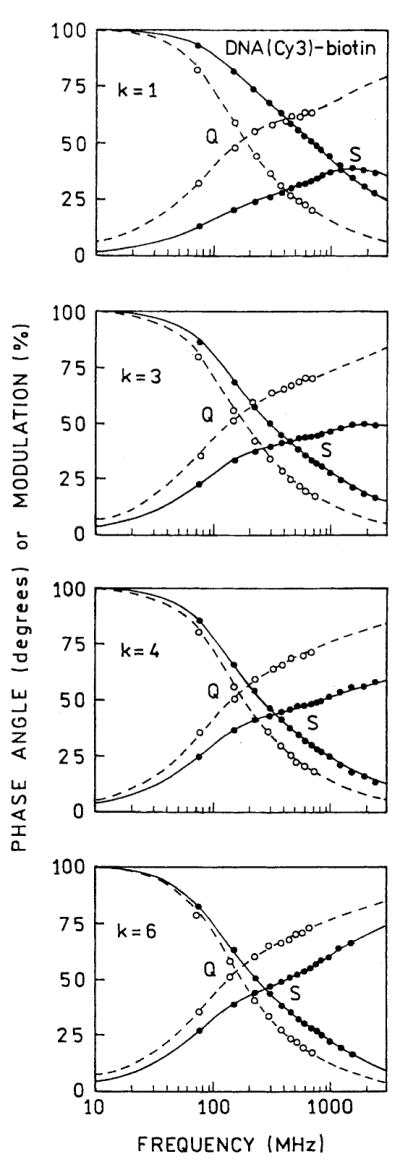
Frequency-domain intensity decays of DNA(Cy3)-biotin on BSA-biotin-avidin multilayers deposited on quartz (Q) and silver (S). k is the number of BSA-biotin-avidin layer.
Fig. 7.
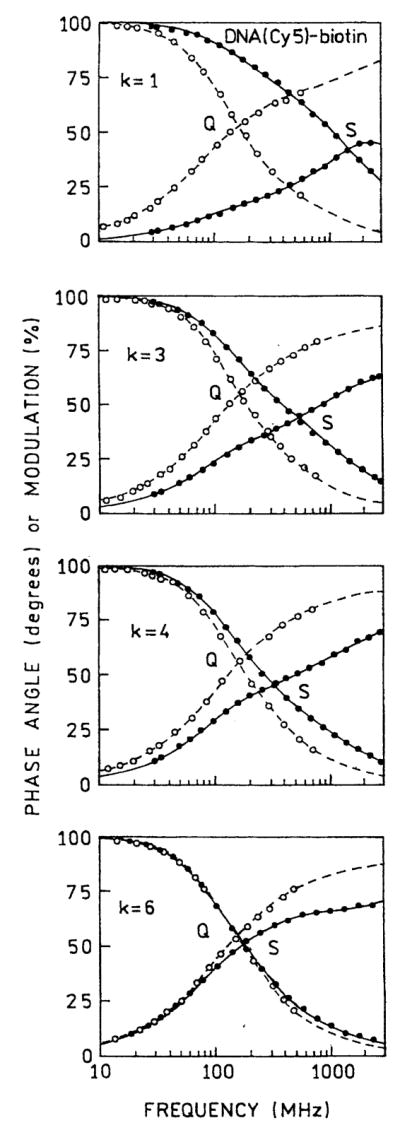
Frequency-domain intensity decays of DNA(Cy5)-biotin on BSA-biotin-avidin multilayers deposited on quartz (Q) and silver (S). k is the number of BSA-biotin-avidin layers.
Table 1.
Multiexponential analysis of DNA(Cy3)-biotin intensity decays
| Conditions | k | 〈τ〉 (ns) | τ̄(ns) | αi | fi | τi (ns) | ||
|---|---|---|---|---|---|---|---|---|
| Quartz | 1a | 0.82b | 1.36c | 0.506 | 0.104 | 0.17 | ||
| 0.494 | 0.896 | 1.49 | 1.0 | |||||
| 2 | 0.96 | 1.42 | 0.417 | 0.078 | 0.18 | |||
| 0.583 | 0.922 | 1.53 | 1.8 | |||||
| 3 | 1.07 | 1.49 | 0.379 | 0.077 | 0.22 | |||
| 0.621 | 0.923 | 1.60 | 1.1 | |||||
| 4 | 1.07 | 1.45 | 0.358 | 0.071 | 0.21 | |||
| 0.642 | 0.929 | 1.54 | 1.4 | |||||
| 5 | 1.08 | 1.47 | 0.381 | 0.088 | 0.25 | |||
| 0.619 | 0.912 | 1.59 | 0.9 | |||||
| 6 | 1.17 | 1.52 | 0.358 | 0.081 | 0.26 | |||
| 0.642 | 0.919 | 1.63 | 1.7 | |||||
| Silver | 1 | 0.030 | 0.531 | 0.925 | 0.175 | 0.006 | ||
| 0.062 | 0.347 | 0.183 | ||||||
| 0.013 | 0.448 | 1.029 | 0.9 | |||||
| 2 | 0.079 | 0.660 | 0.842 | 0.159 | 0.015 | |||
| 0.117 | 0.281 | 0.191 | ||||||
| 0.041 | 0.560 | 1.082 | 1.7 | |||||
| 3 | 0.149 | 0.949 | 0.740 | 0.088 | 0.018 | |||
| 0.180 | 0.221 | 0.186 | ||||||
| 0.080 | 0.691 | 1.296 | 1.6 | |||||
| 4 | 0.274 | 1.047 | 0.581 | 0.069 | 0.032 | |||
| 0.274 | 0.202 | 0.201 | ||||||
| 0.145 | 0.729 | 1.379 | 1.6 | |||||
| 5 | 0.388 | 1.102 | 0.421 | 0.051 | 0.048 | |||
| 0.378 | 0.211 | 0.217 | ||||||
| 0.201 | 0.737 | 1.432 | 1.2 | |||||
| 6 | 0.500 | 1.179 | 0.295 | 0.040 | 0.069 | |||
| 0.460 | 0.221 | 0.242 | ||||||
| 0.245 | 0.739 | 1.519 | 1.1 |
Number of BSA-biotin-avidin layers.
〈τ〉 = Σαiτi.
τ̄ = Σ fiτi, .
Table 2.
Multiexponential analysis of DNA(Cy5)-biotin intensity decays
| Conditions | k | 〈τ〉 (ns) | τ ¯(ns) | αi | fi | τ (ns) | ||
|---|---|---|---|---|---|---|---|---|
| Quartz | 1a | 1.00b | 1.40c | 0.369 | 0.085 | 0.22 | ||
| 0.604 | 0.915 | 1.51 | 0.9 | |||||
| 2 | 1.17 | 1.42 | 0.252 | 0.051 | 0.23 | |||
| 0.748 | 0.949 | 1.48 | 0.9 | |||||
| 3 | 1.25 | 1.40 | 0.173 | 0.044 | 0.32 | |||
| 0.827 | 0.956 | 1.45 | 1.7 | |||||
| 4 | 1.35 | 1.43 | 0.155 | 0.064 | 0.56 | |||
| 0.845 | 0.936 | 1.49 | 1.5 | |||||
| 5 | 1.37 | 1.46 | 0.139 | 0.051 | 0.50 | |||
| 0.861 | 0.949 | 1.51 | 0.9 | |||||
| 6 | 1.49 | 1.63 | 0.147 | 0.041 | 0.42 | |||
| 0.853 | 0.959 | 1.68 | 1.8 | |||||
| Silver | 1 | 0.057 | 0.392 | 0.822 | 0.204 | 0.014 | ||
| 0.160 | 0.479 | 0.168 | ||||||
| 0.018 | 0.317 | 0.975 | 1.7 | |||||
| 2 | 0.152 | 0.626 | 0.716 | 0.174 | 0.037 | |||
| 0.231 | 0.399 | 0.263 | ||||||
| 0.053 | 0.427 | 1.209 | 1.0 | |||||
| 3 | 0.266 | 0.830 | 0.467 | 0.064 | 0.036 | |||
| 0.406 | 0.335 | 0.218 | ||||||
| 0.127 | 0.601 | 1.256 | 1.8 | |||||
| 4 | 0.428 | 1.009 | 0.427 | 0.067 | 0.067 | |||
| 0.358 | 0.230 | 0.275 | ||||||
| 0.215 | 0.703 | 1.400 | 1.9 | |||||
| 5 | 0.446 | 1.030 | 0.498 | 0.105 | 0.094 | |||
| 0.288 | 0.224 | 0.348 | ||||||
| 0.214 | 0.671 | 1.406 | 1.0 | |||||
| 6 | 0.691 | 1.473 | 0.457 | 0.038 | 0.057 | |||
| 0.191 | 0.109 | 0.396 | ||||||
| 0.352 | 0.853 | 1.675 | 0.9 |
Number of BSA-biotin-avidin layers.
〈τ〉 = Σαiτi.
τ̄ = Σ fiτi, .
Fig. 8.

Time-domain representation of emission intensity decays of DNA(Cy3)-biotin on BSA-biotin-avidin multilayers deposited on quartz (left) and silver (right).
Fig. 9.
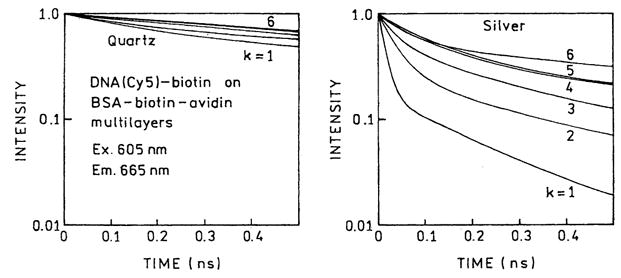
Time-domain representation of emission intensity decays of DNA(Cy5)-biotin on BSA-biotin-avidin multilayers deposited on quartz (left) and silver (right).
The intensity enhancements and ratios of amplitude-weighted lifetimes for Cy3 and Cy5 with different numbers of protein layers are shown in Figs. 10 and 11, respectively. The largest enhancements and shortest lifetimes were found for the first layer of BSA-biotin-avidin. The effect decreases more than 50% for the second layer and is essentially constant for the next four protein layers. We believe that the effect is minimal in the third and the higher layers and the residual effects above four layers are due to labeled oligomers which penetrate into the protein underlayers.
Fig. 10.
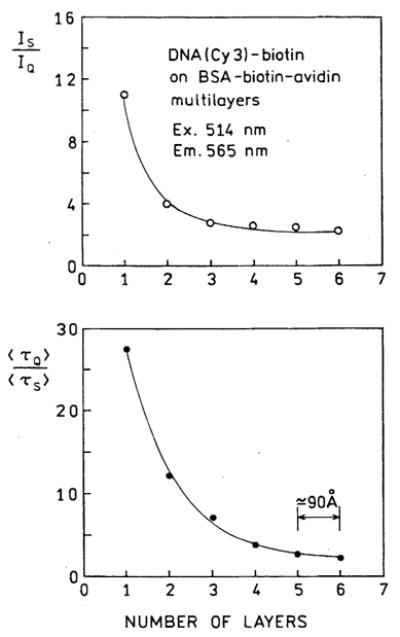
Dependence of intensity (top) and lifetime (bottom) experiments of DNA(Cy3)-biotin on the distance from SIFs.
Fig. 11.
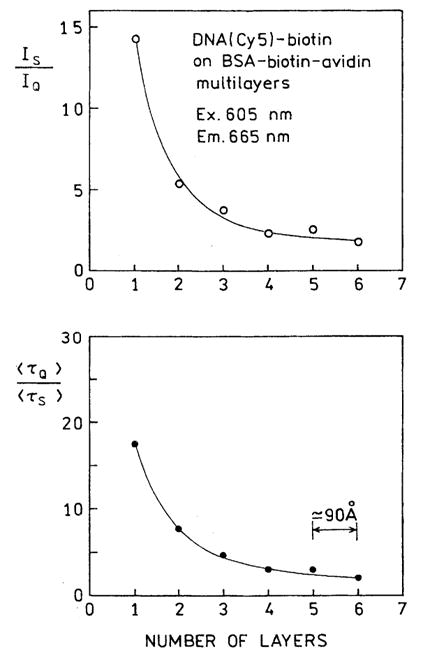
Dependence of intensity (top) and lifetime (bottom) experiments of DNA(Cy5)-biotin on the distance from SIFs.
Discussion
What is the distance from the silver surface yielding this largest increase in fluorescence intensity? In Fig. 12 we summarized the intensity and lifetime ratios found for increasing numbers of BSA-biotin-avidin layers. On this same figure we included results from two other experiments in which we examined Cy3- and Cy5-labeled oligomers which were bound to amine-coated slides [19] (distance near zero) and on slides coated only with a single layer of avidin [20], which we took to be 50 Å thick. These results showed that the optimal enhancements with SIFs is obtained with distances from the metal of 50–90 Å.
Fig. 12.
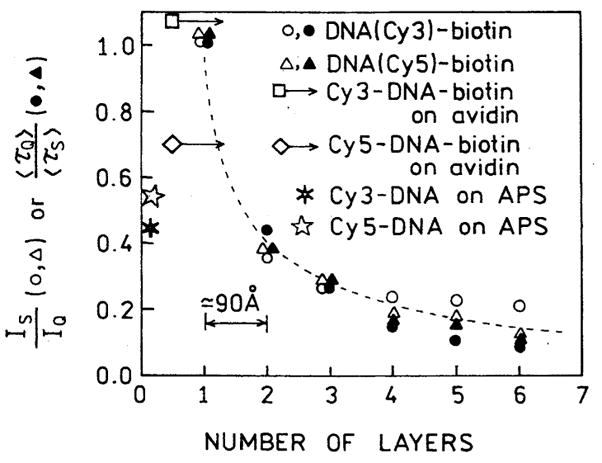
Fluorescence enhancements of Cy3- and Cy5-labeled oligomers for various distances from the silver surface. Also shown are the enhancements found on amine-coated slides which were treated with 3-aminopropyltriethoxysilane (APS) [19] and slides with a single layer of avidin [20].
The effects of metallic particles on fluorophores can be understood at a fundamental level using theoretical models which describes the photophysical interactions [4–7]. However, these models are complex and not immediately useful for designing systems for metal-enhanced fluorescence. Hence we analyzed our data (Figs. 10–12) in terms of a phenomenological model which accounts for the expected interactions. These interactions are an increase in the nonradiative decay rate (knr) by a factor Nnr, which is thought to occur at short fluorophore-metal distances, an increase in the rate of radiative decay (Γ) by a factor Nr, and an increase in the rate of excitation by a factor Nex. In the absence of metal the quantum yield (Q) and lifetime (τ) of the fluorophore are given by
| (5) |
| (6) |
where Γ is the radiative decay rate and knr is the non-radiative decay rate, both in the absence of metal.
Now assume that the fluorophore is in interactive proximity with the metal surface at a distance d which alters the spectral parameters. The rate of quenching, emission, and excitation are increased by factors which depend on distance
| (7) |
| (8) |
| (9) |
where dn, dr, and de are the characteristic distances over which these effects decrease 1/e exponentially.
Using these expressions the quantum yield, lifetime, and total intensity (Im) at a distance d are given by
| (10) |
| (11) |
| (12) |
where Im and I0 are the measured intensities in the presence and absence of metal, respectively. In Eqs. (10)–(12) we did not explicitly include the distance d which is understood to be contained within the N factors.
We used this model to compare with our measured intensities and lifetimes of DNA(Cy3)-biotin and DNA(Cy5)-biotin at various distances from the SIFs. The six parameter values in Eqs. (7)–(9) were recovered by least-squares analysis to obtain a reasonable fit to the data (Figs. 13 and 14). We were able to obtain good fit to our data with reasonable parameter values (Table 3). We recognize that these values may not be optimal, but a good fit seemed to be unique for this range of parameter values. These calculations reveal (Table 3) that the quenching is very strong at short distances but decays by 1/e for each 8.5 Å. In contrast, excitation is increased by a factor from 22 to 94 and occurs over longer distances of 25–42 Å. Importantly, the radiative rate is increased by a larger factor and this increase continues to over 120 Å. Taken together these parameters explain the largest intensity increase between 50 and 100 Å and the large decrease in lifetime observed at short distances (Figs. 13 and 14). This is a fortunate result since one can readily obtain such distances with one or two layers of adsorbed proteins.
Fig. 13.
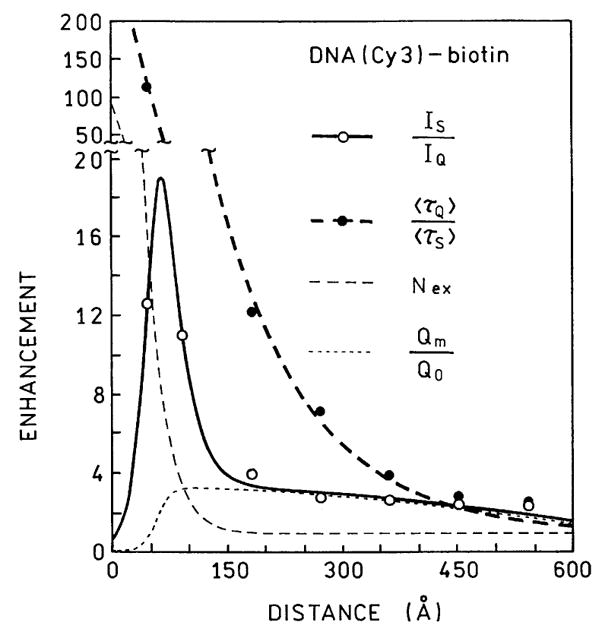
Comparison of the measured lifetimes and intensities of DNA (Cy3)-biotin with values calculated using the parameter values in Table 3.
Fig. 14.
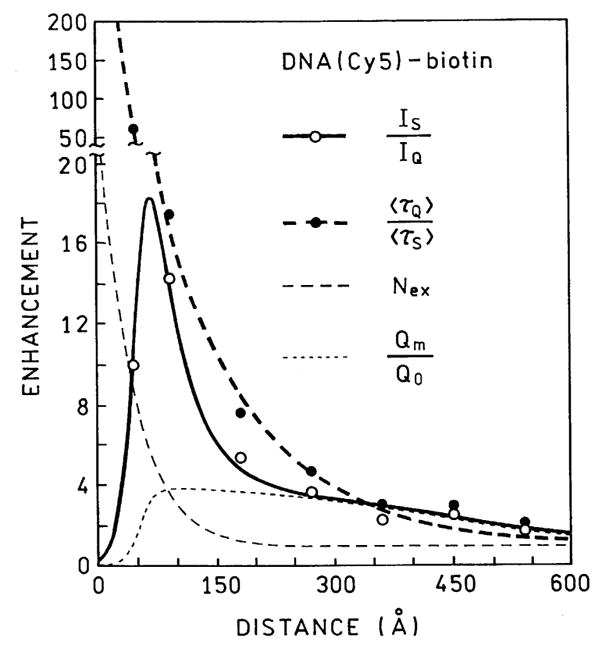
Comparison of the measured lifetime and intensities of DNA (Cy5)-biotin with values calculated using the parameter values in Table 3.
Table 3.
Phenomenological constants describing the intensities of Cy3 and Cy5 with SIFs
| Parameter | Probe |
||
|---|---|---|---|
| Cy3 | Cy5 | ||
|
|
38,000 | 12,300 | |
| dn (Å) | 8.5 | 8.5 | |
|
|
186 | 128 | |
| dr (Å) | 119 | 126 | |
|
|
94 | 22 | |
| de (Å) | 25 | 42 | |
It is informative to examine the distance-dependent values of the enhancement factor (N(d)) for the nr, r, or ex effects. The normalized distance-dependent factors are plotted in Fig. 15 for DNA(Cy3)-biotin. This figure shows that the quenching interaction occurs mostly below 20 Å, enhanced excitation occurs below 40 Å, and increases in the radiative rate occur to a distance over 100 Å.
Fig. 15.
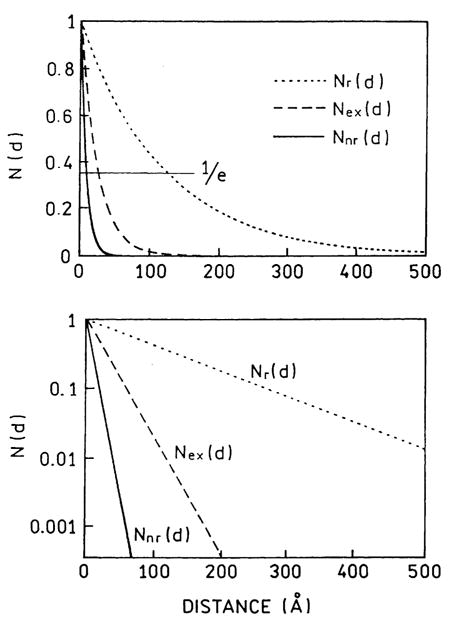
Distance-dependent values of the enhancement factor for quenching (Nnr), the radiative rate (Nr), and excitation (Nex) for DNA(Cy3)-biotin.
In summary, these results suggest that metal-enhanced fluorescence can be conveniently applied to DNA analysis whenever increased signals yield improved measurements.
Acknowledgments
This work was supported by the NIH National Center for Research Resources, RR-08119 and the National Institute of Biomedical Imaging and Bioengineering, EB000682. The authors thank Dr. J. Fang from the Center for Biomolecular Science and Engineering, Naval Research Laboratory, for the AFM measurements.
Footnotes
Abbreviations used: Cy3, N, N′-(dipropyl)tetramethylindocarbocyanine; Cy5, N, N′-(dipropyl)tetramethylindodicarbocyanine; BSA, bovine serum albumin; FD, frequency domain; MEF, metal-enhanced fluorescence; SERS, surface-enhanced Raman scattering; SIFs, silver island films.
References
- 1.Lakowicz JR. Radiative decay engineering: Biophysical and biomedical applications. Appl Biochem. 2001;298:1–24. doi: 10.1006/abio.2001.5377. [DOI] [PMC free article] [PubMed] [Google Scholar]
- 2.Lakowicz JR, Shen Y, D’Auria S, Malicka J, Gryczynski Z, Gryczynski I. Radiative decay engineering, 2. Effects of silver island films on fluorescence intensity, lifetimes and resonance energy transfer. Anal Biochem. 2002;301:261–277. doi: 10.1006/abio.2001.5503. [DOI] [PMC free article] [PubMed] [Google Scholar]
- 3.Lakowicz JR, Gryczynski I, Shen Y, Malicka J, Gryczynski Z. Intensified fluorescence. Photon Spectra. 2001:96–104. [Google Scholar]
- 4.Gersten J, Nitzan A. Spectroscopic properties of molecules interacting with small dielectric particles. J Chem Phys. 1981;75:1139–1152. [Google Scholar]
- 5.Chew H. Transition rates of atoms near spherical surfaces. J Chem Phys. 1987;87:1355–1360. [Google Scholar]
- 6.Das PC, Puri A. Energy flow and fluorescence near a small metal particle. Phys Rev B. 2002;65:155416–155418. [Google Scholar]
- 7.Moskovits M. Surface-enhanced spectroscopy. Rev Mod Phys. 1985;57:783–826. [Google Scholar]
- 8.Wokaun A, Lutz HP, King AP, Wild UP, Ernst RR. Energy transfer in surface enhanced fluorescence. J Chem Phys. 1983;79:509–514. [Google Scholar]
- 9.Tarcha PJ, DeSaja-Gonzalez J, Rodriquez-Llorente S, Aroca R. Surface-enhanced fluorescence on SiO2 coated silver island films. Appl Spectrosc. 1999;53:43–48. [Google Scholar]
- 10.German AE, Gachko GA. Dependence of the amplification of giant Raman scattering and fluorescence on the distance between an adsorbed molecule and a metal surface. J Appl Spectrosc. 2001;68:987–992. [Google Scholar]
- 11.Sokolov K, Chumanov G, Cotton TM. Enhancement of molecular fluorescence near the surface of colloidal metal films. Anal Chem. 1998;70:3898–3905. doi: 10.1021/ac9712310. [DOI] [PubMed] [Google Scholar]
- 12.Laczko G, Gryczynski I, Gryczynski Z, Wiczk W, Malak H, Lakowicz JR. A 10-GHz frequency-domain fluorometer. Rev Sci Instrum. 1990;61:2331–2337. [Google Scholar]
- 13.Lakowicz JR, Laczko G, Cherek H, Gratton E, Limkeman M. Analysis of fluorescence decay kinetics from variable-frequency phase shift and modulation data. Biophys J. 1994;46:463–477. doi: 10.1016/S0006-3495(84)84043-6. [DOI] [PMC free article] [PubMed] [Google Scholar]
- 14.Bohren CF, Huffman DR. Absorption and Scattering of Light by Small Particles. Wiley; New York: 1983. [Google Scholar]
- 15.Ebersole RC, Miller JA, Moran JR, Ward MD. Spontaneously formed functionally active avidin monolayers on metal surfaces: a strategy for immobilizing biological reagents and design of piezoelectric biosensors. J Am Chem Soc. 1990;112:3239–3241. [Google Scholar]
- 16.Yguerabide J, Yguerabide EE. Light-scattering submicroscopic particles as highly fluorescent analogs and their use as tracer labels in clinical and biological applications, I. Theory. Anal Biochem. 1998;262:137–156. doi: 10.1006/abio.1998.2759. [DOI] [PubMed] [Google Scholar]
- 17.Yguerabide J, Yguerabide EE. Light-scattering submicroscopic particles as highly fluorescent analogs and their use as tracer labels in clinical and biological applications, II. Experimental characterization. Anal Biochem. 1998;262:157–176. doi: 10.1006/abio.1998.2760. [DOI] [PubMed] [Google Scholar]
- 18.Schultz S, Smith DR, Mock J, Schultz DA. Single-target molecule detection with nonbleaching multicolor optical immunolabels. Proc Natl Acad Sci USA. 2000;97(3):996–1001. doi: 10.1073/pnas.97.3.996. [DOI] [PMC free article] [PubMed] [Google Scholar]
- 19.Lakowicz JR, Malicka J, Gryczynski I. Silver particles enhance the emission of fluorescent DNA oligomers. BioTechniques. 2003 doi: 10.2144/03341st01. in press. [DOI] [PMC free article] [PubMed] [Google Scholar]
- 20.Malicka J, Gryczynski I, Fang J, Lakowicz JR. Fluorescence spectral properties of cyanine dye-labeled DNA oligomers on surfaces coated with silver particles. Anal Biochem. 2003 doi: 10.1016/S0003-2697(03)00005-8. in press. [DOI] [PMC free article] [PubMed] [Google Scholar]